Sample Category Title
Oil Jumps, Gold Directionless
Oil surges on lower omicron concerns
The Fauci comments overnight saw more fast money returning to the long oil trade as markets started pricing a resumption of the global recovery and higher oil consumption. Brent crude leapt 5.40% higher to USD 73.65 a barrel, while WTI jumped 5.45% higher to USD 70.00 a barrel. In Asia, Brent has added 0.55% to USD 74.05, and WTI has added 0.90% to USD 70.65 a barrel.
Both contracts have quite a bit more upside potential, assuming the mild omicron reality is correct. The technical indicators are neutral but most especially, despite OPEC+ raising production quotas once again this month, the grouping continues to struggle to even meet its previously outlined increases. Virus volatility aside, that and OPEC+’s optionality over immediately changing the targets from the last meeting, which remains officially open, should provide a healthy modicum of support on any material pullbacks. Oil will be immune to a more hawkish FOMC next week.
Both contracts have recovered above their respective 100-day moving averages and if investor sentiment remains positive Brent crude can retest USD 76.00 and WTI USD 73.00 before the end of the week. I continue to believe that the lows of last week could well be the lows for the next year.
Gold remains marooned
Gold had another directionless session as it remains forgotten by the investor community, particularly those bullish traders who have been so badly whipsawed over the last month. Gold drifted 0.30% lower to USD 1778.50 an ounce overnight as US yields firmed, only to reverse that in Asia, rising 0.20% to USD 1782.50 an ounce.
In the bigger picture, gold looks set to trade in a rough USD 1770.00 to USD 1800.00 an ounce range this week, unable to sustain momentum above or below those levels. The 50,100 and 200-day moving averages (DMAs), clustered between USD 1791.00 and USD 1793.50 provides immediate resistance, followed by USD 1800.00. Support lies at USD 1770.00 and USD 1760.00.
Gold could still stage a modest recovery this week, but if the US yield curve continues steepening, that may never eventuate, especially if US CPI data on Friday is likely to print around 7.0%. Gold remains a sell on rallies to USD 1810.00. The balance of risks still favours a move lower towards USD 1720.00 an ounce.
US Dollar Drifting
Currency markets content to range trade
Currency markets showed little reaction to the Fauci omicron comments overnight, having already put the new variant behind it to focus on the upcoming FOMC meeting next week. That sentiment saw the US Dollar drift higher in a benign session, the dollar index rising 0.15% to 96.30 before falling slightly to 96.24 in Asia as currency markets continue to drift.
The Fed taper once again pushed USD/JPY higher as the US yield curve steepened once again overnight, USD/JPY rising 0.60% to 113.50, before adding another 0.20% to 113.70 in Asia. If we have indeed seen “peak omicron,” the 112.50 lows seen last week could well be the lows for the cross for the foreseeable future.
EUR/USD, GBP/USD are marking time around 1.1290 and 1.3285 with both vulnerable to a resumption of their medium-term downtrends next week if the BOE and ECB remain on hold while the FOMC speeds up tapering. AUD/USD rallied 0.40% today to 0.7080 after the RBA remained on hold but left the door slightly cracked for a faster unwinding of loose policy in the future. NZD/USD is treading water at 0.6760 with some yen cross buying supporting both. Further gains are likely to be harder to come by if the US dollar remains firm.
The US dollar has weakened across the board versus Asian currencies thanks to the rebound in investor sentiment on weaker omicron fears. USD/Asia is down approximately 0.15% today in a quiet session. Looking ahead, as the market swings back to pricing in a fast Fed-taper and earlier rate hike life off, the rally by Asian currencies is likely to stall and reverse into next week.
World Stock Indices Have Demonstrated Growth SInce The New Omicron Strain Turned Out To Be Less Dangerous Than Expected
Omicron's latest research suggests that the new strain of the coronavirus is less dangerous than expected. The US stock indices closed higher on Monday as easing concerns about the impact of the Omicron Covid-19 strain resumed investor views on cyclical and technology stocks. At the close of the stock exchange, the Dow Jones Industrial Average (US30) increased by 1.87%, the S&P 500 Index (US500) added 1.17% and the Nasdaq Composite Index (US100) increased by 0.93%.
Tesla CEO Elon Musk said that the US Congress should not approve the Biden administration's bill to increase subsidies for electric cars, saying that the proposal would worsen the country's budget deficit.
The Securities and Exchange Commission (SEC) launched an investigation into Tesla's solar panels due to their possible spontaneous self-burning. Shares of Lucid Group fell 5.1% yesterday after it was reported that SEC had sued the electric car maker Lucid over a deal that took the company public this summer.
The European stock market closed in the green area yesterday. Investors have started to move funds from safe-haven assets to the stock market as Omicron risks have decreased and stock prices are at good levels now. Germany's DAX (DE40) increased by 1.4%, Britain's FTSE 100 (UK100) added 1.54%, France's CAC40 (FR40) gained by 1.5%, and Spain's IBEX (ES35) jumped by 2.4%. In Germany, electricity prices are approaching a new record. Germany's industrial production increased sharply by 2.8% last month, while analysts had expected a 0.8% increase.
The capitalization of the Airbus aircraft manufacturing group rose by 4.6%. The company's helicopter division received an order to supply 26 helicopters for Saudi Arabia during French President Emmanuel Macron's visit to Riyadh.
Carbon prices reached a new high of 81.64 euros per ton. Carbon is up nearly 150% this year.
China has eased its monetary policy by cutting reserve requirements for banks for the second time in 2021. The People's Bank of China will cut the reserve requirement ratio for most banks by 0.5 percentage points next week.
Asia-Pacific stock markets rose in Tuesday's trading, following the positive dynamics of US and European stock indexes. Japan's Nikkei 225 Index (JP225) gained 1.89%, Hong Kong's Hang Seng (HK50) jumped by 2.48%, and Australia's ASX 200 (AU200) added 0.95%.
Shares of Japan's largest bank, SoftBank, fell by 8% yesterday and decreased for the 7th straight day on the delisting of Didi and after the US Federal Trade Commission decided to block the sale of Arm to Nvidia.
Shares of Chinese real estate developer China Evergrande fell about 14% to a May 2010 low amid indications that China Evergrande may officially default. The company is due to pay investors about $10 billion in bonds in January.
The Russian ruble is falling since the US and European allies weigh sanctions targeting major Russian banks and officials if Russia begins the invasion of Ukraine. A video call between US President Joe Biden and Russian President Vladimir Putin over the situation on the border with Ukraine will take place today.
Australia's central bank expectedly kept its key interest rate at a record low of 0.1% and kept its bond-buying program unchanged. The stimulus program is scheduled to be cut in February 2022.
Main market quotes:
- S&P 500 (F) (US500) 4,591.67 +53.24 (+1.17%)
- Dow Jones (US30) 35,227.03 +646.95 (+1.87%)
- DAX (DE40) 15,380.79 +210.81 (+1.39%)
- FTSE 100 (UK100) 7,232.28 +109.96 (+1.54%)
- USD Index 96.28 +0.16 (+0.17%)
Important events for today:
- Australia RBA Interest Rate Decision (m/m) at 05:30 (GMT+2);
- Australia RBA Rate Statement (m/m) at 05:30 (GMT+2);
- German Industrial Production (m/m) at 09:00 (GMT+2);
- Germany ZEW Economic Sentiment (m/m) at 12:00 (GMT+2);
- Eurozone ZEW Economic Sentiment (m/m) at 12:00 (GMT+2);
- Eurozone GDP (q/q) at 12:00 (GMT+2);
- Canada Ivey PMI (m/m) at 17:00 (GMT+2).
USD/CAD Reaches Low Level Zone
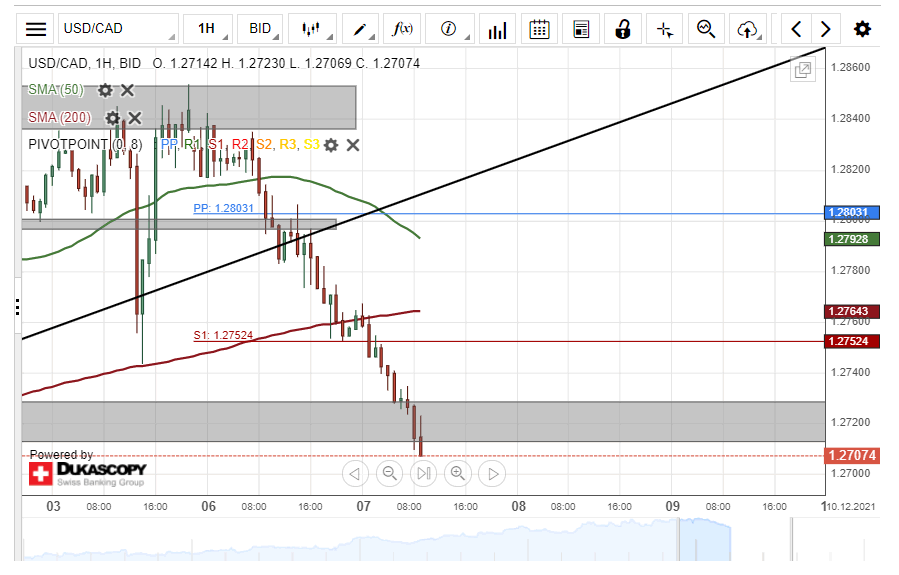
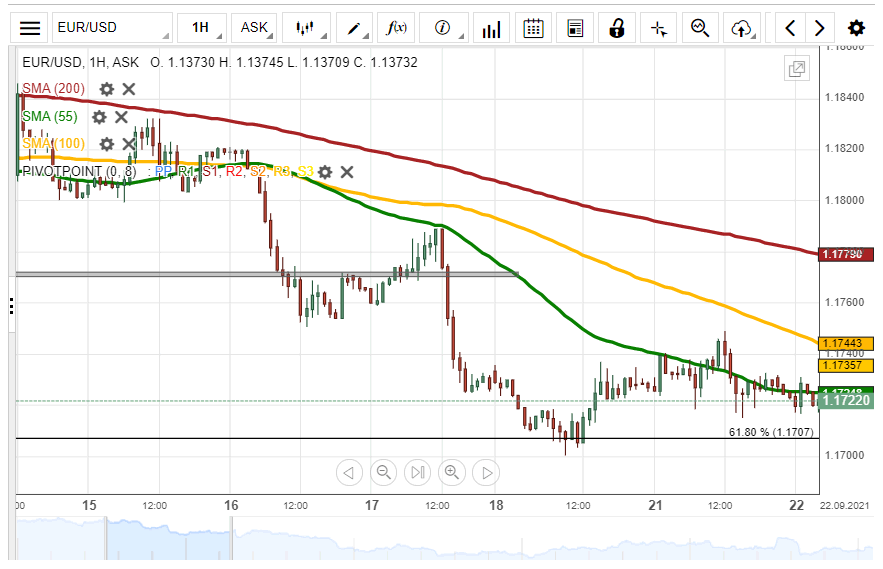
On Tuesday, the USD/CAD currency exchange rate reached the low level zone of the previous week at 1.2713/1.2728. Previously, the rate passed the support of the 200-hour simple moving average and the weekly S1 simple pivot point at 1.2760 and 1.2752.
In the case that the rate passes the support zone, a decline might aim at the support of the weekly S2 simple pivot point at 1.2662. However, take into account that the 1.2700 mark could stop a downwards move.
Meanwhile, a potential recovery of the pair might find resistance in the previously passed weekly S1 simple pivot point at 1.2752 and the 200-hour simple moving average near 1.2764. Above these levels, note the 50-hour simple moving average and the weekly simple pivot point at 1.2800.
GBP/JPY Finds Resistance In SMA
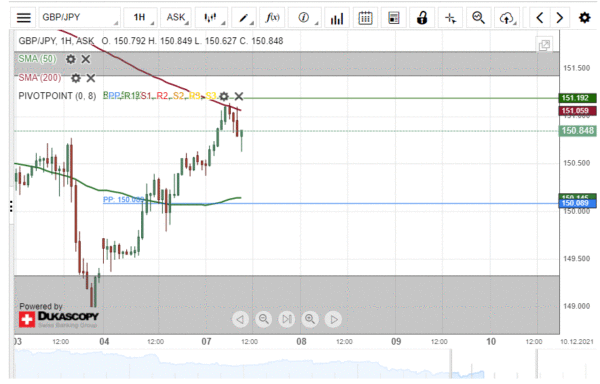
The GBP/JPY currency exchange rate has encountered resistance in the 200-hour simple moving average above the 151.00 mark.
If the 200-hour simple moving average pushes the rate down, the GBP/JPY might decline to the combined support of the 50-hour SMA and the weekly simple pivot point at 150.09. Below the SMA and the pivot point, support is being provided by the July, August, September and October low level zone at 148.46/149.30.
However, a potential move up by the GBP against the JPY, would have to pass the resistance of the 200-hour simple moving average and the weekly R1 simple pivot point at 151.19. Above these technical levels, note the 151.50 mark and the zone of previous week's high levels that surround it.
AUD/USD Reacts To RBA Statement
On December 7, the Reserve Bank of Australia published an official monetary policy statement. In addition, the official cash rate was revealed. The announcement caused a recovery of the Australian Dollar's value. By 09:00 GMT, the rate had already recovered 43 base points or 0.60%.
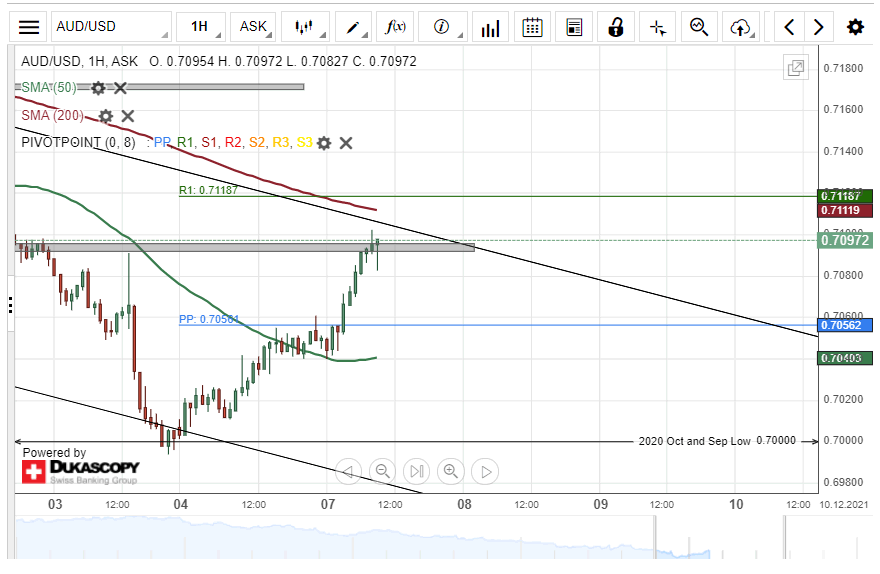
Meanwhile, from a technical analysis perspective, the rate had reached and pierced the resistance zone at 0.7092/0.7096. The pair did not extend its decline, as it found resistance in the 0.7100 level.
A passing of the 0.7100 level's resistance would most likely result in a test of the trend line, which connects the November 2, November 16 and December 1 high levels. In addition, note the 200-hour simple moving average near 0.7110 and the weekly R1 simple pivot point at 0.7119.
However, a decline of the AUD/USD might reach the support of the weekly simple pivot point at 0.7056, the 0.7050 mark and the 50-hour simple moving average near 0.7040. Below these levels, the 0.7000 mark might once again act as support.
EUR/JPY Passes Resistance Zone
On Tuesday morning, the EUR/JPY currency exchange rate broke the resistance of the 128.20/128.30 zone, which had previously kept the rate down on Thursday and Friday. During the day's early European trading hours, the rate had encountered resistance in the weekly R1 simple pivot point at 128.43 and the 128.50 mark. The event was followed by a decline below the 128.20 level.
If the pair continues to decline, it might look first for support in the 128.00 mark. Below the 128.00 level, the weekly simple pivot point and the 50-hour simple moving average could stop a decline at 127.90.
On the other hand, a resumption of the surge of the Euro against the Japanese Yen would need to once again pass the resistance of the 128.20/128.30 zone and the 200-hour simple moving average in the zone. Higher above, the rate would once again encounter resistance in the weekly R1 simple pivot point and 128.50 mark.
Receding Omicron Fears Lift Equities
Fauci comments boost markets
The modest rallies that started yesterday in Asia, continued to gain momentum overnight across Europe and the US, boosted by comments from Dr Anthony Fauci. That let markets get back to their global recovery trade happy place. However, that same sentiment also steepened the US yield curve and turned the focus back to an expectedly hawkish FOMC next week. Travel and leisure rebounded impressively, but the overriding them was one of value outperforming growth, with the Dow Jones having a stellar day versus the Nasdaq.
The S&P 500 rose 1.17% overnight, with the Nasdaq gaining 0.93% and the Dow Jones recording a stellar 1.87% rally. Futures on all three have continued in the same vein in Asia, rising 0.45% today. That has also reversed sentiment in Asia, notably in Japan and Hong Kong, both bastions of fast-money retail traders.
The Nikkei 225 has leapt 2.15% higher, with the Kospi rising 0.55%. In mainland China, markets were also boosted by the RRR cut and easing lending conditions. The Shanghai Composite is flat, but the narrower Shanghai 50 is 0.65% higher, while the CSI 300 has risen by 0.60%. Property sector fears continue to cap gains on the mainland. Hong Kong has rallied strongly, rising 1.85% as investors flocked back into China big-tech listings, which have endured torrid recent sessions.
Singapore has risen by 0.35%, with Kuala Lumpur 0.40% higher and Jakarta climbing by 0.70%. Taipei is unchanged while Manila has edged 0.25% lower with Bangkok jumping 1.05% higher. With the RBA also staying unchanged, Australian markets are also staging a strong recovery led by travel and leisure. The ASX 200 and All Ordinaries have risen by 1.05%.
With a dearth of tier-1 data in Europe today, I expect that sentiment will continue to drive market direction and that should see European stocks enjoy another positive start. As ever, the caveat on the equity rally will be if negative omicron headlines start hitting the news wires.
The Analytical Overview Of The Main Currency Pairs
The EUR/USD currency pair
Technical indicators of the currency pair:
Prev Open: 1.1301
Prev Close: 1.1285
% chg. over the last day: -0.14%
The ECB officials believe that the current monetary policy of the ECB is adequate and the stimulus program is necessary for the current environment. At the same time, inflation expectations in the region show a constant growth trend. The European currency does not have any fundamental factors for strengthening at the moment.
Trading recommendations
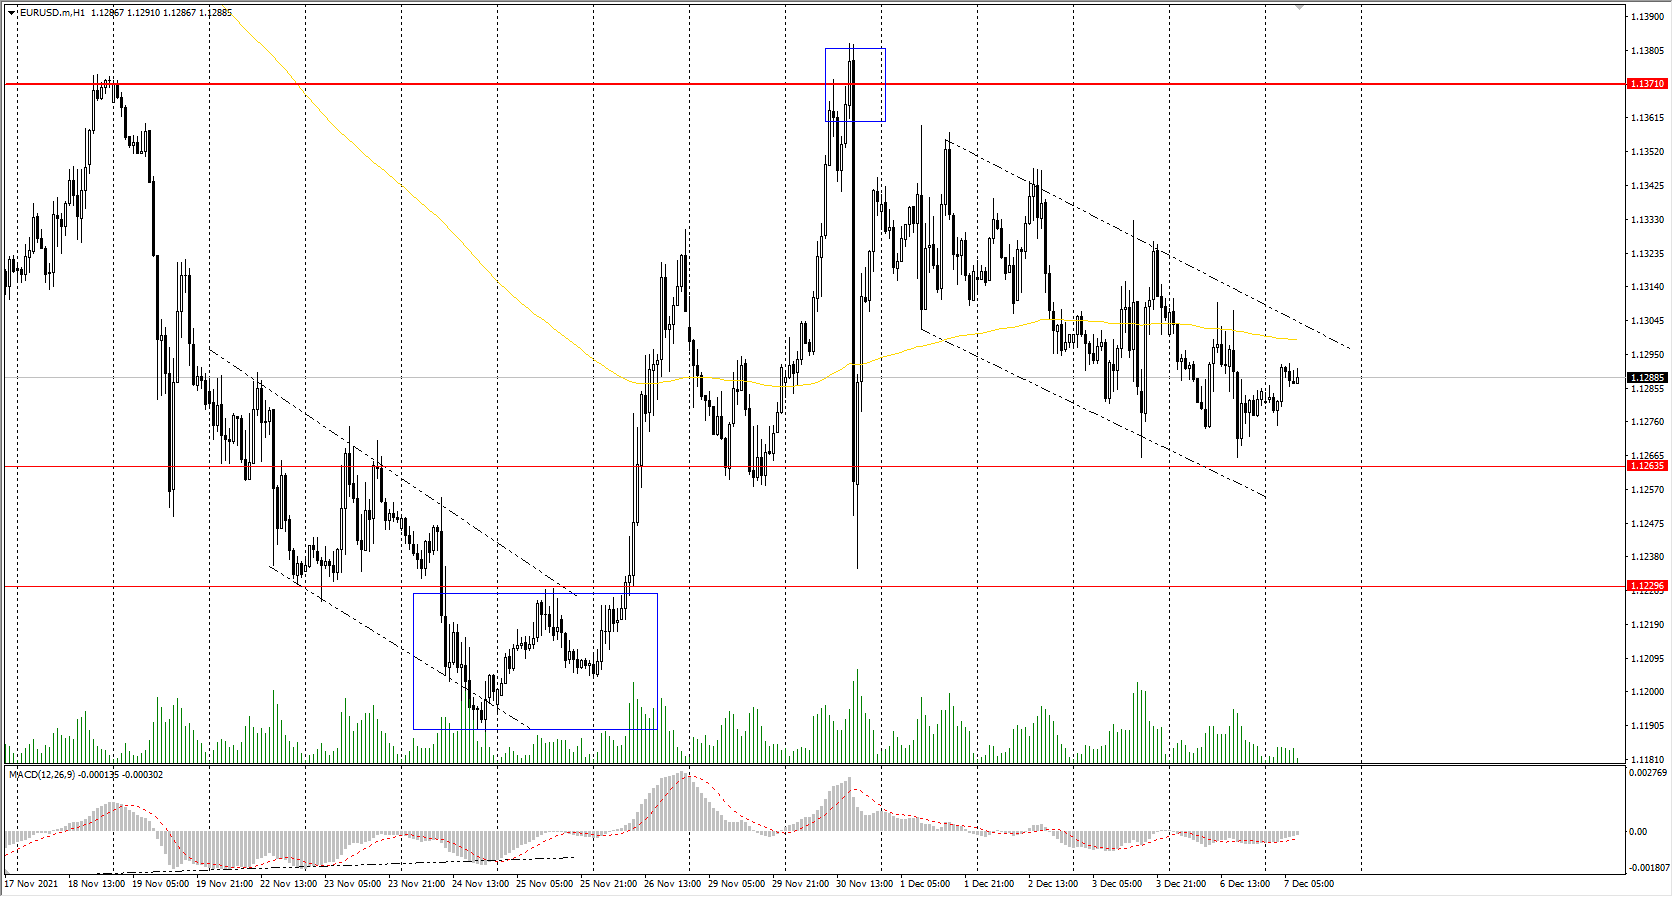
Support levels: 1.1263, 1.1230, 1.1168
Resistance levels: 1.1371, 1.1436, 1.1535, 1.1613, 1.1667, 1.1717
From a technical point of view, the EUR/USD on the hour time frame is still bearish. The price is currently trading in a corridor. The MACD indicator has become inactive. Under such market conditions, traders should consider sell positions from the priority change level of 1.1371. Buy trades should be considered only from the support levels of the higher time frame, given the buyers' initiative, but only with short targets.
Alternative scenario: if the price breaks out through the 1.1371 resistance level and fixes above, the mid-term uptrend will likely resume.
News feed for 2021.12.07:
- German Industrial Production (m/m) at 09:00 (GMT+2);
- Germany ZEW Economic Sentiment (m/m) at 12:00 (GMT+2);
- Eurozone ZEW Economic Sentiment (m/m) at 12:00 (GMT+2);
- Eurozone GDP (q/q) at 12:00 (GMT+2).
The GBP/USD currency pair
Technical indicators of the currency pair:
Prev Open: 1.3212
Prev Close: 1.3262
% chg. over the last day: +0.38%
According to a new forecast from the CBI business group, the UK economic recovery will remain resilient. However, costs and supply shortages are hurting the UK economic growth prospects, and Omicron may add additional risk. The British pound came under pressure last week since the Bank of England may postpone an interest rate hike until 2022.
Trading recommendations
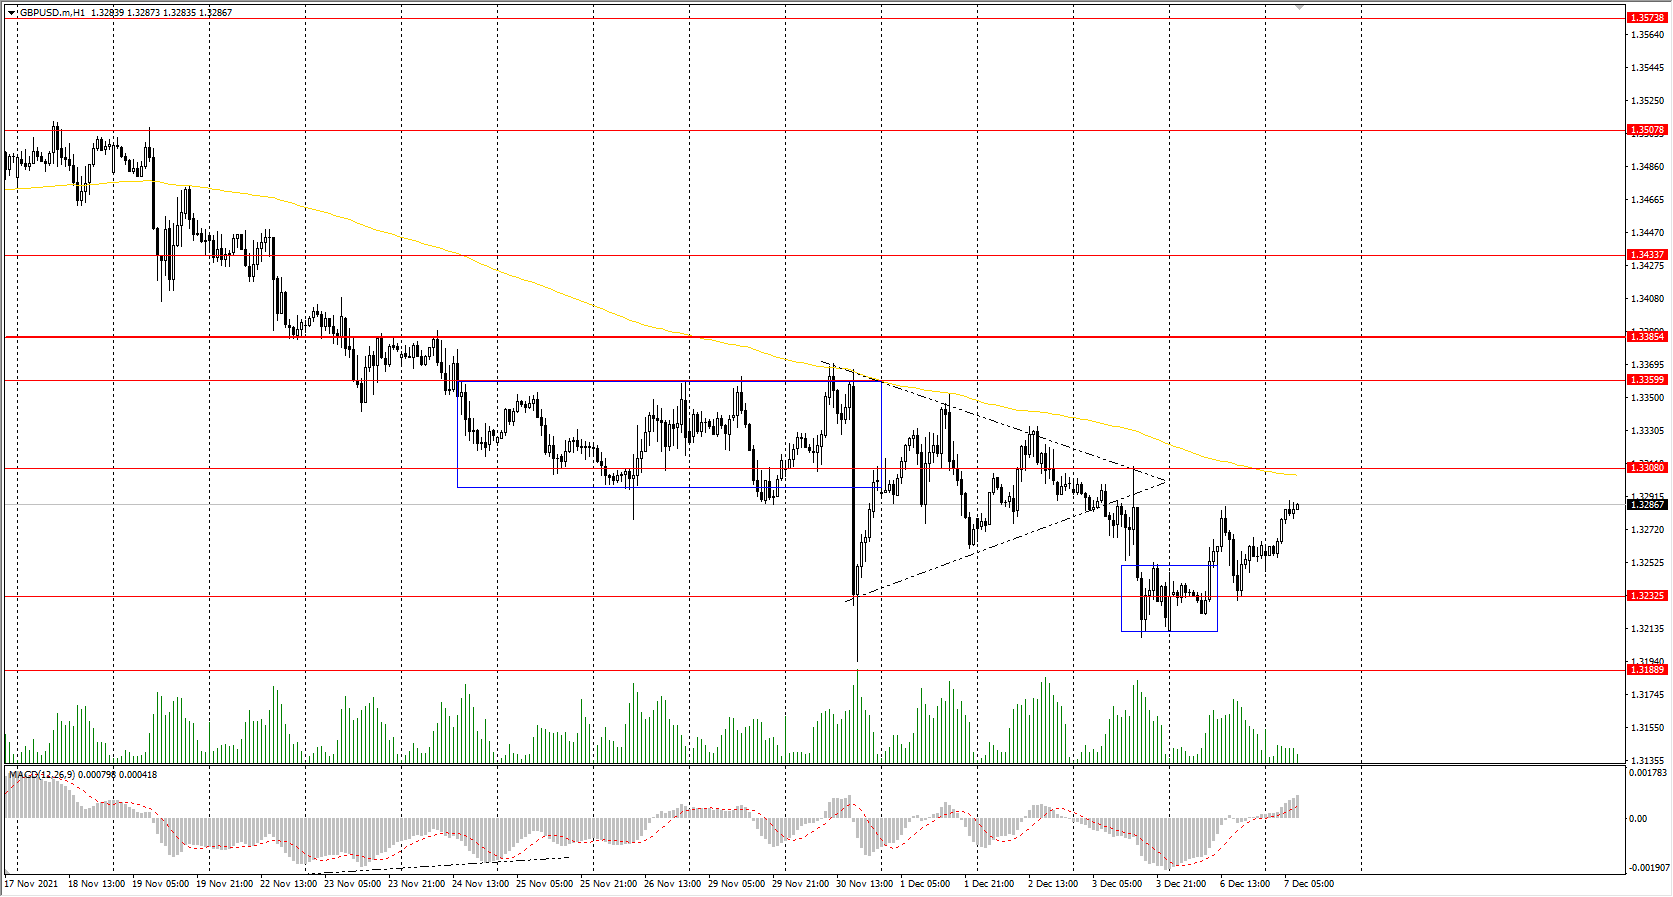
Support levels: 1.3232
Resistance levels: 1.3308, 1.3360, 1.3434, 1.3507, 1.3575, 1.3685, 1.3748
On the hourly time frame, the trend on GBP/USD is bearish. A narrowing of liquidity in the form of a "triangle" pattern was in the direction of sales, but yesterday, the buyers showed initiative. The MACD indicator became positive. Under such market conditions, traders should consider selling positions from the moving average's resistance levels. Buy trades should be considered from the buyers' initiative zone, but only with short targets.
Alternative scenario: if the price breaks out through the 1.3359 resistance level and consolidates above, the bullish scenario will likely resume.
The USD/JPY currency pair
Technical indicators of the currency pair:
Prev Open: 112.83
Prev Close: 113.49
% chg. over the last day: +0.59%
The Japanese yen is declining against the US dollar as the risks associated with the Omicron strain begin to decrease. The monetary policy of Japan's central bank is now aimed at stimulating the economy, while the Fed is already reducing its QE program, so from a fundamental point of view, the USD/JPY quotes are inclined to grow.
Trading recommendations
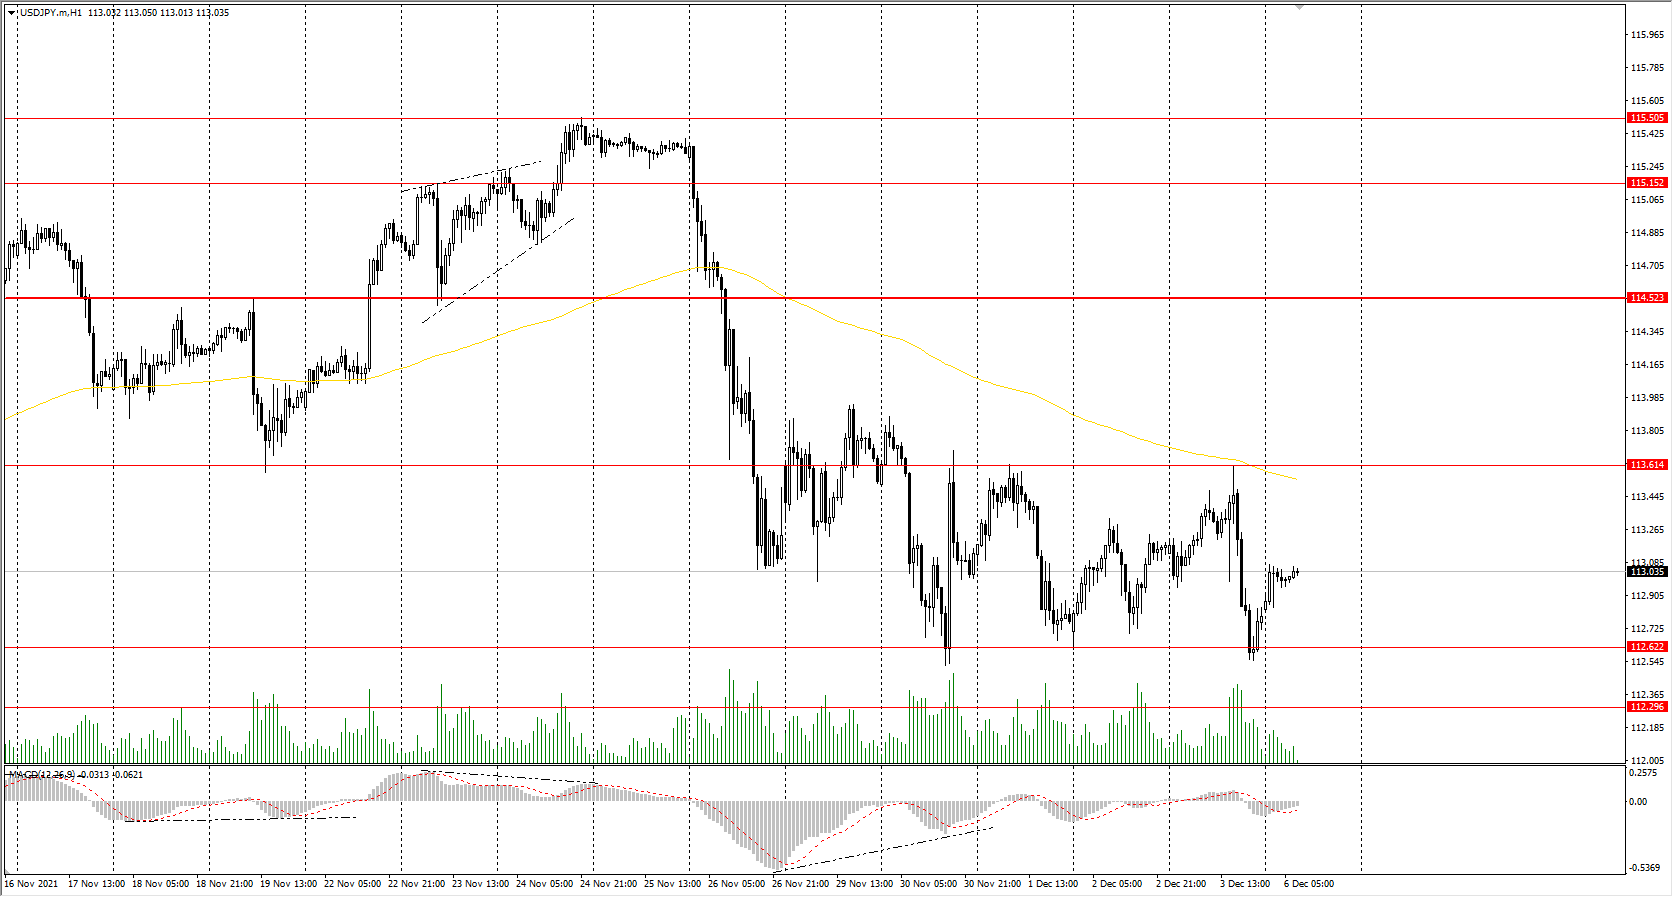
Support levels: 113.61, 112.62, 112.30
Resistance levels: 114.48, 115.15, 115.50
The global trend on the USD/JPY currency pair is bearish. At the moment, the price is trading in the corridor, but the pressure of buyers is increasing. Under such market conditions, it is best for traders to look for sell positions from the resistance levels around the moving average or from the upper border of the corridor, but with additional confirmation. Buy positions should be considered from the lower border of the corridor, but with additional confirmation in the form of a buyers' initiative.
Alternative scenario: if the price rises above 114.17, the uptrend will likely resume.
The USD/CAD currency pair
Technical indicators of the currency pair:
Prev Open: 1.2827
Prev Close: 1.2757
% chg. over the last day: -0.55%
The Canadian dollar is strengthening amid rising oil prices and as the Central Bank of Canada seeks to raise interest rates. A Reuters forecast with 32 strategists shows that the Canadian dollar will strengthen by 2.4% to 1.25 per US dollar in three months. However, traders should keep in mind that the dollar index is also strengthening right now as the QE program is reducing, which may cause the USD/CAD currency pair to take a flat position.
Trading recommendations
Support levels: 1.2726, 1.2646, 1.2598, 1.2571, 1.2483, 1.2416, 1.2388
Resistance levels: 1.2828
From a technical point of view, the USD/CAD currency trend is bullish. The price is trading flat in the corridor with a range of 1.2726-1.2828. The MACD indicator has become negative. Under such market conditions, it is better to look for buy trades from the lower border of the flat corridor. Sell deals should be considered from the resistance levels of the higher time frames, given the seller’s initiative.
Alternative scenario: if the price breaks down through the 1.2687 support level and fixes below, the downtrend will likely resume.

News feed for 2021.12.07:
- Canada Ivey PMI (m/m) at 17:00 (GMT+2).
EURJPY Improves From 9½-Month Low, Negative Risks Remain
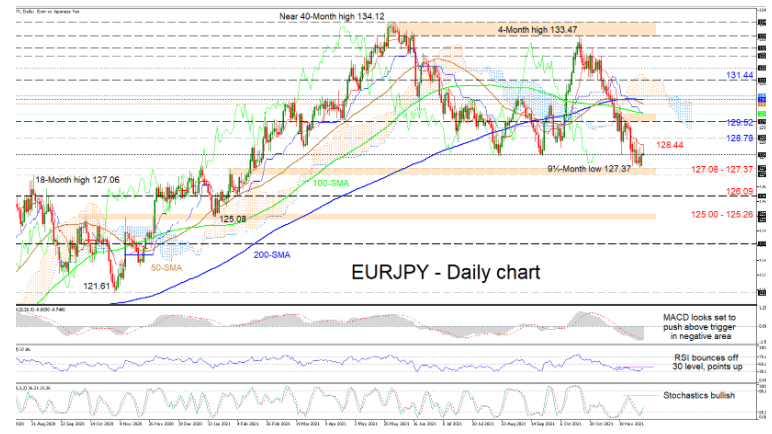
EURJPY is struggling to progress past the falling red Tenkan-sen line at 128.44 after rebounding around the 127.37 level, in the wake of a seven-week decline from the 133.47 peak. The entangled simple moving averages (SMAs) are currently not revealing a reliable trend in the pair.
That said, the Ichimoku lines are indicating that negative forces are taking a breather, while the short-term oscillators are suggesting positive powers are growing. The MACD, far beneath the zero mark, is preparing to overstep its red trigger line. The RSI is improving in bearish territory, while the bullish stochastic oscillator is promoting upside price action.
Trying to extend its recent traction off the 127.37 low, the pair may face initial resistance originating from the red Tenkan-sen line at 128.44 and the nearby high of 128.78. Climbing further, the bulls could meet a resistance zone from the 129.52 high until the 100-day SMA at 129.88. From here, attempts to recoup extra ground may need to conquer the limiting section between the 50-day SMA at 130.33 and the Ichimoku cloud’s band at 130.70. Surpassing the cloud, buyers could then turn their attention towards the 131.44 barrier.
Otherwise, if buying powers subside and the price recedes beneath the 128.00 handle, sellers could encounter preliminary support from the 127.08-127.37 region. Should this barrier fail to dismiss additional descents in the pair, the price may dive for the 126.09 low before sinking towards the 125.00-125.26 support border, which contains the 125.08 trough from January 18.
Summarizing, EURJPY is exhibiting a strong bearish bearing beneath the 129.52 high and a break below the 127.08-127.37 boundary could accelerate negative pressures. That said, for buyers to regain some confidence, they need to pilot the price above the 131.00 region.