Sample Category Title
EURCHF Posts Yet More Lower Lows, Overall Outlook Bearish
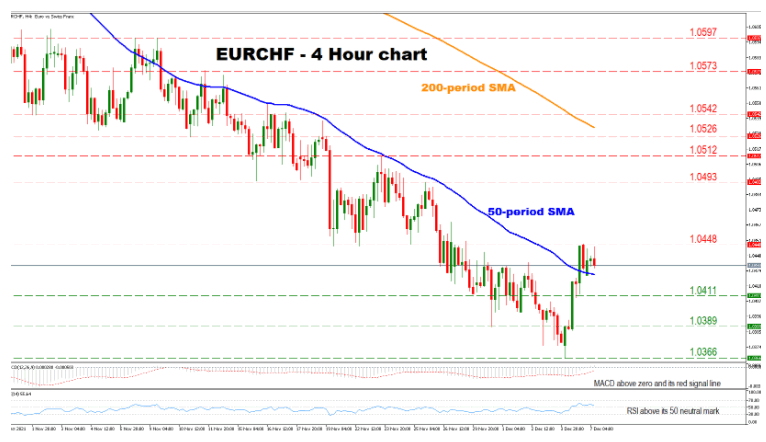
EURCHF is currently trading below its 200-period simple moving average (SMA), which together with the pair's successive lower lows reflect an overall bearish outlook. However, the near-term sentiment appears to be cautiously positive as the price has recently crossed above its 50-period SMA, breaking a series of successive lower highs.
Short-term momentum indicators are supporting a positive bias for the pair as the RSI is found above its 50 neutral mark, while the MACD is located above zero and its red signal line.
Should the price cross below its 50-period SMA currently at 1.0427, selling pressures could intensify opening the door towards the 1.0411 support. A further descending move beyond this point could send the price to test the 1.0389 obstacle before the bears shift their attention towards the 1.0366 barrier.
On the flip side, if the bulls resurface, initial resistance might be found at the 1.0448 level. Surpassing this obstacle could pave the way towards the 1.0493 level. A decisive move above this point could strengthen the pair’s positive momentum, sending the price to test the 1.0512 barrier, before the buyers eye the 1.0526 resistance.
In brief, despite the fact that the immediate-term outlook for the pair appears to be cautiously positive, the overall outlook is bearish. For sentiment to change, buyers would need to break above the 200-period SMA.
USDJPY Moves Sideways After Sharp Decline, Bias Positive
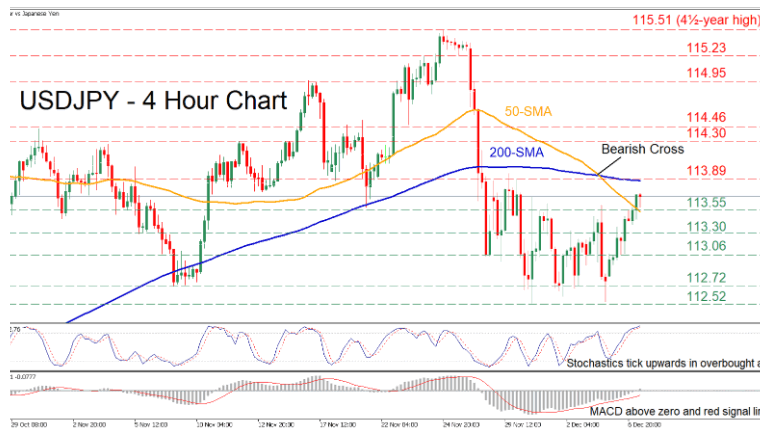
USDJPY experienced a vast sell-off after the price peaked at the 4½-year high of 115.51. Since then, the pair has been moving without a clear direction, but the recent cross above the 50-day simple moving average (SMA) suggests that bullish forces have gained the upper hand.
This near-term positive momentum is also reinforced by the momentum indicators. The MACD is currently found above both zero and its red signal line, while the stochastic oscillator is pointing upwards in the overbought area.
If buying pressure intensifies further, initial resistance might be encountered at the 200-day SMA, currently located at 113.89. Moving past this obstacle, the price may move towards 114.30 or higher to challenge the 114.46 hurdle. If the price continues its ascent, the focus could turn to the 114.95 barrier.
On the flip side, should the positive bias fade and the price reverses downwards, the 113.55 level that overlaps with the 50-day SMA could act as the initial support barricade. If violated, that could send the price to test the 113.30 level. Failing to halt there, the market might tackle the 113.06 obstacle.
Overall, the pair has been holding a neutral tone in recent sessions. A clear break above the 200-day SMA could ignite further bullish actions and alter the short-term picture to positive, whereas a dip below 112.52 would signal the resumption of the recent dive.
Receding Concerns
Equity markets jump as Omicron jitters ease
Another day, another directional move by markets on whatever the latest omicron headline is. Following on from yesterday’s indicative news from South Africa that the new Covid-19 variant could be milder than previous versions symptom-wise, much the same message was reinforced by the US’ Dr Anthony Fauci overnight.
That was all markets needed to hear really and equity markets in Europe and the US followed Asia’s lead and piled back in. Unsurprisingly, travel and leisure led the way while technology only rose modestly. When looked at in totality, markets appear to be moving rapidly back into pricing up the Fed taper trade. Value (old boring companies) outperformed growth (exciting technology companies), which makes sense as the US yield curve also steepened once again overnight. The theory being that technology and their ilk, with sky-high valuations, are more sensitive to upward moves in interest rates.
The US dollar and oil also rallied overnight with markets getting back to business as usual. And today in Asia, the region is breathing a sigh of relief with equities performing well across the region. While I hope that we have seen “peak omicron,” if that proves not to be the case, I dread to think about the reversal of direction we will see. As I have previously stated, the winner in December will be volatility and not directional plays. We remain one negative omicron headline away from more of the former, and less of the latter.
That doesn’t mean there is nothing else going on, and a dousing of the omicron fires has allowed other themes to come back into focus. Next week’s FOMC policy meeting will be a critical juncture and the receding omicron threat (allegedly), should allow the FOMC to announce a faster taper and possibly earlier rate hikes. If US CPI prints at 7.0% on Friday, that should be a done deal.
But next week is a veritable all-you-can-eat buffet of central bank decisions. Hungary, Chile, Indonesia, Switzerland, Norway, the European Chief Government Debt Monetiser Bank (ECB), Mexico, Russia and perhaps the most exciting, Turkey. That isn’t an exhaustive list, and the PBOC announces its LPR’s the week after. After yesterday’s RRR cut was announced, the odds are rising of a cut in the 1-year LPR at least. Today, we have Australia, tomorrow India, Canada, Brazil and Poland.
We already know what the ECB, Japan and Australia will do, but the picture is murkier in the Latam, Eastern Europe space where we are likely to see a tightening bias continue. India may hint at a hike in 2022 in a change of direction as stagflationary forces increase. We can safely assume that all of Asia except Singapore and South Korea will be on hold through 2022. Turkey will be the outlier, where a collapsing currency and surging inflation could drive another Erdogan-omics rate cut. The tightening of US monetary policy has not been fully priced or appreciated by markets, and further divergence in that respect from Turkey will continue to make short lira the easiest trade on the planet. I am just pondering where on my 2022 calendar to pencil in USD/TRY at 20.0000.
The situation in China’s property developer sector remains fluid, with Evergrande and Kaisa both looking to restructure their entire debt holdings, including offshore obligations. But highly-leveraged firms within the sector remain in deeply distressed territory with more obligations on offshore debts due this week. The first seeds of a solution appear to be occurring though, led by the RRR cut and debt restructuring hopes. I emphasise hopes as a positive outcome is far from certain. This story still has a lot more to run and any short-term rallies in the mostly Hong Kong-listed sector should be approached with extreme caution.
The Reserve Bank of Australia left policy rates unchanged today as expected. They did leave a glimmer of wiggle room in the accompanying statement to act sooner on rates if required. We can expect similar get-out-of-jail clauses from a few central banks next week, most likely the ECB. The Australian dollar has rallied modestly, but both it and its kiwi cousin remain at the mercy of nervous global risk sentiment, omicron, FOMC, or otherwise.
USD Remains Stable Amidst Low Volatility
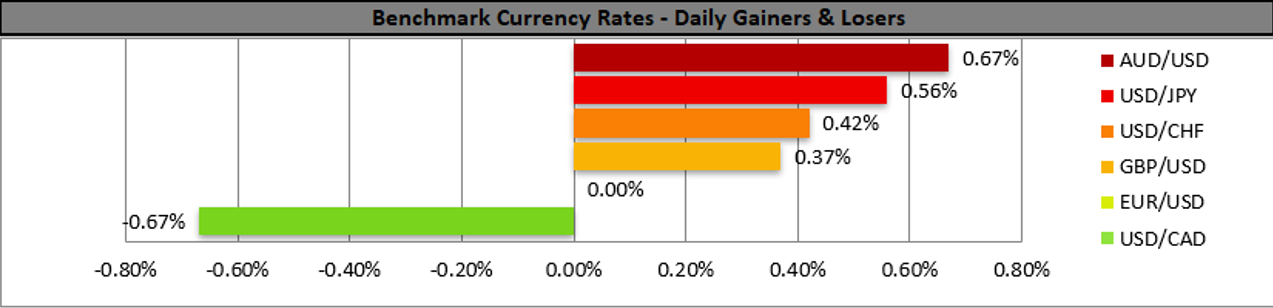
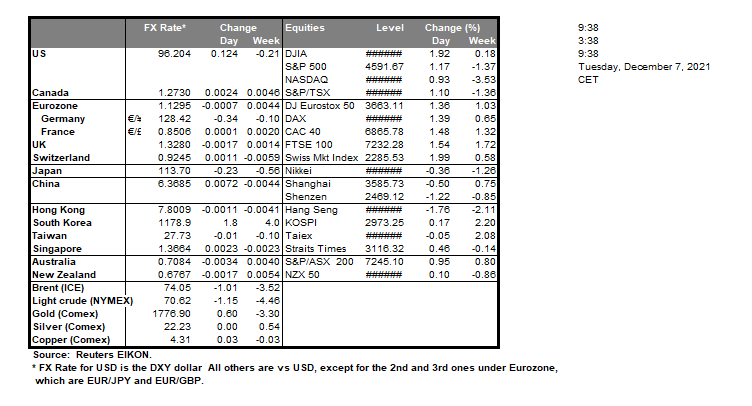
USD remained rather stable against a number of its counterparts yesterday amidst low volatility, broadly in the FX market. There may be some attention for the release of the US international trade balance, yet overall, we expect fundamentals to take the lead regarding the direction of the USD as there are only a few high impact financial releases from the US today. On the other hand, safe haven currencies such as the JPY seem to be under pressure given the positive market sentiment. EUR traders may be keeping an eye out for today’s financial data and beyond Eurozone’s revised GDP rates for Q3, we also tend to note the release of Germany’s forward looking ZEW indicators for December which are expected to drop implying a more pessimistic outlook for the German economy as well as deteriorating conditions. On the monetary front for EUR traders we note the scheduled speech of ECB Vice President De Guindos speaks. US stockmarkets on the other hand seemed to gain as hopes surfaced in the markets that the Omicron variant of the pandemic has mild symptoms allowing for a more risk on attitude to be adopted, yet uncertainty is still present.
EUR/USD continued its bearish movement just below the 1.1300 (R1) resistance line. We tend to maintain our bearish outlook for the pair as long as it remains below the downward trendline incepted since the 30th of November. On the other hand the reading of the RSI indicator below our 4-hour chart is at near the reading of 50 which could imply that the bears could be having second thoughts. Should the selling interest be maintained, we may see the pair taking aim of the 1.1225 (S1) support line. Should the pair find extensive buying orders along its path we may see it breaking the prementioned downward trendline the 1.1300 (R1) resistance line and take aim of the 1.1370 (R1) resistance level.
Oil rises as Omicron worries tend to ease
Oil prices seemed to gain some ground yesterday and during today’s Asian session as market worries for the Omicron variant of the pandemic tended to ease thus allowing for hopes for the demand side of the commodity to rise. Also on the demand side the fact that China’s oil imports rebounded from Octobers’ lows tended to provide also boost to the notion of the recovery of oil demand in the global market. On the supply side the US-Iran negotiations which could ultimately allow for Iran to mass export oil once again are to have hit an impasse and traders seem to view the supply side as still tight as Iran may be delayed to enter the global oil markets. Also Saudi Arabia is reported to have increased its prices over the weekend in another sign of confidence for the demand side for the commodity, while today Oil traders are to keep a close eye over the release of the weekly US API crude oil inventories figure.
WTI prices rose yesterday breaking clearly the 67.35 (S1) resistance line, now turned to support and continued higher to test the 70.00 (R1) resistance level. We tend to maintain a bullish outlook for the commodity’s prices given also that the RSI indicator below the 4-hour chart has an upward slope and has also surpassed the reading of 50 implying that the bulls have the advantage. Should the bulls actually take charge of the pair’s direction we may see it breaking the 70.00 (R1) resistance line and aim for the 73.45 (R2) resistance level. Should the bears take over we may see the commodity’s price reverse direction and take aim for the 67.35 (S1) support line.
Today’s events and expectations
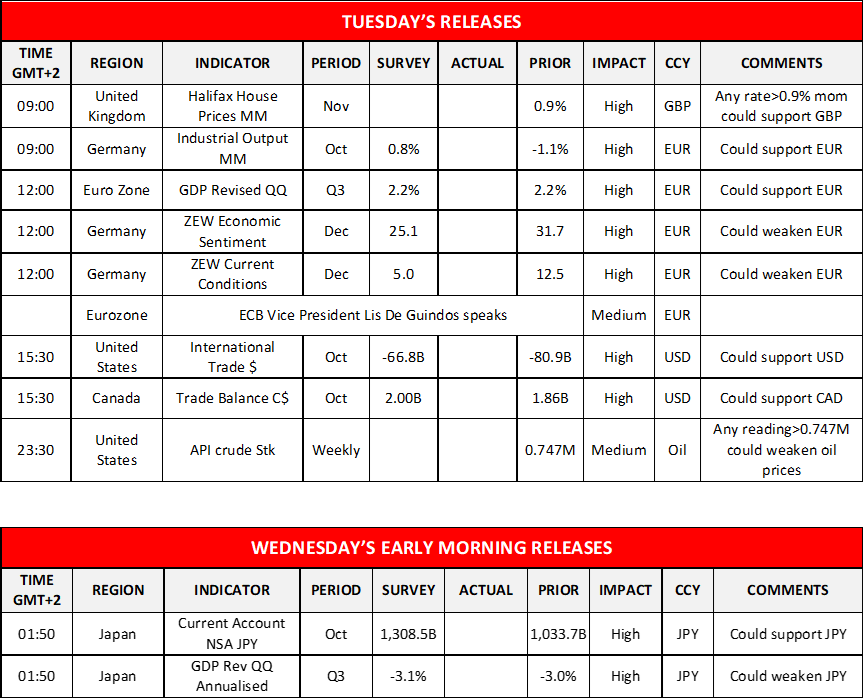
Today we note the release of UK’s Halifax House prices for November, Germany’s industrial orders for October, Eurozone’s revised GDP Rate for Q3, Germany’s ZEW indicators for December in the European session. In the American session we get the release of the trade balance figures for the US and Canada, both for October, while during tomorrow’s Asian session we get Japan’s current account balance for October and the Revised GDP Rate for Q3.
EUR/USD H4 Chart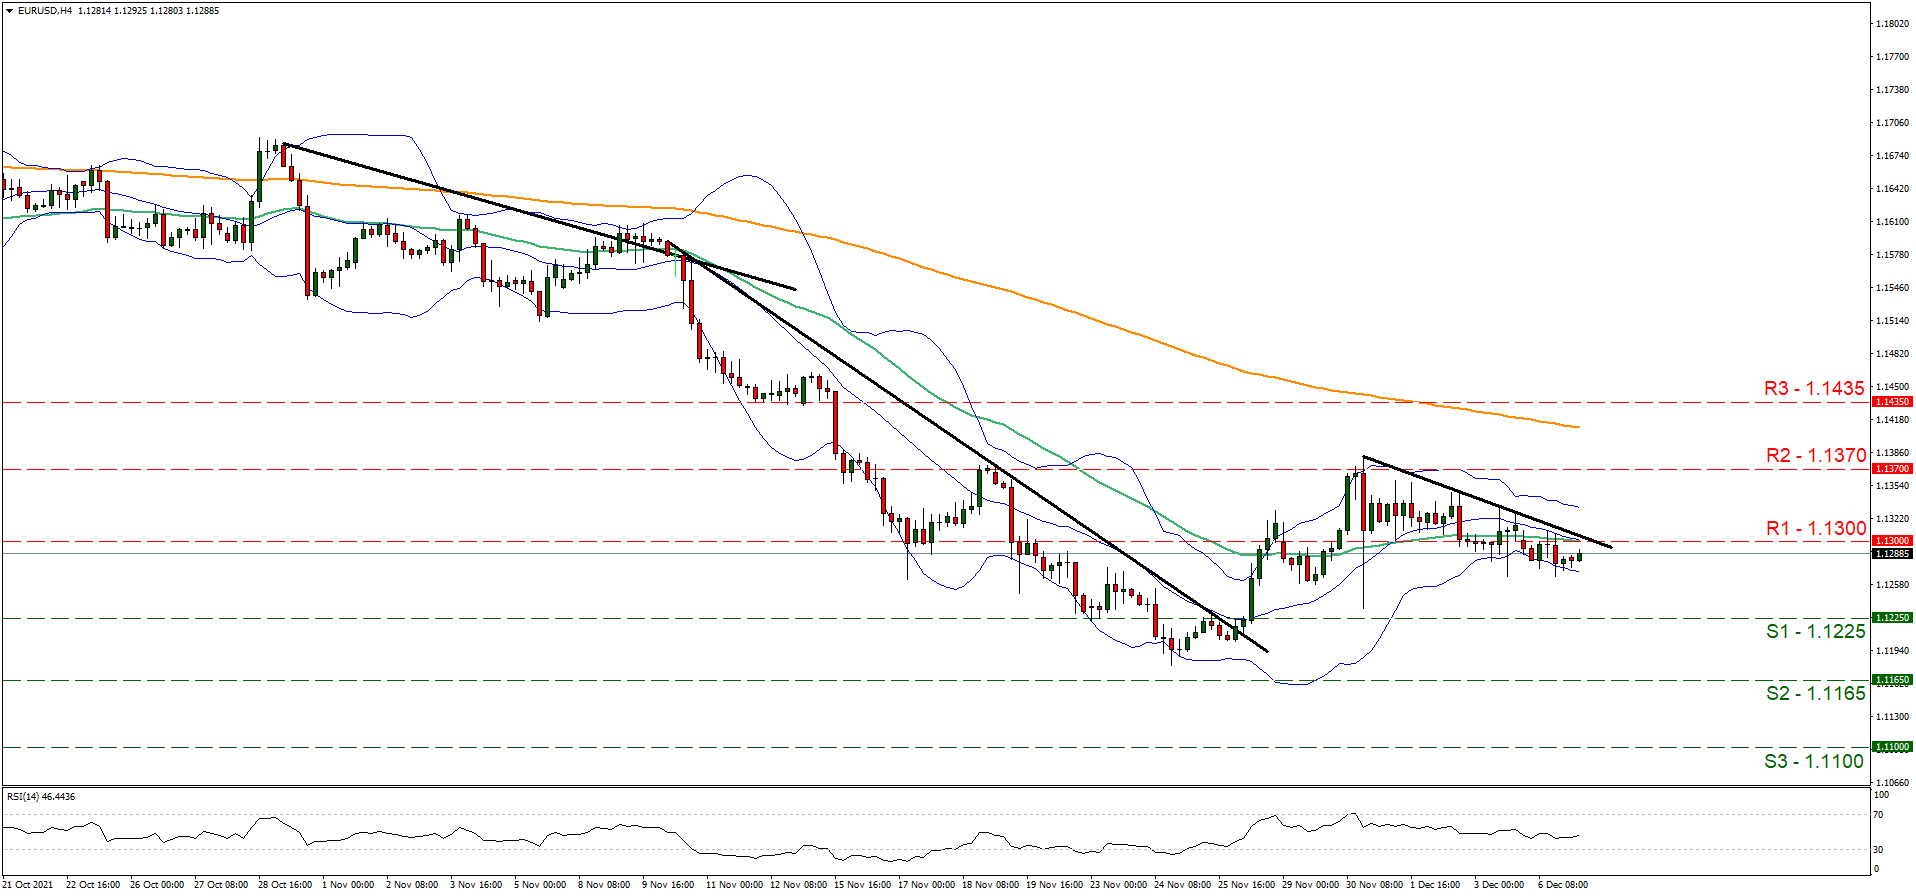
Support: 1.1225 (S1), 1.1165 (S2), 1.1100 (S3)
Resistance: 1.1300 (R1), 1.1370 (R2), 1.1435 (R3)
WTI H4 Chart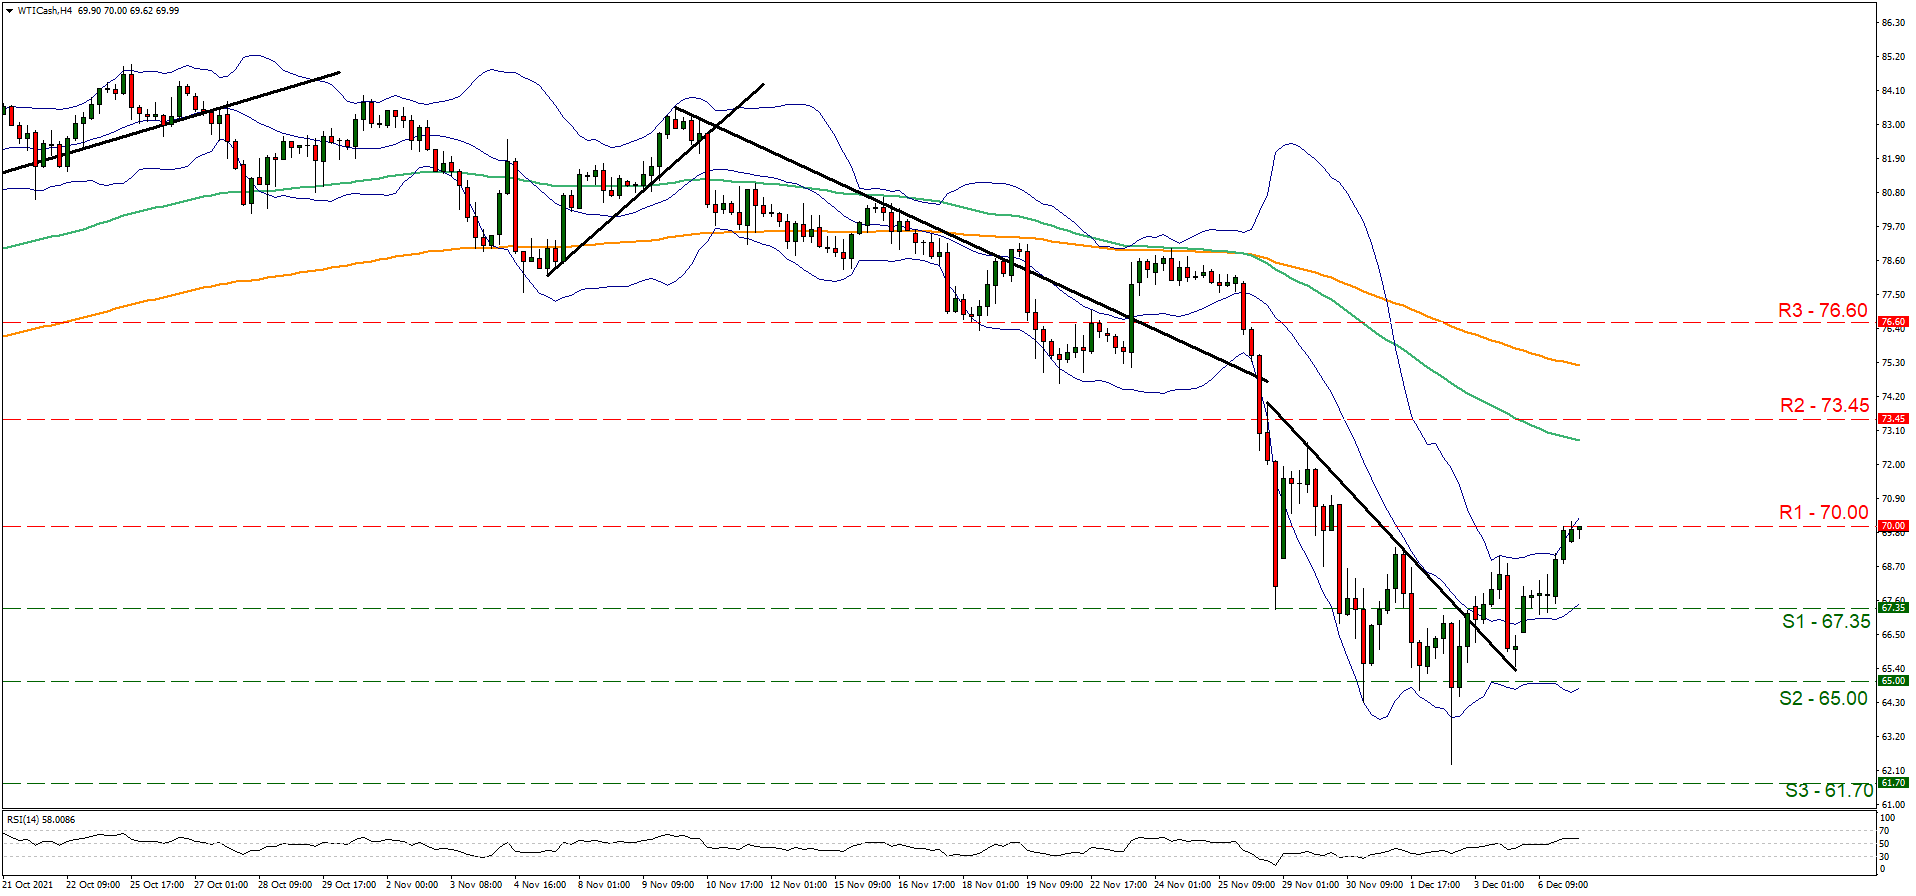
Support: 67.35 (S1), 65.00 (S2), 61.70 (S3)
Resistance: 70.00 (R1), 73.45 (R2), 76.60 (R3)
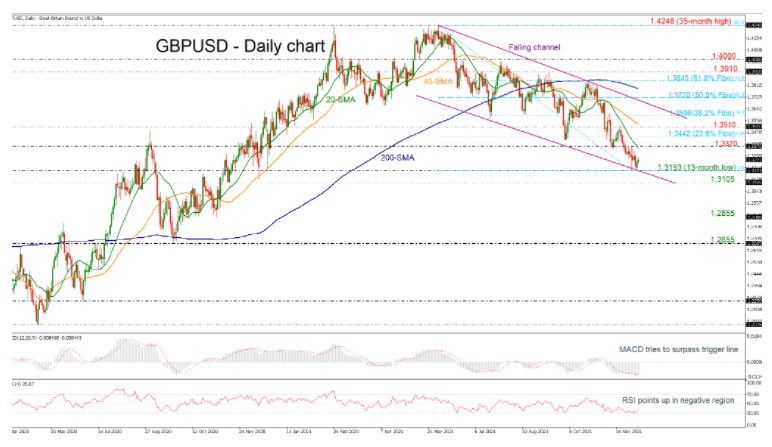
GBPUSD Turns Up From 13-Month Trough, Remains In Descending Channel
GBPUSD has been trading within a downward sloping channel since June 1, while more recently, it hit a fresh 13-month low of 1.3193 before turning higher. Also, the price resumed its downward move after it found strong resistance around the 200-day simple moving average (SMA) and the 61.8% Fibonacci retracement level of the down leg from 1.4248 to 1.3193 at 1.3845.
Technically, the bias is looking bearish as the MACD oscillator is edging sideways in the negative territory, while the RSI is heading north after touching its 30 oversold level. In trend indicators, the short-term SMAs are still following the declining price action.
If sellers sink below the 13-month low of 1.3193, they could meet the return line of the descending pattern around the 1.3105 support. Steeper declines under the line would need to tackle a more durable support section from 1.2855 to the 1.2655 low to persist.
If buying interest picks up, early resistance could occur at the 1.3370 tough barrier, which overlaps with the 20-day SMA. A violation of this level may boost the pair towards the 23.6% Fibonacci of 1.3442 and the 1.3510 barrier. If advances endure past these obstacles, buyers could then target the 38.2% Fibonacci of 1.3595, before considering the break above the channel for more bullish moves.
Overall, the very short-term picture remains bearish below the descending line. A break below 1.3193 would further worsen the outlook.
Daily Technical Analysis
EUR/USD
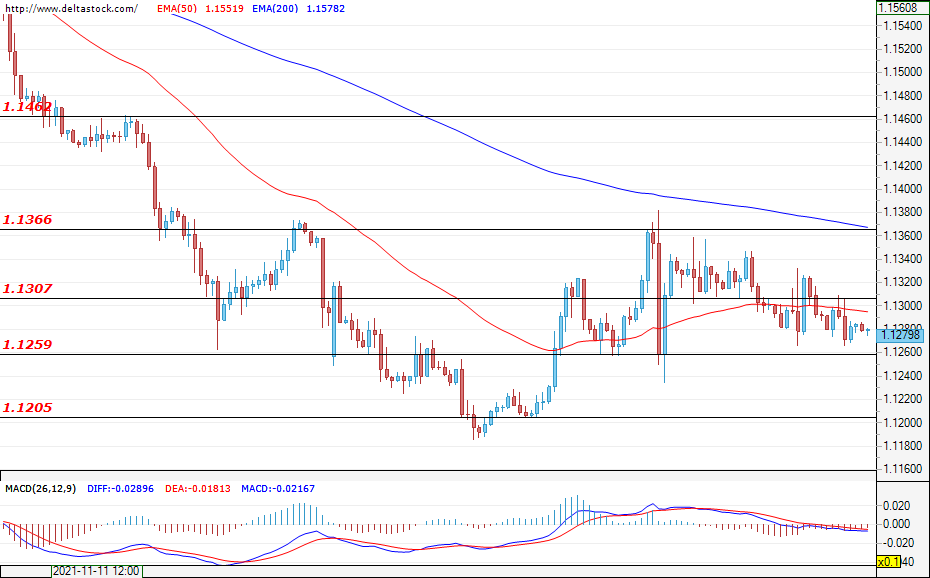
Current level - 1.1279
Neither the bears nor the bulls managed to gain enough momentum yesterday and lead the pair out of the range between 1.1259 and 1.1307. Only a successful violation of one of the borders could give a clear direction for the future path of the currency pair. A new successful attack on the mentioned level at 1.1307, followed by a breach of the important resistance at 1.1366, could lead to future gains for the common European currency against the dollar and would help in stirring up a rally towards the level at 1.1462. If the bears prevail and violate the first support at 1.1259, the pair would most likely test the zone at 1.1205, thus strengthening the negative expectations of the market participants.
| Resistance | Support | ||
| intraday | intraweek | intraday | intraweek |
| 1.1307 | 1.1460 | 1.1259 | 1.1205 |
| 1.1366 | 1.1500 | 1.1259 | 1.1180 |
USD/JPY
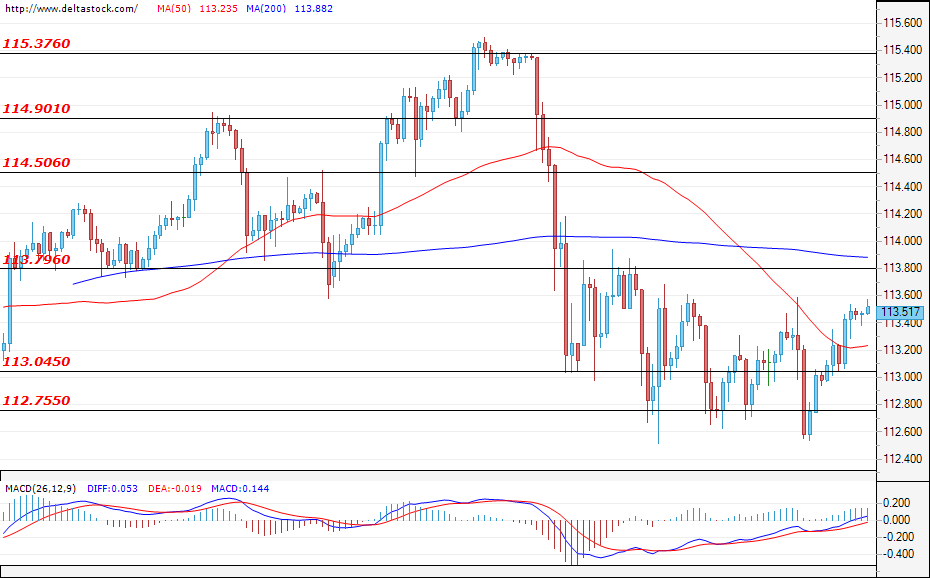
Current level - 113.51
The breach of the zone at 113.04 was confirmed and the dollar regained some of its recent losses against the yen. If the bullish prevalence continues, a test of the resistance at 113.79 would be the most probable scenario. A successful violation would strengthen the positive expectations and could easily head the USD/JPY towards the zone at 114.50. In the downward direction, the first target for the bears is the level at 113.04, but only a breach towards the lower support at 112.75 could deepen a sell-off towards the local lows at around 112.00.
| Resistance | Support | ||
| intraday | intraweek | intraday | intraweek |
| 113.80 | 114.50 | 113.04 | 112.75 |
| 114.50 | 114.90 | 112.75 | 110.80 |
GBP/USD
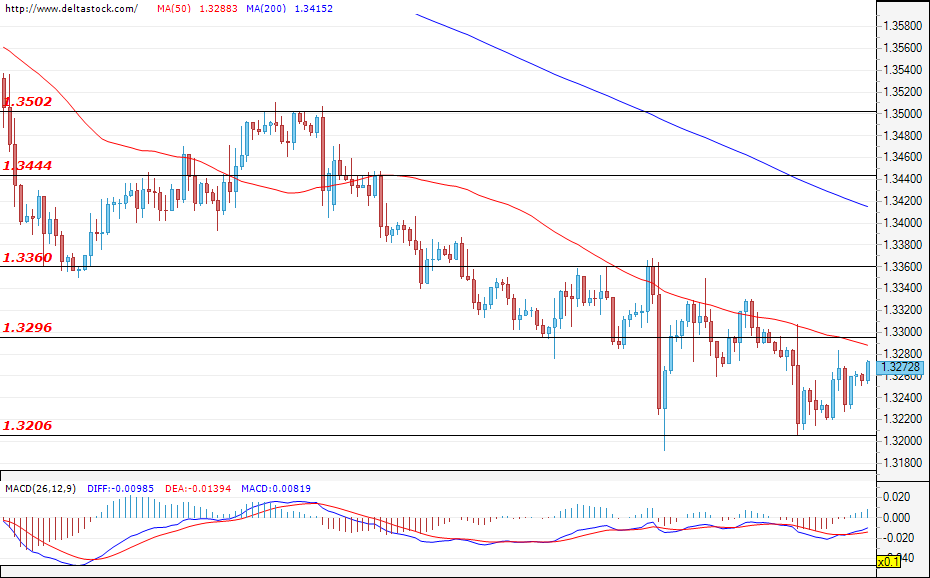
Current level - 1.3272
Yesterday, the decline was limited down to the support zone at 1.3206 and the pound gained some value against the dollar. At the time of writing, the pair is heading for a test of the close resistance at 1.3296 and, if it is successful, the recovery of the Cable should continue towards the next target at 1.3360. On the other hand, a new successful attack on the mentioned zone at 1.3206 could further deepen the decline towards 1.3150.
| Resistance | Support | ||
| intraday | intraweek | intraday | intraweek |
| 1.3296 | 1.3440 | 1.3206 | 1.3150 |
| 1.3360 | 1.3500 | 1.3206 | 1.3060 |
US 30 Breaks Higher
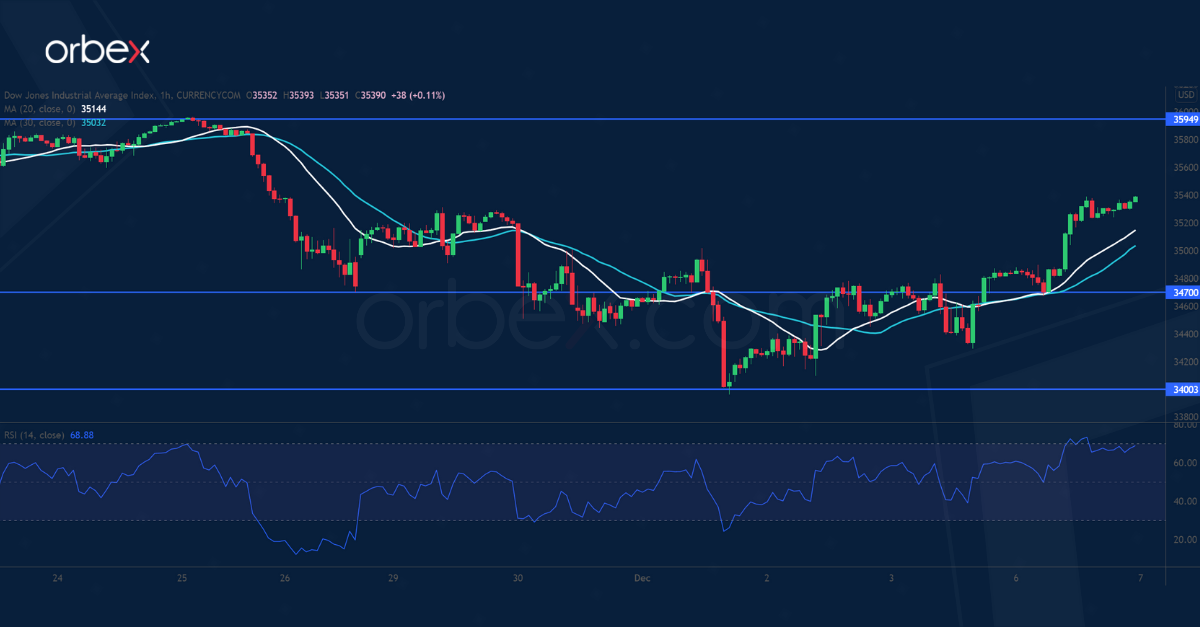
The Dow Jones recoups losses as the omicron variant may have less impact than feared. The index bounced off last October’s lows around 34000.
An oversold RSI in this demand zone has attracted a crowd to buy the dips. A break above 34950 and then 35300 would prompt short-term sellers to cover, paving the way for a sustainable rally.
35950 would be a key hurdle and its breach may turn the cautious mood around and resume the bullish trend. 34700 is the first support when the bulls try to catch their breath.
NZD/USD Sticks To Downtrend
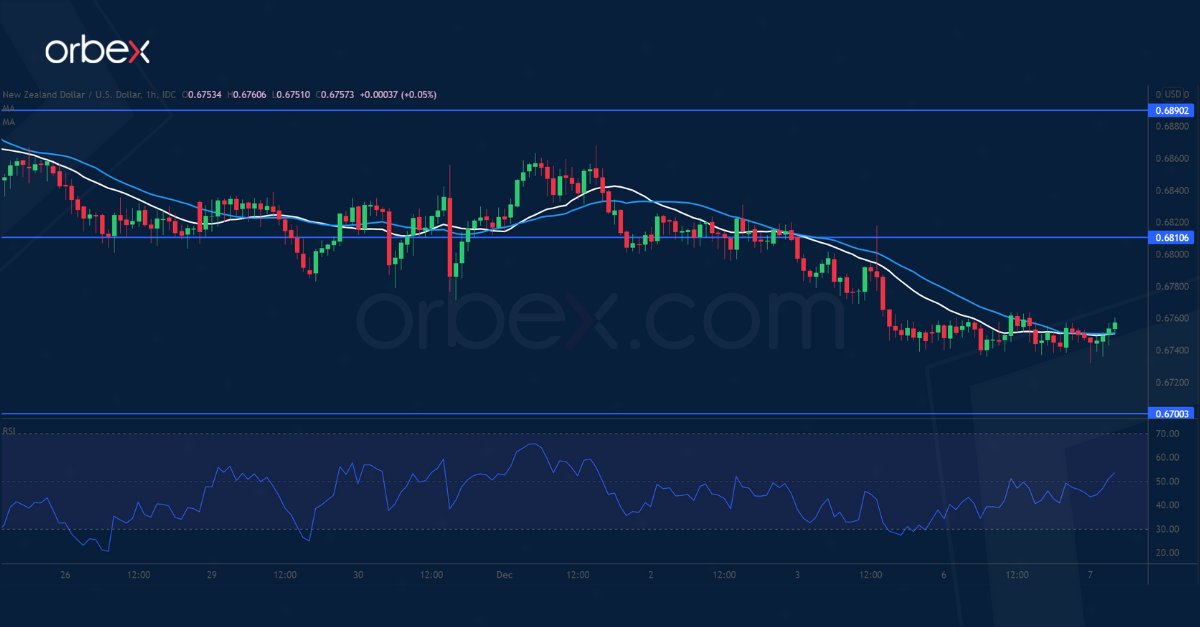
The US dollar edged higher thanks to a rally in Treasury yields. Increasing divergence between the 20 and 30-day moving averages suggests a deterioration in market sentiment.
On the hourly chart, a short-lived rebound has struggled to stay above 0.6780. And that is a sign that the bears are still in control of the direction.
0.6700 is the next support. Its breach would extend the sell-off to November 2020’s lows near 0.6600. The RSI’s oversold situation may cause a limited rebound with 0.6810 as the closest resistance.
GBP/USD Attempts To Rebound
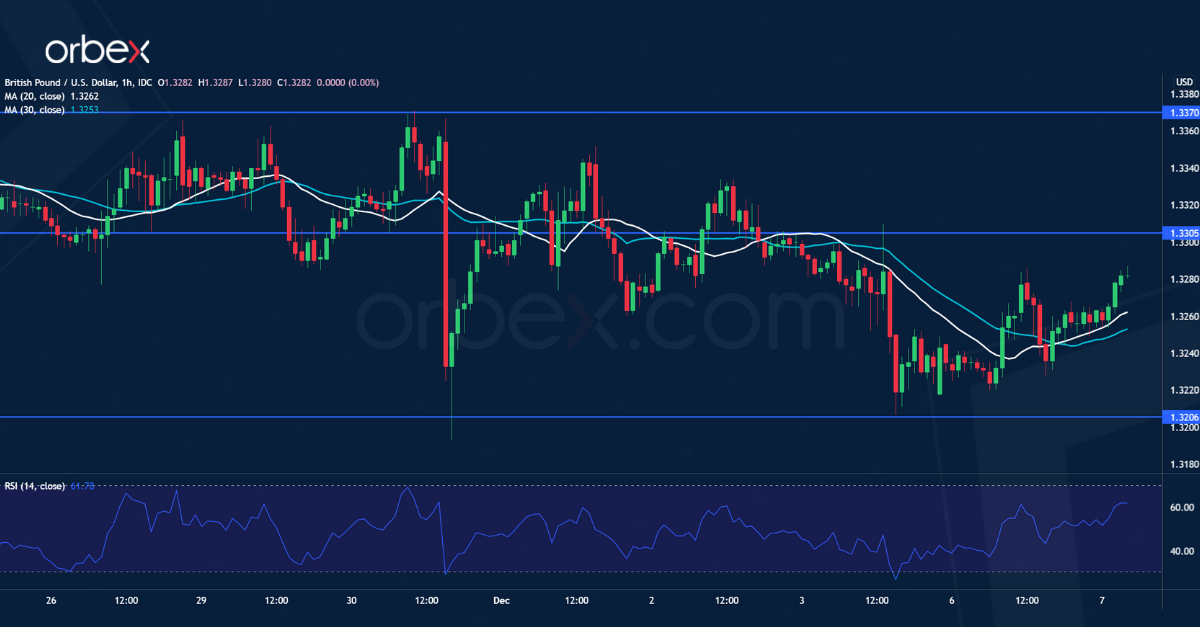
The sterling consolidates as BOE officials stress due to inflationary pressure from a tight labor market. So far, rebounds have been an opportunity for trend followers to sell into strength.
The pound is testing last December’s demand zone around 1.3200. An oversold RSI may help lift bids momentarily as sellers take profit.
1.3300 is the immediate resistance. Then the bulls will need to clear the origin of the latest sell-off at 1.3370 to attract more buying interest. On the downside, a breakout would send the price to 1.3100.
Dow Jones And Crude Oil Rebound As Investors Buy The Dip
US stocks started the week well as investors remained optimistic about the Omicron variant. The blue-chip Dow Jones index rose by more than 600 points while the tech-heavy Nasdaq 100 rose by about 80 points. This rally is because investors are optimistic that the Omicron variant will not lead to substantial interruptions to the global economy. Early data about the variant shows that its symptoms are relatively mild. This sentiment was confirmed by Anthony Fauci, the chief medical advisor. Stocks also rose as the market reflected on the relatively hawkish statement by the Fed Chair.
The price of crude oil also rose as optimism over the variant rose. Brent, the global benchmark, rose to $72 while West Texas Intermediate (WTI) rose to $68. These prices are still significantly lower than the year-to-date high. The recent decline happened after the US and several other countries announced that they will boost supplies in the market by releasing some of their strategic petroleum reserves (SPR). Later today, the price will react to the latest short-term energy outlook by the Energy Information Administration (EIA). The report will show the state of demand and supply dynamics.
There will be several key events in the economic and earnings calendar today. Earlier on, the Reserve Bank of Australia (RBA) delivered a relatively dovish interest rate decision while Japan published the latest household spending data. The next key events to watch will be the latest UK home prices data from Halifax. These numbers will come a few days after a report by Nationwide showed that home prices held steady in November. In Europe, Eurostat will release the third estimate of EU GDP numbers. Later, the US, Canada, and China will release November’s trade numbers.
EURUSD
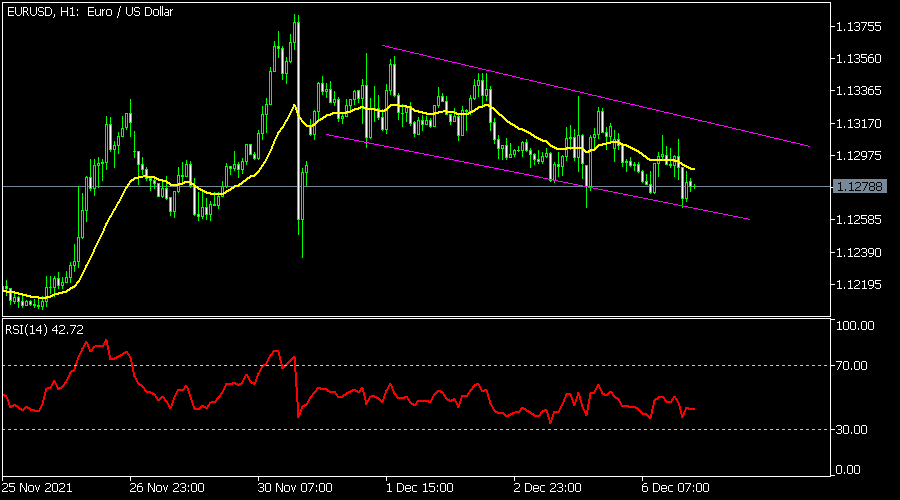
The EURUSD was little changed in the overnight session. It is trading at 1.1278, which is slightly above the lower side of the purple channel. The price is also slightly below the 25-day moving average while the Relative Strength Index (RSI) is at a neutral level of 50. The pair has also formed an inverted head and shoulders pattern. Therefore, there is a likelihood that the pair will bounce back in the near term.
USDCHF
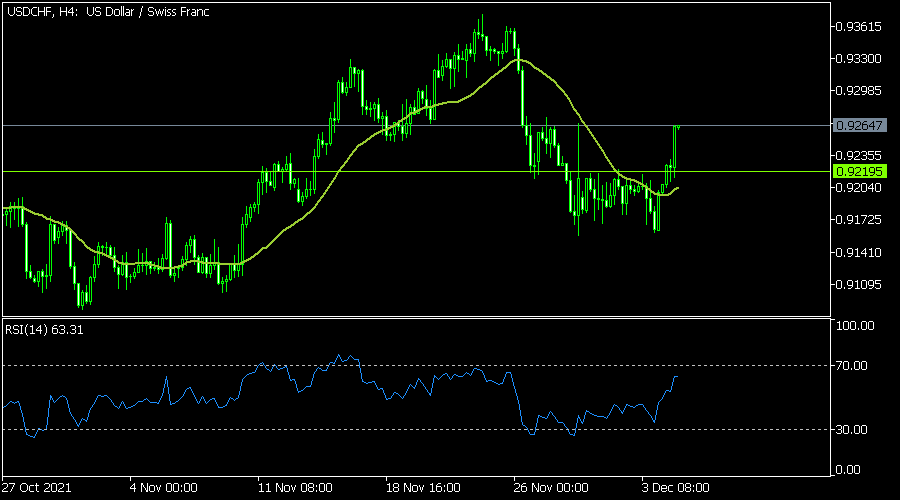
The USDCHF pair rose to the highest level since November 26 as the US dollar rebounded ahead of Swiss unemployment data. The pair is trading at 0.9263, which is above this week’s low of 0.9162. On the four-hour chart, it has moved above the important resistance level at 0.9120. It has also moved above the 25-day and 50-day moving averages. Therefore, the pair will likely keep rising in the near term.
EURGBP
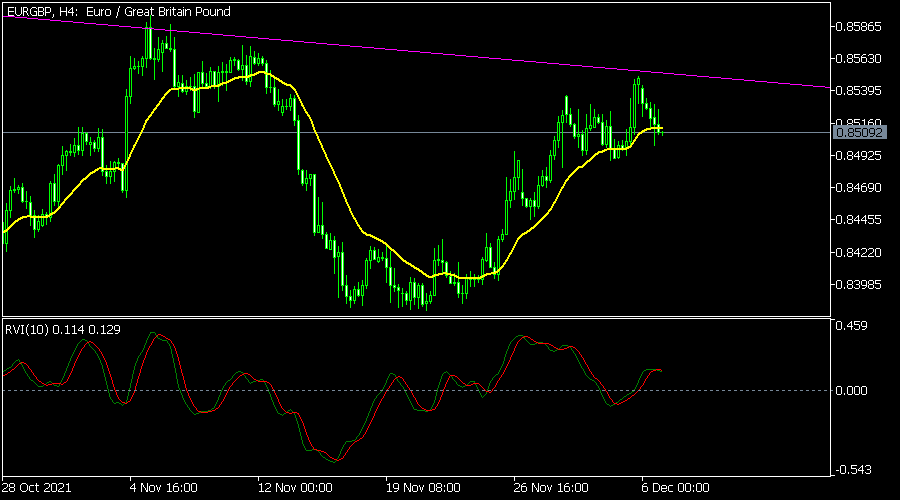
The EURGBP pair retreated slightly ahead of the latest EU GDP data. The pair is trading at 0.8500, which was below last week’s high of 0.8550. It has formed a slanting cup and handle pattern and moved to the 25-day moving average. The Relative Vigor Index (RVI) has moved slightly above the neutral level. Therefore, the pair will likely keep rising in the coming days.