Sample Category Title
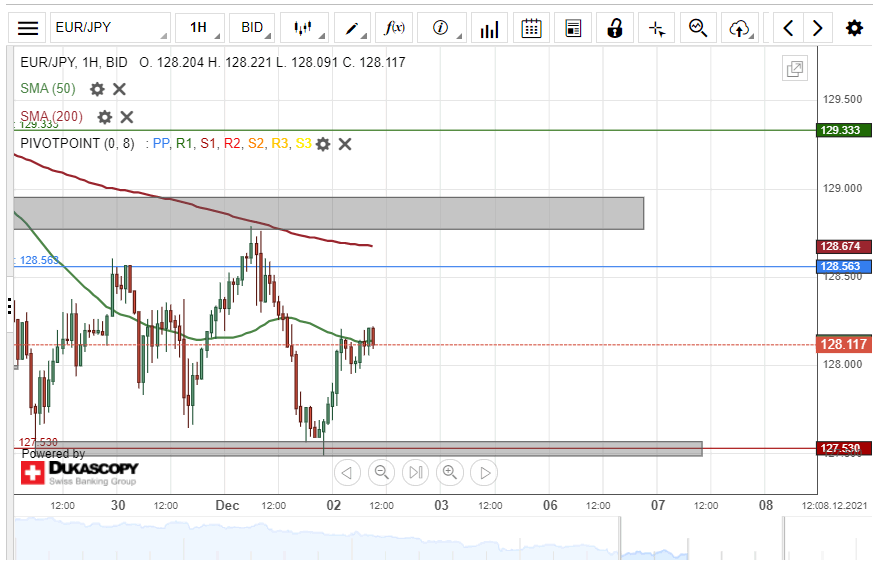
EUR/JPY Returns To 127.50
The EUR/JPY currency exchange rate found resistance in the 200-hour simple moving average near 128.70. The SMA provided enough resistance on Wednesday to cause a decline through the support of the 50-hour SMA to the 127.50 mark.
The 127.50 once again provided support and force the Euro into a recovery against the Japanese Yen. By the start of the day's European trading, the rate had encountered resistance at the 128.10 level, where the 50-hour simple moving average was located at.
A passing of the resistance of the 50-hour simple moving average, could result in the rate reaching the resistance of the weekly simple pivot point at 128.56. Above the pivot point, the 200-hour simple moving average acts as resistance near 128.65.
On the other hand, a potential decline might once again look for support in the 127.50 level and the weekly S1 simple pivot point at 127.53. Below these levels, there is no technical support as low as the weekly S2 simple pivot point at 126.76. However, take into account that the 127.00 mark might act as support.
AUDUSD Heads For Key Support Base, Bearish Tone Grows
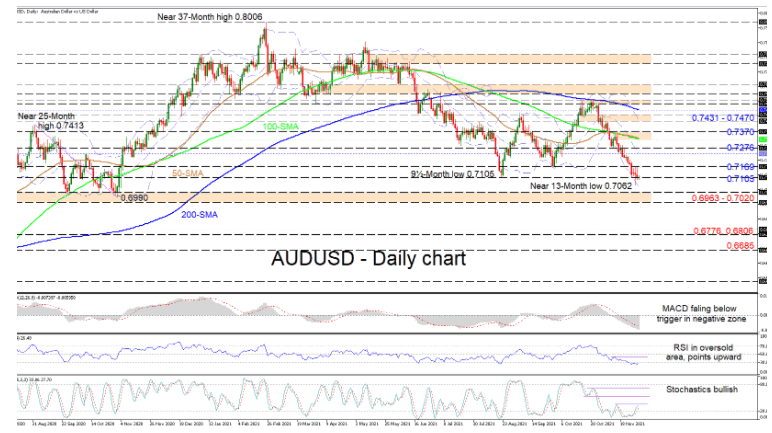
AUDUSD has been declining for a month now and is tracing the lower Bollinger band, managing to log a near 13-month low of 0.7062 on its way towards the critical support base of 0.6963-0.7020. The sliding simple moving averages (SMAs) are sponsoring a slight negative tilt in the pair.
The short-term oscillators are transmitting conflicting signals in directional impetus. The MACD is gliding beneath its red trigger line in the negative region, endorsing additional weakening in the pair. The RSI, in oversold territory, is turning upwards, while the stochastic oscillator is exhibiting a bullish charge, both suggesting that buyers are fighting back.
If negative pressures endure and detach the price from the 0.7105 barrier, a push down could encounter some friction around the nearby lower Bollinger band, currently in the vicinity of the near 13-month low of 0.7062. Not too far below is the crucial 0.6963-0.7020 support foundation, which has held since July 2020. Should this important boundary fail to terminate additional declines in the pair, the price may then aim for the 0.6806 and 0.6776 lows reached in the later part of June 2020. A deeper retracement could then seek out the 0.6685 inside swing high from March 2020.
If buyers manage to find their feet at the 0.7105 level, initial upside hindrance could stem from the inside swing low of 0.7169. Gaining more traction, the price may target the mid-Bollinger band at 0.7243 and the adjacent 0.7276 barrier. Breaching these obstacles too, buyers could tackle a zone of resistance formed between the 100-day SMA at 0.7326 and the 0.7370 high. Recouping more lost ground, the bulls may then eye the 0.7431-0.7470 resistance band.
Summarizing, AUDUSD is currently conveying a neutral-to-bearish tone in the medium-term timeframe below the SMAs. That said, for a bullish vibe to return, the price would need to climb back above the 0.7555 high. Moreover, for the broader positive outlook to endure, the price would need to remain above the 0.6963-0.7020 base.
The US Stock Indices Continue To Fall Amid Omicron Uncertainty
The US stock indices are negative again as the first Omicron case in the US caused more uncertainty. Although the potential appearance of Omiсron in the United States was expected, the official announcement was enough to send the market into a decline, which had previously been quite positive. Overall, investor sentiment was dampened by new concerns over the Omicron coronavirus variant and statements by Jerome Powell that the Fed was ready to accelerate the process of reducing the stimulation program. It could mean interest rates hikes sooner than expected. The Dow Jones (US30) decreased by 1.34% by market close, the S&P 500 (US500) decreased by 1.18%, the Nasdaq (US100) lost 1.83%.
The volatility in the financial markets has been near the highest level since January. Analysts believe the volatility will persist through the end of December, driven by a tightening of central bank policy to fight inflation, while the Omicron variant threatens to prevent the recovery from the pandemic. Many questions about this strain remain unanswered.
WHO experts are increasingly convinced that the new Omicron strain is very "soft" and so far has not led to a dramatic increase in deaths anywhere, including in southern Africa.
Japan wants to stop all incoming international flights. Japan's Ministry of Transportation is asking international airlines to stop booking all incoming flights into the country until 2022 because of the Omicron strain. The Japanese yen is at seven-week highs as investors shift their assets into safe-haven currencies. Airline stocks ended yesterday's trading with a sharp drop. American Airlines (AAL) decreased by 8%, United Airlines Holdings Inc (UAL) lost 7.6%, and Delta Air Lines (DAL) lost 7.4%.
Amazon (AMZN) is investing in 274 renewable energy projects around the world.
European stock indexes ended yesterday's trading with a solid gain despite rising inflation in the region as well as a rise in Covid-19 cases. French index CAC 40 (FR40) gained 2.4%, British FTSE 100 (UK100) jumped by 1.6%, German DAX (DE40) increased by 2.5%, Spanish IBEX (ES35) added 1.8%. The ECB representatives gave a clear understanding of the future monetary policy in the region. The ECB won’t reduce the PEPP program until the spring of 2022, so European stock indices will now be more resilient to shocks than US stock markets.
Turkey's central bank intervened in the markets by selling foreign currency for the first time in seven years to stop the lira from falling against the US dollar. The intervention was due to "unhealthy pricing" in the market.
The US oil inventories fell by 909,000 barrels over the week. Oil prices increased slightly in today's trading as investors adjust their positions ahead of the OPEC+ meeting, where the issue of production volumes will probably be considered. But analysts believe OPEC+ will decide to keep the current supply level and are confident that the growth of oil prices is limited. This is caused by concerns that the spread of the Omicron strain will negatively impact fuel demand since many countries have already closed flights.
The Central Bank of Ireland buys gold for the first time in years. The institution bought 2 tons of precious metal last month. The Irish central bank is adding to its gold reserves as inflation in the Eurozone far exceeds the European Central Bank's target. Singapore increased its gold reserves by about 20% earlier this year. But that doesn't mean that gold prices should rise at all. Gold has lost its status as a safe haven asset against inflation because it highly depends on US Treasury yields, which in turn depend on the Fed policy. When the QE program is cut, government bond yields rise, while making gold and silver prices fall.
Main market quotes:
- S&P 500 (F) (US500) 4,513.04 −53.96 (−1.18%)
- Dow Jones (US30) 34,022.04 −461.68 (−1.34%)
- DAX (DE40) 15,472.67 +372.54 (+2.47%)
- FTSE 100 (UK100) 7,168.68 +109.23 (+1.55%)
- USD Index 96.08 +0.08 (+0.08%)
Important events for today:
- Australia Retail Sales (m/m) at 02:30 (GMT+2);
- OPEC+ Meeting at 12:00 (GMT+2);
- Eurozone Unemployment Rate (m/m) at 12:00 (GMT+2);
- US Initial Jobless Claims (w/w) at 15:30 (GMT+2);
- US Treasury Secretary Yellen Speaks at 16:00 (GMT+2);
- US Natural Gas Storage (w/w) at 17:30 (GMT+2).
The Analytical Overview Of The Main Currency Pairs
The EUR/USD currency pair
Technical indicators of the currency pair:
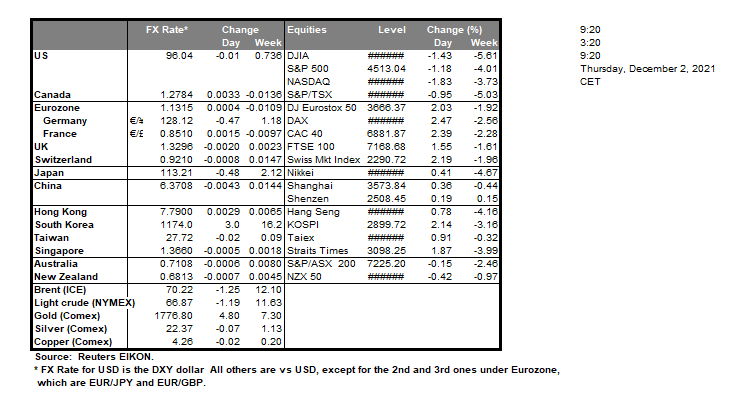
Prev Open: 1.1335
Prev Close: 1.1318
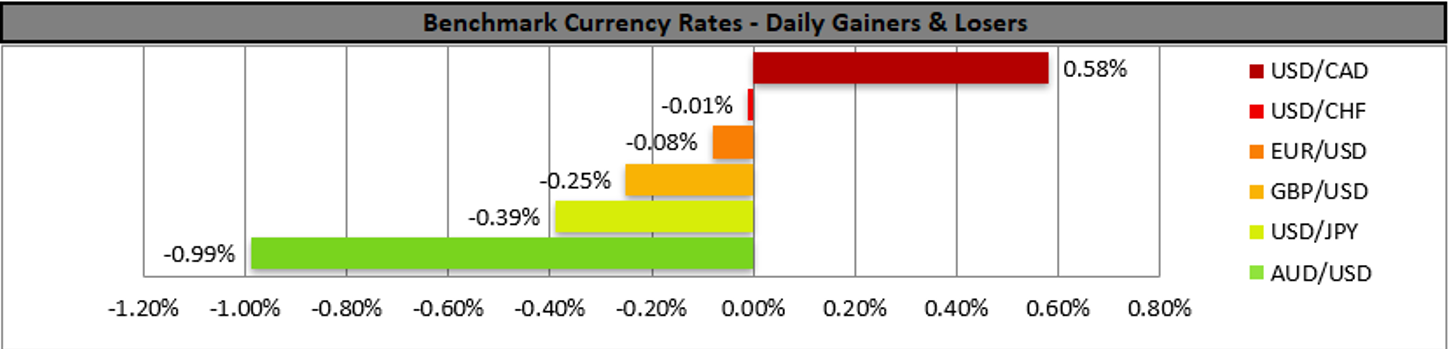
% chg. over the last day: -0.15%
German retail sales fell by 0.3% in October while a 1% increase was expected. The ECB balance continues to rise despite growing inflation. Total assets increased by another €14.7 billion last week to a new level of €8,457 billion. The ECB balance now equals 81.2% of Eurozone GDP, against 37.4% of the Fed, 42% of the Bank of England, and 134.6% of the Bank of Japan.
Trading recommendations
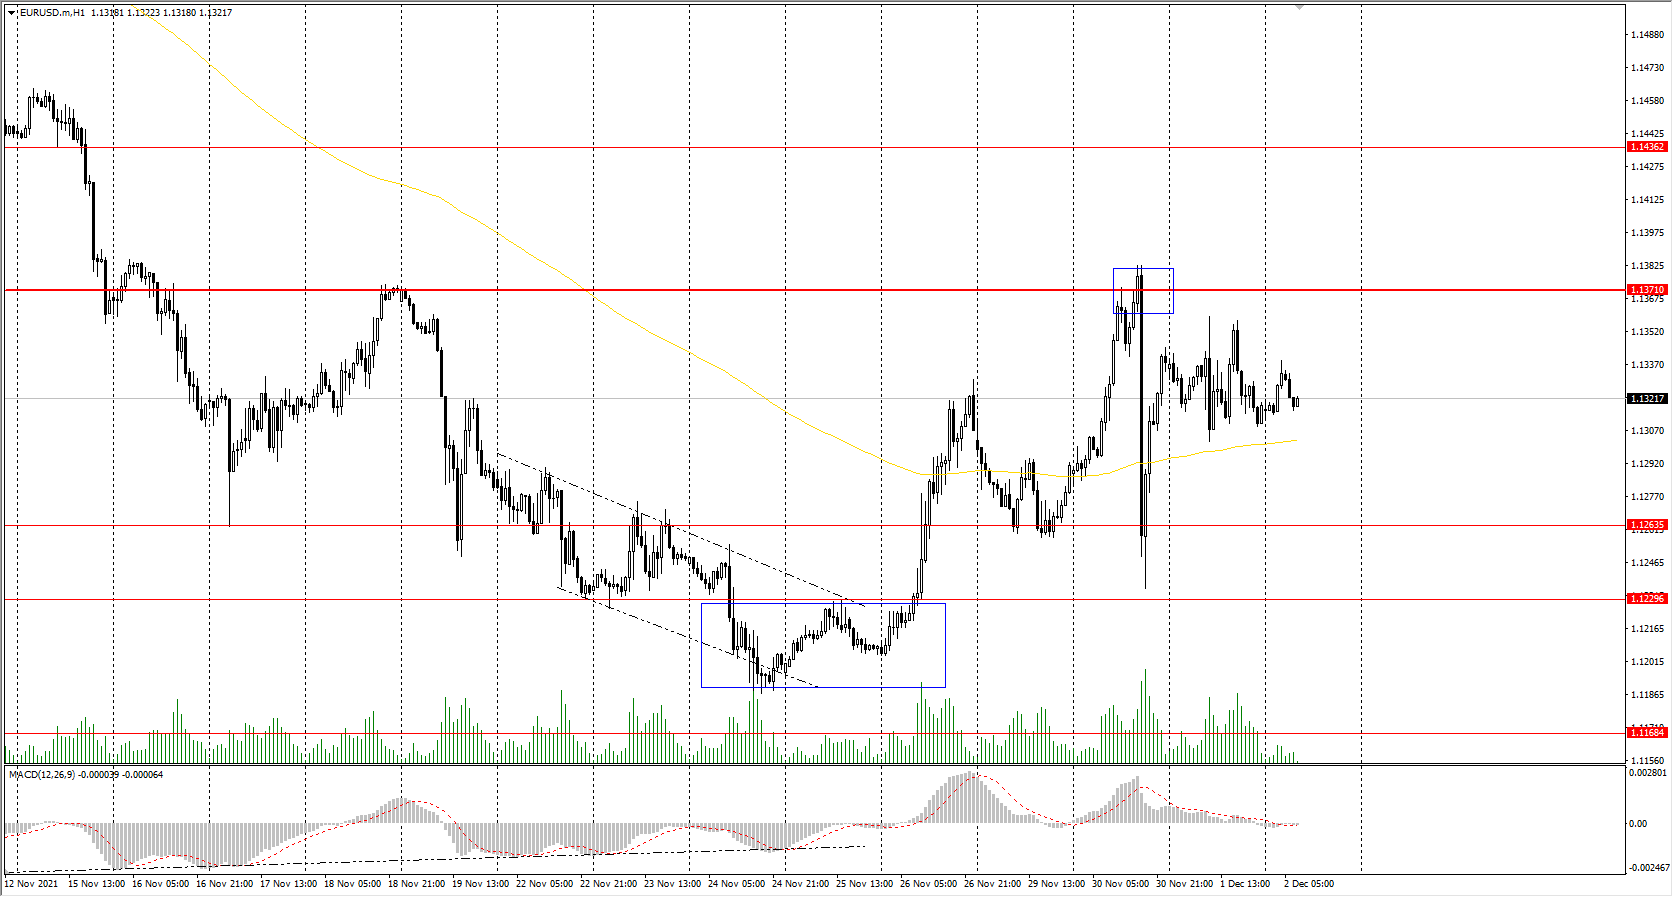
Support levels: 1.1263, 1.1230, 1.1168
Resistance levels: 1.1371, 1.1436, 1.1535, 1.1613, 1.1667, 1.1717
From the technical point of view, the EUR/USD on the hour time frame is still bearish. The price is currently trading in a narrow corridor. The MACD indicator has become inactive. Under such market conditions, traders should consider sell positions from the priority change level of 1.1371. Buy trades should be considered only from the support levels of the higher time frame, given the buyers' initiative, but only with short targets.
Alternative scenario: if the price breaks out through the 1.1371 resistance level and fixes above, the mid-term uptrend will likely resume.
News feed for 2021.12.02:
- Eurozone Unemployment Rate (m/m) at 12:00 (GMT+2);
- US Initial Jobless Claims (w/w) at 15:30 (GMT+2);
- US Treasury Secretary Yellen Speaks at 16:00 (GMT+2).
The GBP/USD currency pair
Technical indicators of the currency pair:
Prev Open: 1.3293
Prev Close: 1.3272
% chg. over the last day: -0.16%
Home prices in the UK continue to grow, hitting a new record again as demand remains strong. According to Nationwide, the average UK home price increased by 0.9% last month after rising 0.7% in October. Home prices have risen nearly 15% since March 2020.
Trading recommendations
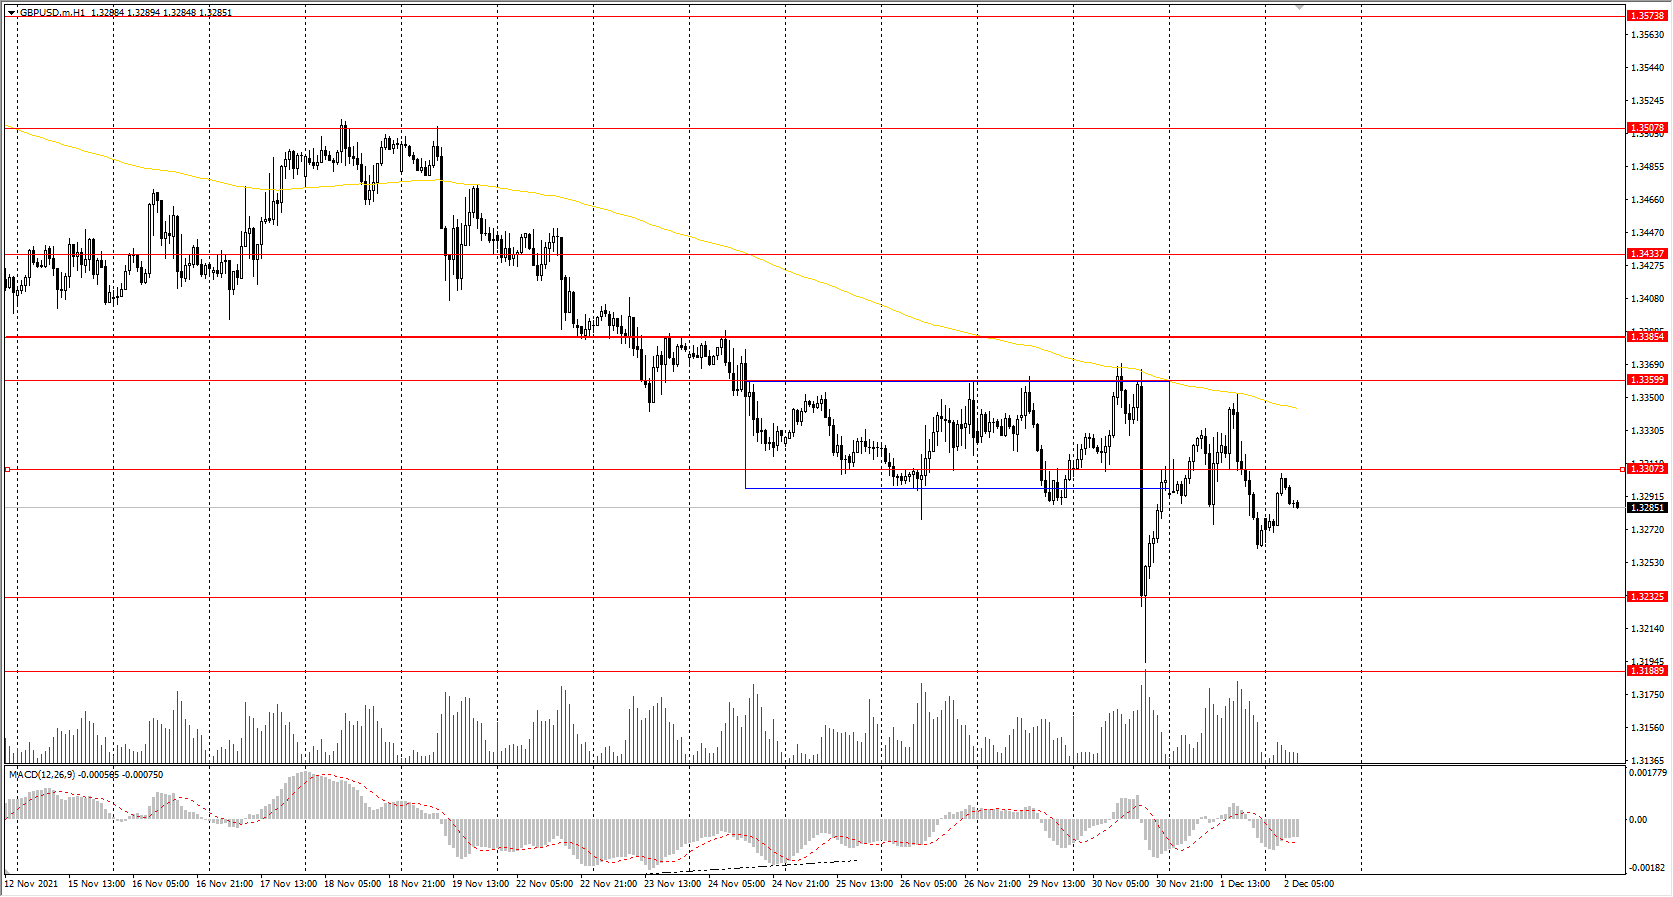
Support levels: 1.3232
Resistance levels: 1.3307, 1.3360, 1.3434, 1.3507, 1.3575, 1.3685, 1.3748
On the hourly time frame, the trend on GBP/USD is bearish. The MACD indicator has become negative but is still signaling divergence on several time frames. Under such market conditions, traders should consider sell positions from the resistance levels around the moving average. Buy trades should be considered on the support levels of higher time frames, given the buyers’ initiative.
Alternative scenario: if the price breaks out through the 1.3385 resistance level and consolidates above, the bullish scenario will likely resume.
The USD/JPY currency pair
Technical indicators of the currency pair:
Prev Open: 113.13
Prev Close: 112.76
% chg. over the last day: -0.32%
Japan's Ministry of Transportation is asking international airlines to stop booking all incoming flights to the country until 2022 because of the Omicron strain. The Japanese Yen is at seven-week highs as investors shift their assets into safe-haven currencies.
Trading recommendations
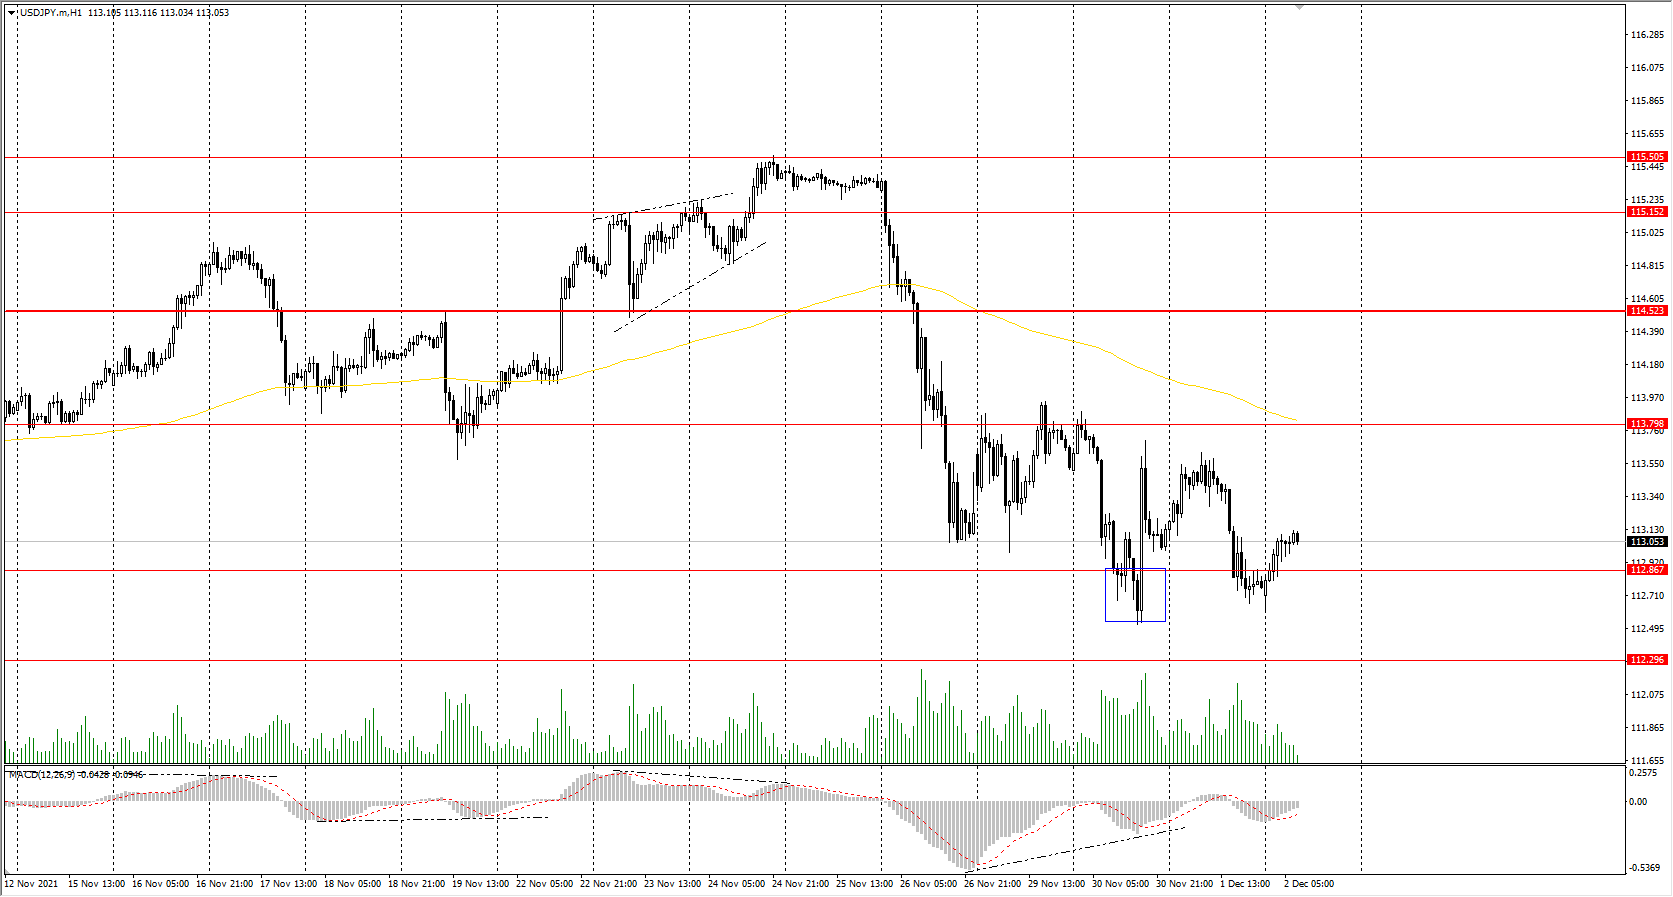
Support levels: 112.87, 112.30
Resistance levels: 113.79, 114.48, 115.15, 115.50
The global trend on the USD/JPY currency pair is bearish. At the moment the price is trading in the corridor with the 112.87-113.79 range. Under such market conditions, it is best for traders to look for sell positions from the resistance levels around the moving average or from the upper border of the corridor. Buy positions should be considered from the false breakdown zone, which was formed below when the price tried to move down.
Alternative scenario: if the price rises above 114.52, the uptrend will likely resume.
The USD/CAD currency pair
Technical indicators of the currency pair:
Prev Open: 1.2779
Prev Close: 1.2820
% chg. over the last day: +0.32%
From a fundamental point of view, the dollar index is now inclined to rise as the Fed has started cutting the QE program and may accelerate the process at the next meeting. Analysts are confused about how the new Omicron coronavirus strain will affect oil supply and demand and what OPEC+ will do after many countries release their strategic reserves to the market.
Trading recommendations
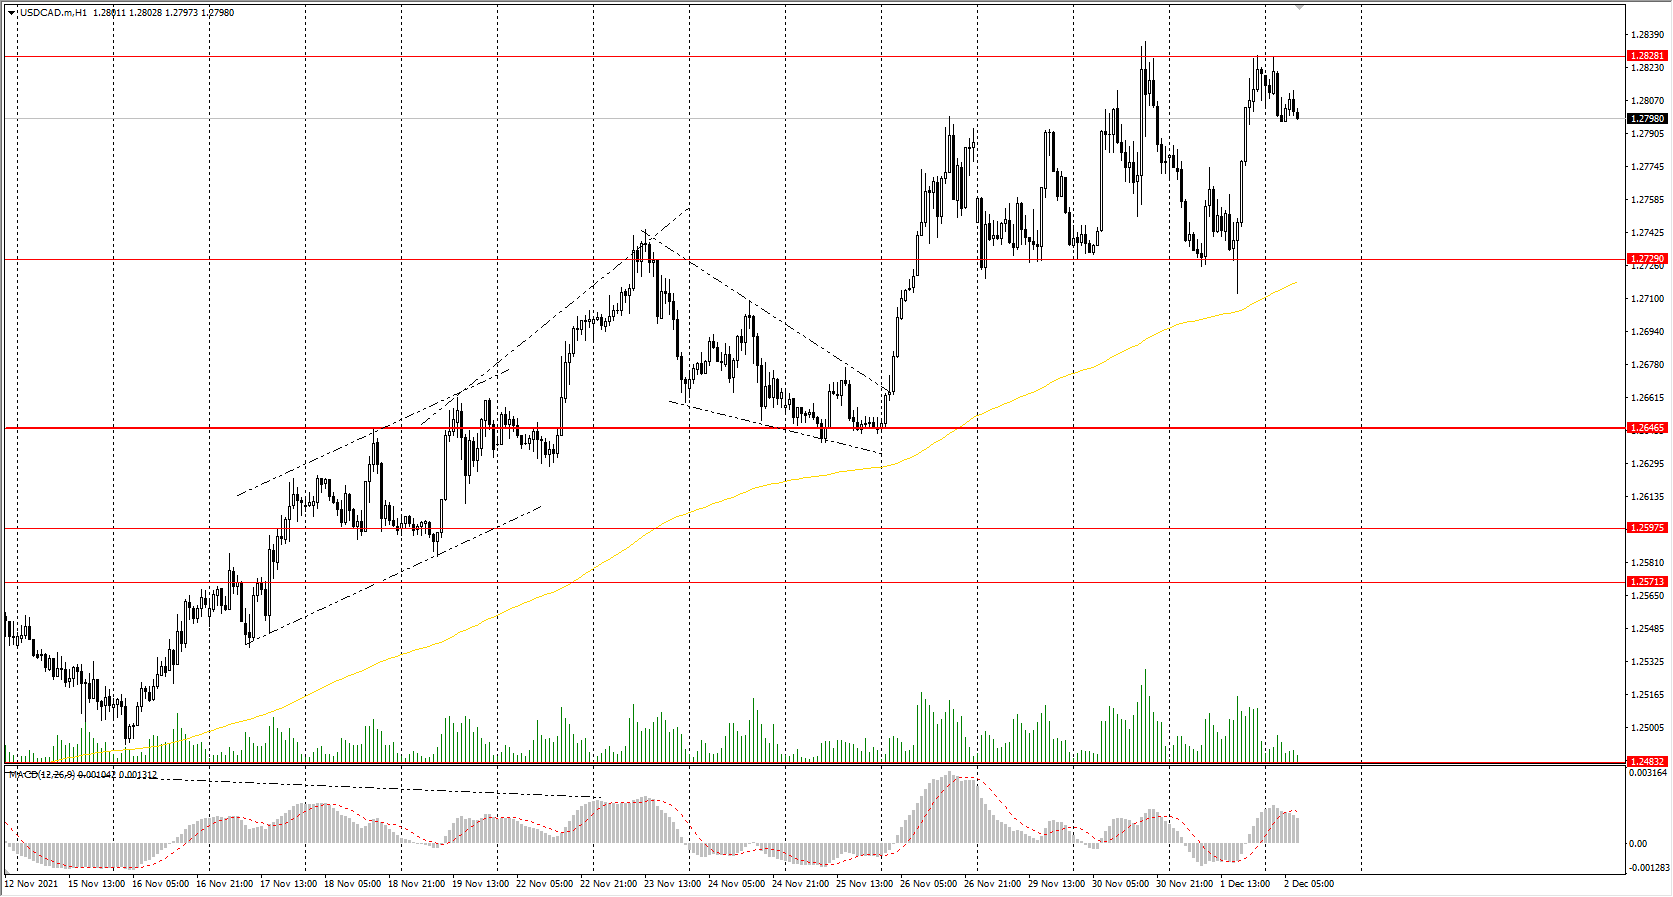
Support levels: 1.2729, 1.2646, 1.2598, 1.2571, 1.2483, 1.2416, 1.2388
Resistance levels: 1.2828
From a technical point of view, the trend of the USD/CAD currency is bullish. The price is trading flat in the corridor with a range of 1.2729-1.2828. The MACD indicator has become positive. Under such market conditions, it is better to look for buy trades from the lower border of the flat corridor. Sell deals should be considered from the resistance levels of the higher time frames.
Alternative scenario: if the price breaks down through the 1.2646 support level and fixes below, the downtrend will likely resume.
News feed for 2021.12.02:
- OPEC+ Meeting at 12:00 (GMT+2).
USD Remains Stable As Omicron Reaches US
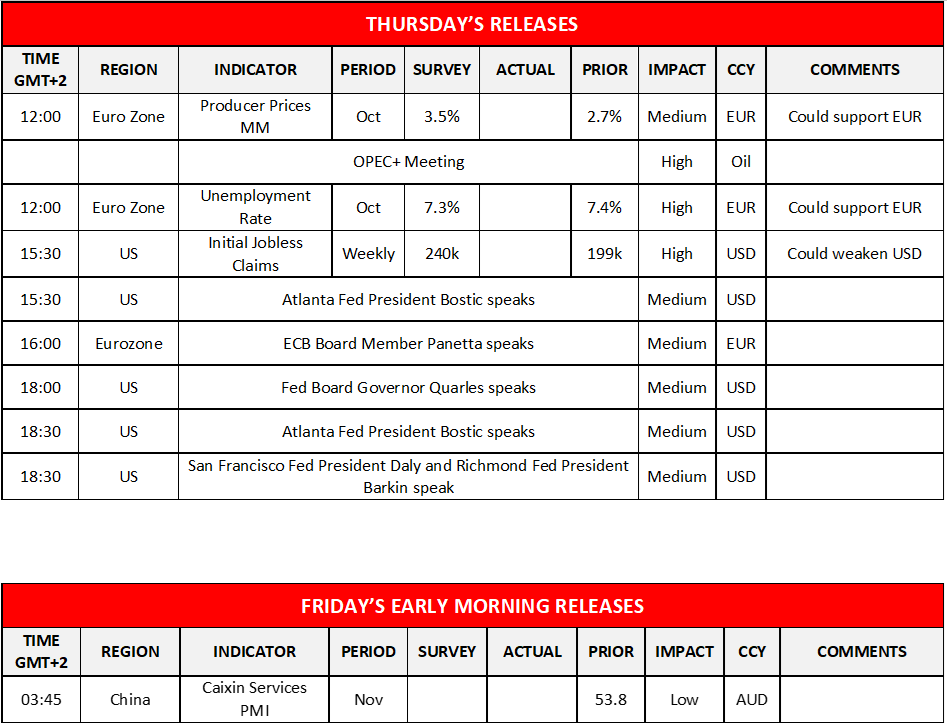
The USD tended to remain rather stable against a number of its counterparts yet the alarm is ringing as the first case of the Omicron variant was detected in the US. On the other hand Gold’s price seemed to gain yesterday yet relented any gains made and moved lower during today’s Asian session while US stockmarkets moved considerably lower due to the uncertainty posed by the pandemic. Fundamentals are still to play a key role for the market’s mood yet focus may start shifting towards the US employment market as the US employment report for November is due out tomorrow and today we highlight the release of the weekly US initial jobless claims which is also expected to rise after last week’s record low (since 1969) and if so could weaken the USD. On the monetary front we note the planned speeches of Atlanta Fed President Bostic (twice), Fed Board Governor Quarles, San Francisco Fed President Daly and Richmond Fed President Barkin. USD/JPY seems to have some bearish tendencies as it tests the 112.75 (S1) support line. For the time being though we maintain a bias for a sideways motion and for it to change in favour of a bearish outlook we would require a clear breaking of the 112.75 (S1) line. Please note that the RSI indicator below our 4-hour chart is between the reading of 50 and 30 implying a slight advantage for the bears. Should the bears actually take charge of the pair’s direction we may see it breaking the 112.75 (S1) support line and aim for the 112.10 (S2) level. Should the bulls take over, we may see the pair aiming if not breaking the 113.70 (R1) resistance line.
EUR remains stable as it remains firmly in the grip of the pandemic
The pandemic is all over EUR’s fundamentals as Europe is in the firm grip of the pandemic once again and could weigh on the common currency. It should be noted that the pandemic is blurring the outlook for the area and may support the notion of ECB’s dovish stance, yet given Fed Chair Powell’s hawkish turn, accelerating inflation rates and some member’s stance, ECB policymakers may want to have second thoughts. Today we note ECB Board Member Panetta which is scheduled to speak and should he maintain a dovish tone we may see EUR slipping. As for financial releases today we note the release of the Eurozone’s producer prices growth rate and the unemployment rate both being for October and their forecasts, seem to favor the common currency’s bulls as the accelerated inflationary pressures are expected to be reported for the area, while the unemployment rate is expected to tick down.
EUR/USD maintained a tight rangebound movement yesterday between the 1.1370 (R1) resistance line and the 1.1300 (S1) support line. We maintain expect the sideways motion to continue and for our outlook to change we would require a clear breaking of the either of the levels mentioned. Please note that the RSI indicator below our 4-hour chart is a bit higher than the reading of 50 and could be implying a slightly bullish sentiment in the market. Should the pair find extensive buying orders along its path, we may see it breaking the 1.1370 (R1) resistance line and aim for the 1.1435 (R2) resistance level. Should on the other hand, the pair fall under the selling interest for the market we may see EUR/USD breaking the 1.1300 (S1) support line and aim for the 1.1225 (S2) support level.
Other highlights today and during tomorrow’s Asian session
Besides the financial releases and central bank policymakers mentioned in the report we would like to highlight the OPEC+ meeting. The meeting is to discuss the oil production levels for the next months and given the release of strategic oil reserves by the US, China, Japan and India we may see OPEC maintaining its production levels unchanged, which could provide some support for oil prices. On the other hand, the Omicron variant may serve as a reason and/or an excuse to cut production levels further a scenario which is less possible yet should it be materialised could provide substantial support for oil prices.
USD/JPY H4 Chart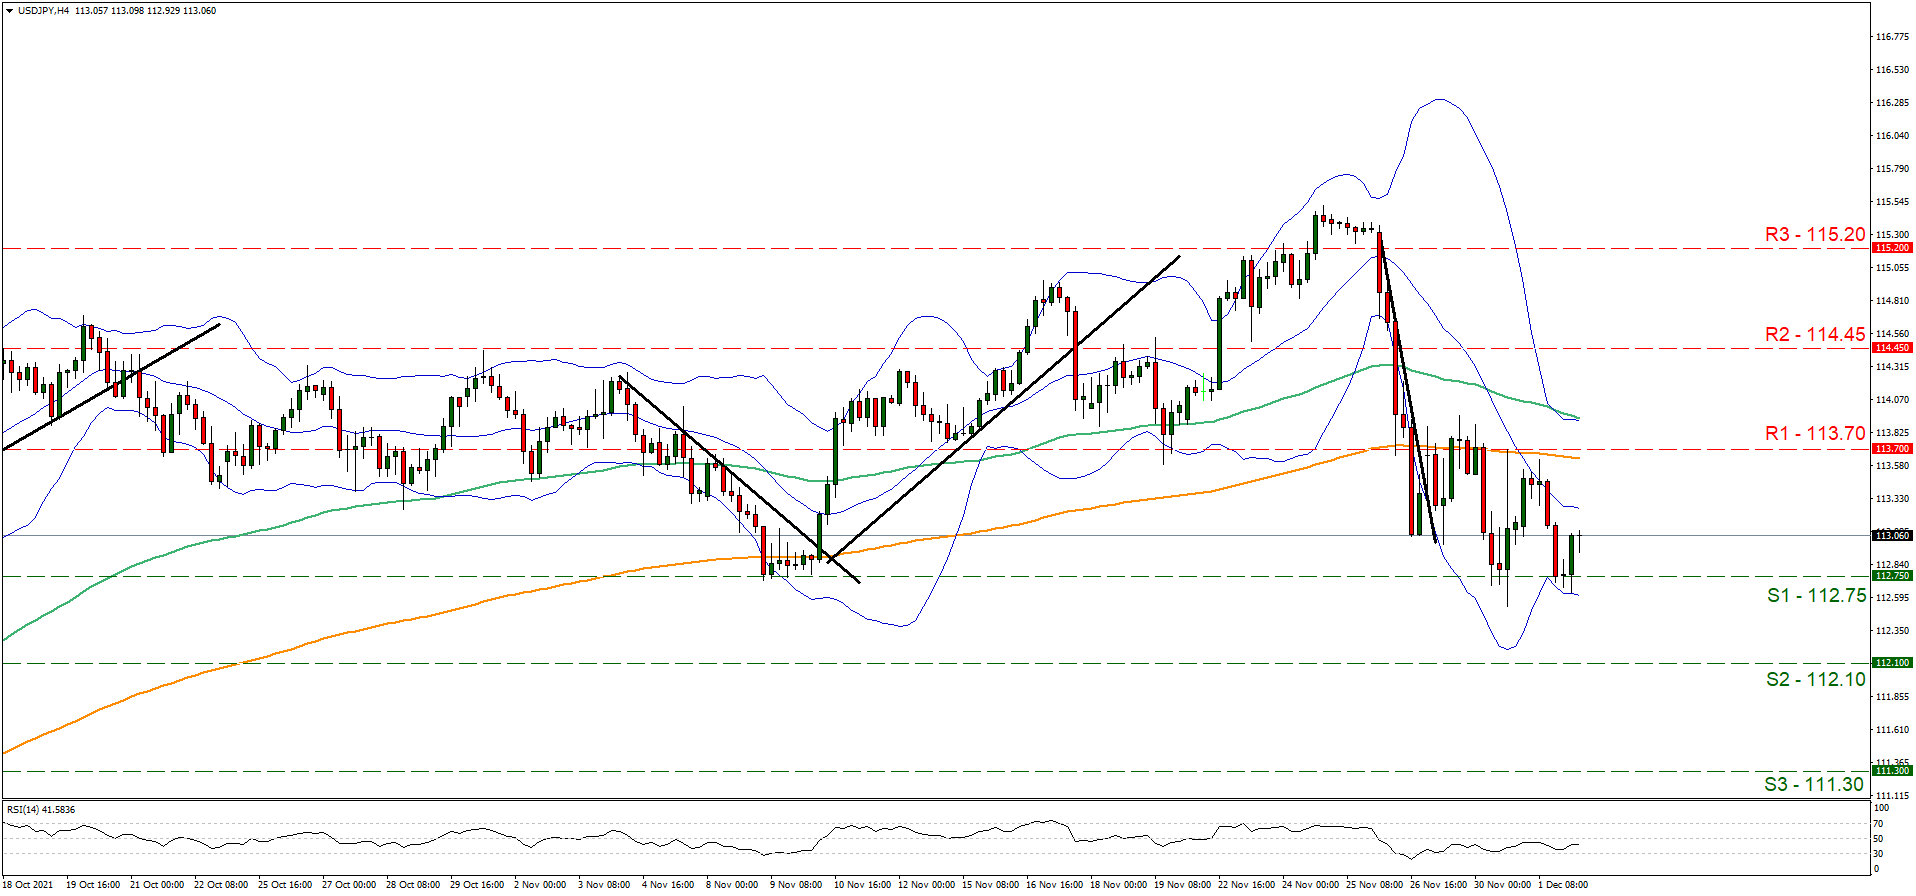
Support: 112.75 (S1), 112.10 (S2), 111.30 (S3)
Resistance: 113.70 (R1), 114.45 (R2), 115.20 (R3)
EUR/USD H4 Chart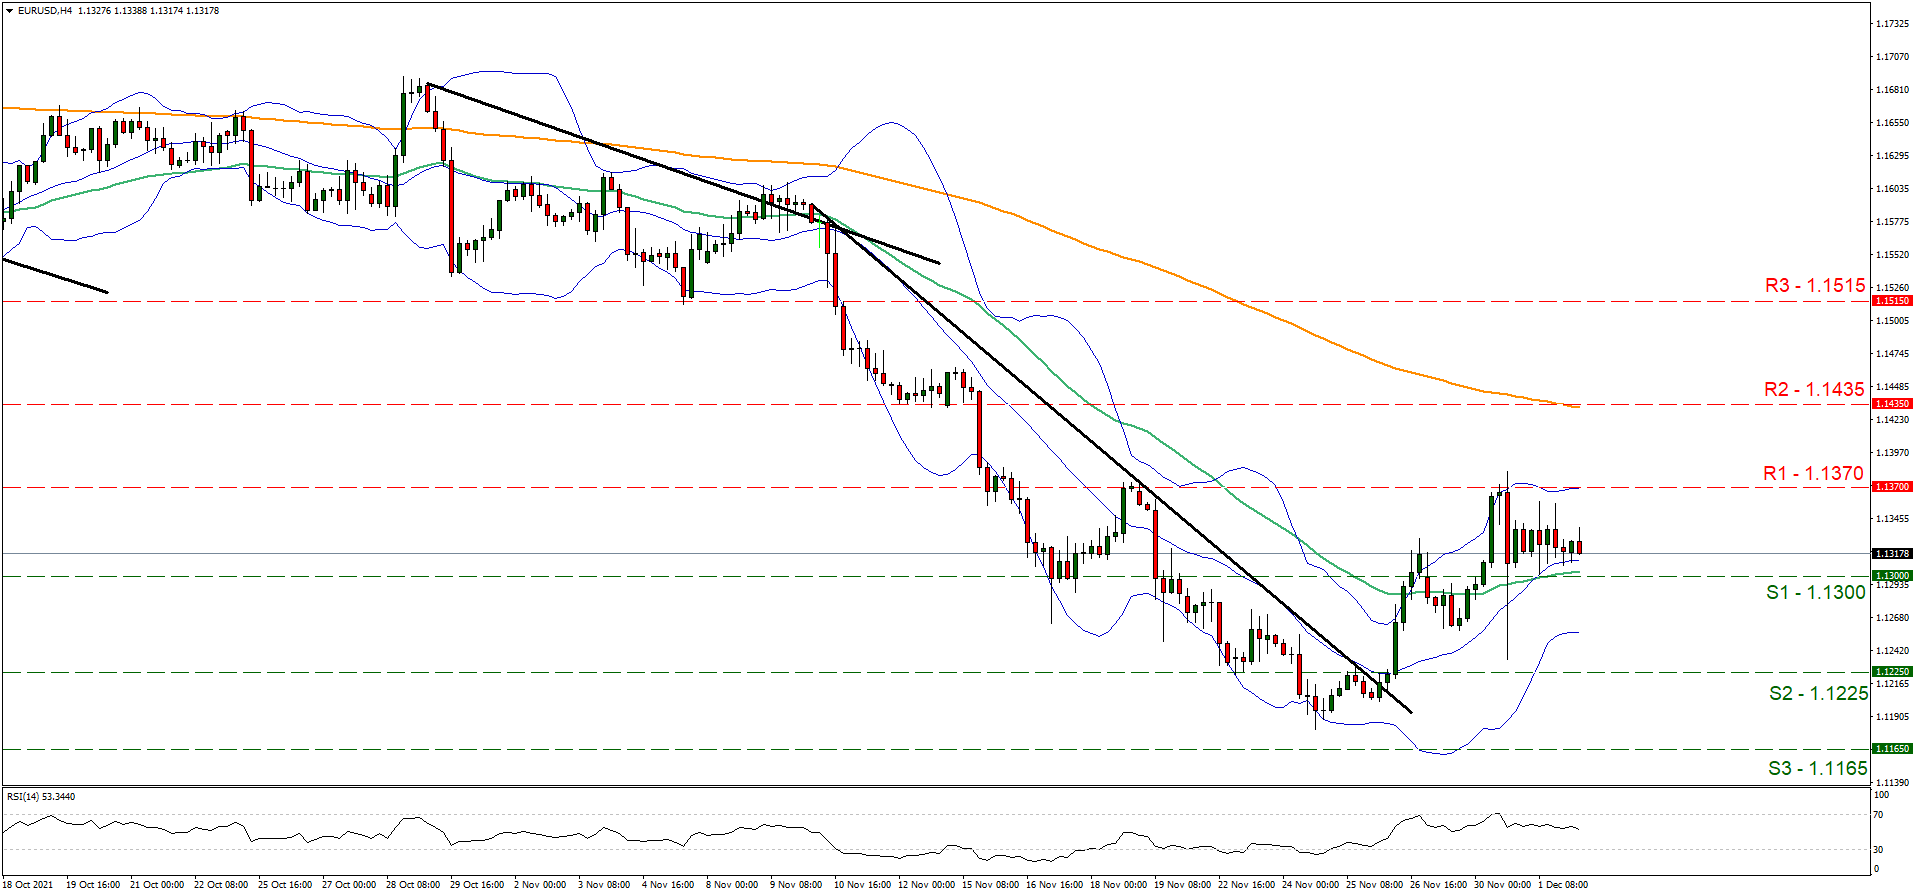
Support: 1.1300 (S1), 1.1225 (S2), 1.1165 (S3)
Resistance: 1.1370 (R1), 1.1435 (R2), 1.1515 (R3)
EUR/USD Outlook: Conflicting Techs Keep The Euro In Directionless Mode, US Jobs Data In Focus
Near-term action remains in a sideways mode on conflicting technical signals and ahead of US jobs data, which could provide more evidence about Euro’s direction.
Recovery attempts from new 2021 low that left a bear-trap under 1.1290 Fibo level, underpin the action, but overall bearish daily studies weigh.
Hawkish comments from Fed’s chief Powell, boost expectations for faster tapering that would open way towards the earlier than expected start of policy tightening.
Solid US private sector jobs data add to positive signals for dollar, but weekly jobless claims (today) and Nov NFP (Friday) would provide clearer picture about the situation in the US labor sector.
Neutral mode is expected to persist while the price stays between 10 DMA (1.1276) and Fibo 38.2% of 1.1692/1.1186 bear-leg (1.1379), with break on either side to generate initial near-term direction signal.
Res: 1.1363, 1.1379, 1.1439, 1.1463.
Sup: 1.1305, 1.1276, 1.1235, 1.1204.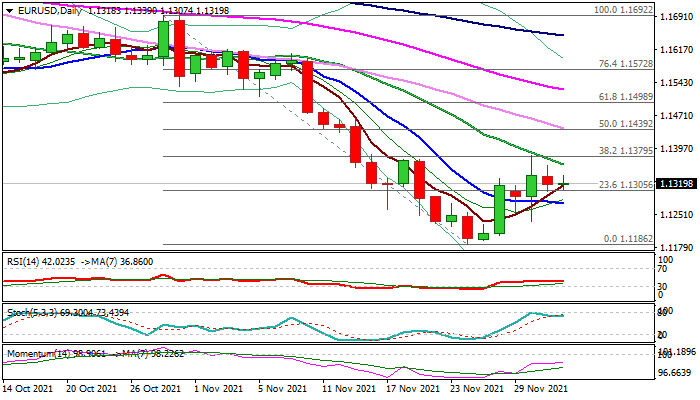
USDCHF Meets Support At 200-SMA, Long-Term Bullish Outlook
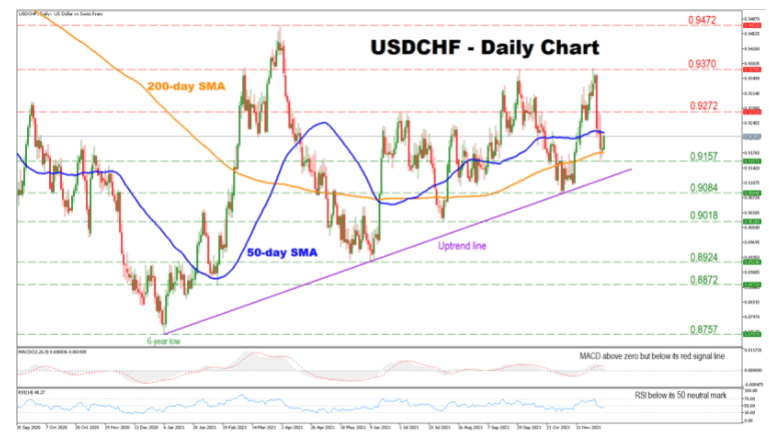
USDCHF pushed sharply below its November high to meet support at the 200-day simple moving average (SMA). However, the long-term outlook for the pair remains positive amid successive higher lows.
Nevertheless, the short-term momentum indicators are mostly supporting a negative bias for the pair, as the RSI is found below its 50 neutral mark. Also, despite being above zero, the MACD is located below its red signal line, indicating that the bears might be gaining ground.
Should the price break above its 50-day SMA currently found at 0.9224, positive bias could resurface, sending the price to test the 0.9272 barrier. A decisive move above this point could pave the way towards the 0.9370 resistance before the bulls shift their attention towards the 0.9475 obstacle.
On the flip side, if the price crosses below the 200-day SMA currently at 0.9178, the bears could immediately face limitations near the 0.9157 support. A break below that level could pressure the price towards its June uptrend line currently located at 0.9120. Crossing below this crucial point could turn the fortunes around for the pair, sending its price to test the 0.9084 and 0.9018 obstacles sequentially.
In brief, the long-term outlook remains positive with some immediate risks to the downside. For the current bullish sentiment to change, bears would need to break below the 200-day SMA.
WTI Oil Futures Aim For Recovery After Sharp Sell-Off
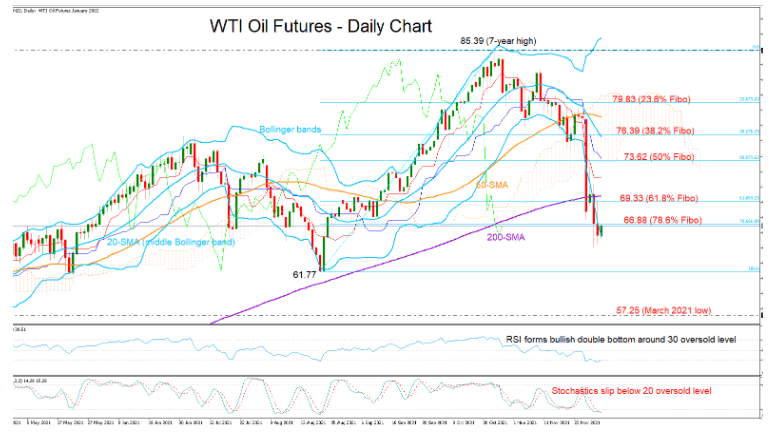
WTI oil futures (January 2022 delivery) faced the largest monthly decline since the start of the pandemic in November, with the price plunging well below its simple moving averages (SMAs) to meet support around a four-month low of 64.42 last week.
Despite a bearish start to the new month, oil could see its fortunes improving in the coming sessions as technical indicators are flashing oversold conditions. Particularly, with the market closing constantly below the lower Bollinger band during the past couple of days, the RSI forming a bullish double bottom below its 30 oversold level, and the Stochastics fluctuating below their 20 oversold mark, there is an increasing potential for a bullish bounce.
The 78.6% Fibonacci of the 61.27 – 85.39 upleg is currently limiting bullish flows around 66.88. Should it give way, the door would open for the 61.8% Fibonacci of 69.33 and the 200-day SMA slightly above. Then, if buying forces persist, the price could speed up towards the 50% Fibonacci of 73.62.
In the event sellers dominate below 64.42, the spotlight will shift straight to the August low of 61.77.A break below that floor could push some medium-term traders out of the market as well, likely bringing the 2021 March trough of 57.25 next on the radar.
Summarizing, WTI oil futures look bearish but oversold in the short-term picture. A step above the nearby resistance of 66.88 is expected to enhance buying appetite.
Crude Oil Price Retreats AHead Of Key OPEC+ Meeting
US stocks rallied as the market continued to reflect on the hawkish statement by Jerome Powell. In his testimony on Wednesday, the Fed chair hinted that the bank would move quickly to unwind quantitative easing. Analysts expect that the bank will end the program in the first quarter of 2022. In his second day of testimony on Thursday, Powell reiterated that he believes that the new Covid-19 variant will lead to higher inflation. Stocks also rose after positive US PMI and jobs numbers. According to the Institute of Supply Management (ISM), the country’s PMI rose to 61.1 in November. Also, data by ADP revealed that the private sector added more than 534k jobs in November.
The price of crude oil erased earlier gains after the latest US inventories numbers. The data showed that inventory buildup declined last week. According to the Energy Information Administration (EIA), inventories declined by more than 910k barrels last week. This was a smaller build-up than the median estimate of more than 1.2 million barrels. The price also declined after the first day of the OPEC+ meeting ended. The first day focused on administration issues. The cartel will conclude the meeting today with a decision on what to expect going forward. They could decide to continue with the pace of increases or even reduce.
The economic calendar will be muted today. Earlier, New Zealand published weak terms of trade numbers. The import and export price index declined in the third quarter because of the lockdowns that happened in the third quarter. Australia published strong retail sales numbers. The key data to watch will be the latest initial and continuing jobless claims numbers. Also, Fed members like Raphael Bostic and Mary Daly will also talk.
XBRUSD
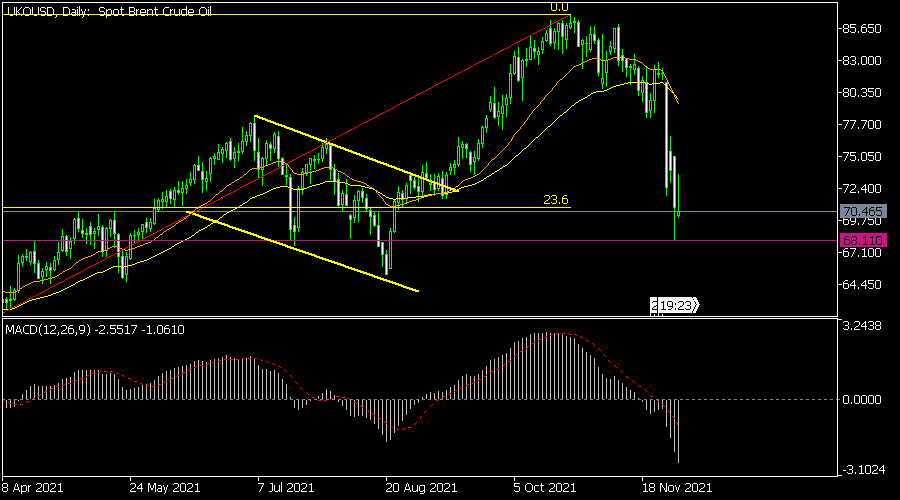
The price of Brent declined to a low of 67.62 in the overnight session. The pair is still below the 25-day and 50-day moving averages. On the daily chart, the MACD has moved below the neutral level. It also moved below the 23.6% Fibonacci retracement level. Therefore, there is a likelihood that the pair will likely keep falling as bears target the key support at 60.00.
EURUSD
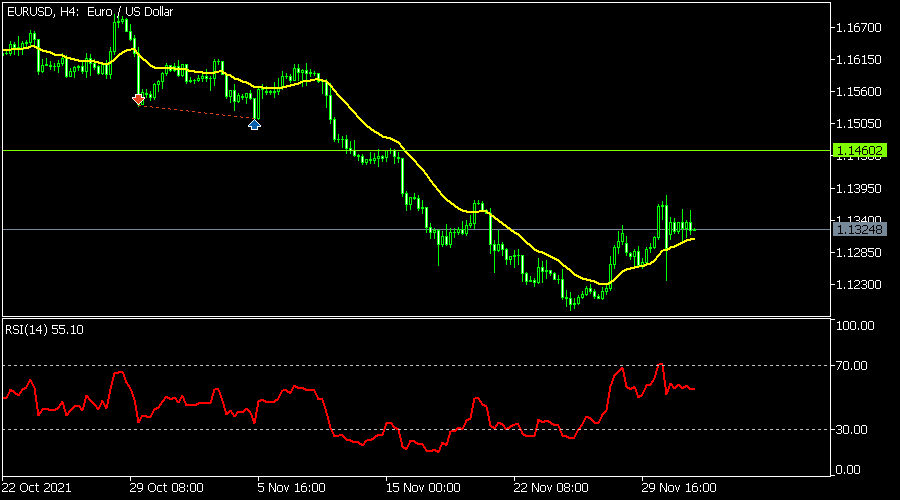
The EURUSD pair was little changed after the second day of Jerome Powell’s testimony. It is trading at 1.1325, where it has been since yesterday. The pair is slightly above the 25-day moving average while the Relative Strength Index (RSI) has moved below the overbought level. It has also formed a small, inverted head and shoulders pattern. Therefore, the pair will likely keep rising as bulls target the key resistance at 1.1460.
USDJPY
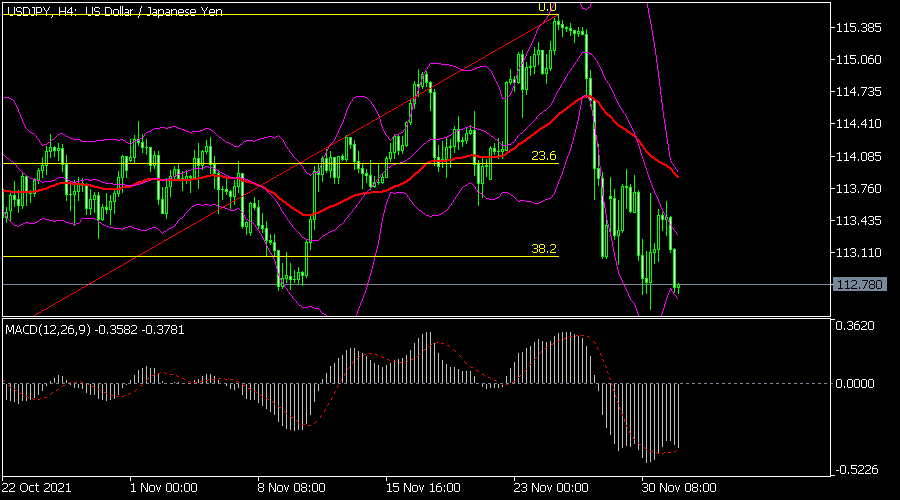
The USDJPY pair declined to a low of 112.71, which was slightly above this week’s low of 112.55. On the four-hour chart, the pair has formed a bearish flag pattern. It has also moved between the 50% and 38.2% Fibonacci retracement levels. The pair is along the lower side of the Bollinger Bands while the MACD has moved below the neutral level. Therefore, the pair will likely keep falling as bears target the key support at 112.
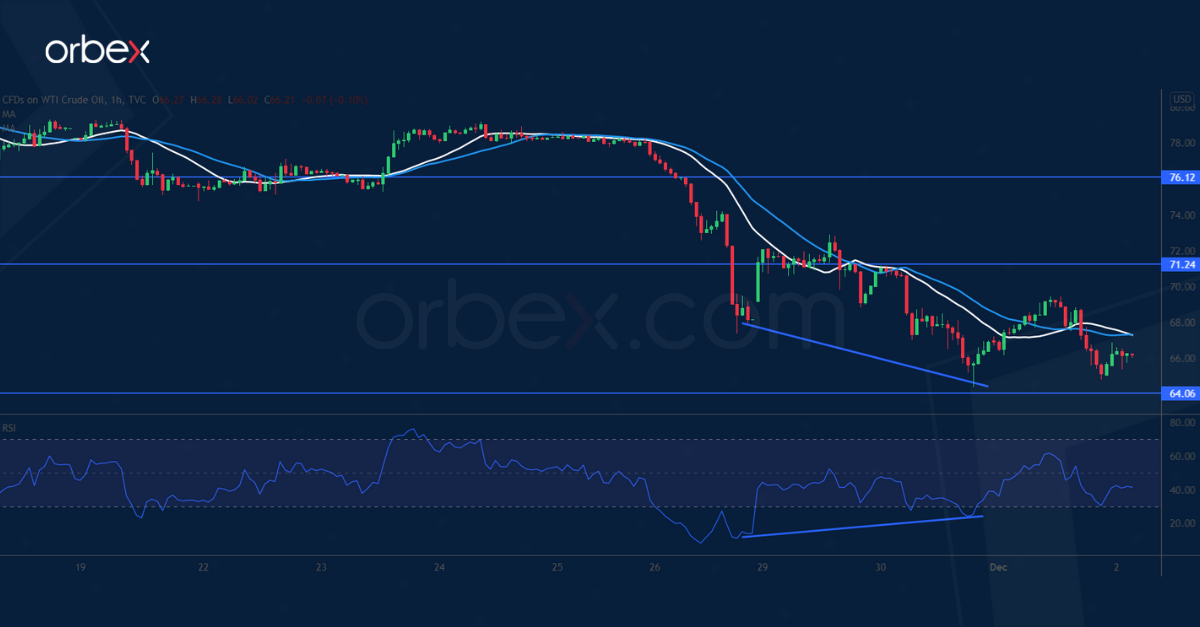
US Oil Tests Major Demand Zone
WTI crude inches higher as OPEC+ discuss whether to let additional output flow as previously planned. The price is hovering above a major demand zone between 62.00 and 64.00.
A bullish RSI divergence indicates that the selling pressure might have eased. A rally above 71.20 could force the short side to cover and bring in more buying momentum. Then 76.00 would be the next hurdle before a full-blown recovery.
On the downside, a bearish breakout could trigger a broader sell-off and potentially derail a 19-month long rally.