Sample Category Title
EUR/USD Outlook: Bear Trap Signals Boost Recovery But Near-Term Picture Is Still Mixed
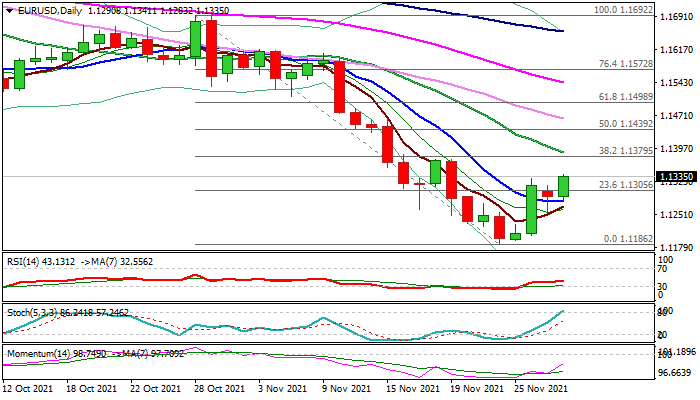
The Euro extends gains above 1.13 mark in early Tuesday, following sideways mode previous day, but managed to register the second consecutive daily close above 10DMA (1.1281) that adds to signals of a bear trap under 1.1290 Fibo support.
Fresh advance rose above last Friday’s high (1.1330), boosting hopes for stronger rebound, which looks for confirmation of sustained break above 1.1380 zone (Fibo 38.2% of 1.1692/1.1186 bear-leg/falling 20DMA).
Mixed daily techs (momentum is in a steep ascend, though still in the negative territory/5/10DMA’s are converging and about to form a bull-cross, but 10/20/30DMA’s continue to head south and stochastic enters overbought zone) make near-term picture unclear.
Two scenarios are currently in play: recovery stall under 1.1380 and fresh push lower that would keep bearish structure intact or lift above 1.1380 zone pivots that would sideline bears and open way for stronger correction towards Fibo barriers at 1.1439 (50% of 1.1692/1.1186), 1.1499 (Fibo 61.8%) and 1.1545 (falling 50DMA).
The dollar remains in defensive for the third straight day that supports Euro’s recovery, but growing fears about the impact of new virus variant Omicron, may further dampen the risk appetite.
Res: 1.1379, 1.1389, 1.1439, 1.1498.
Sup: 1.1305, 1.1281, 1.1258, 1.1204.
US 30 Sees Limited Rebound
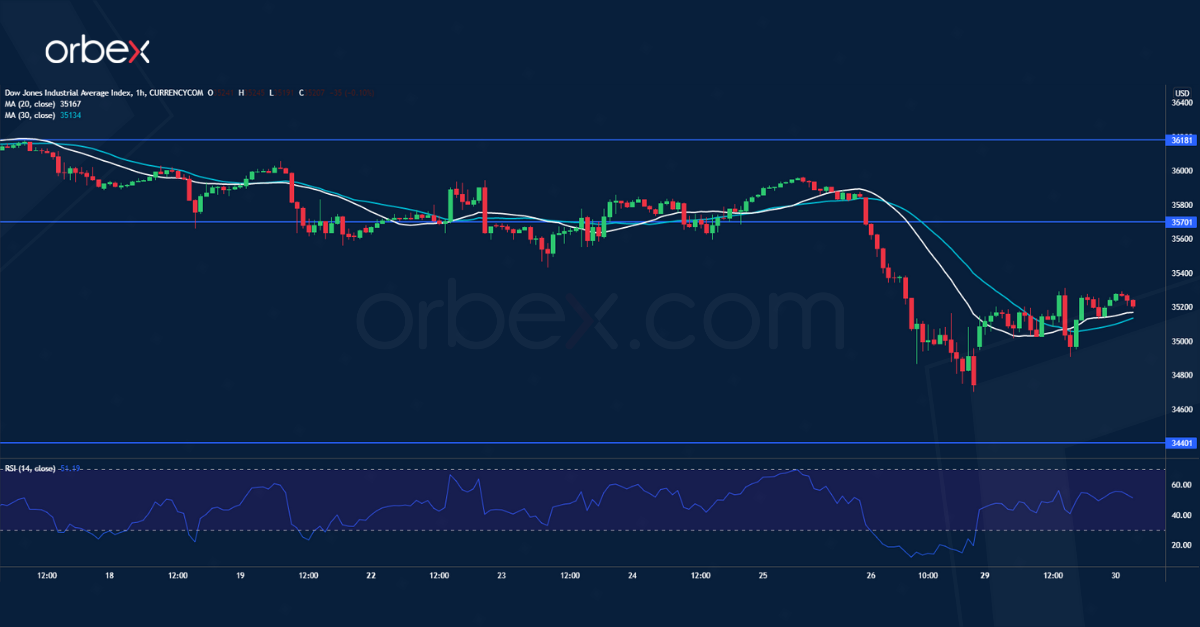
The Dow Jones 30 struggled to bounce as investors grew cautious. A break below the demand zone near 35500 has prompted the bulls to exit and reassess the short-term sentiment.
An oversold RSI may cause a limited rebound as traders take profit. 35700 is now a resistance and the bears may see a rally as an opportunity to sell into strength.
The demand zone between 34150 and 34400 from mid-October is a major floor to keep the uptrend intact. A deeper correction may send the index towards 33000.
NZD/USD Breaks Major Support
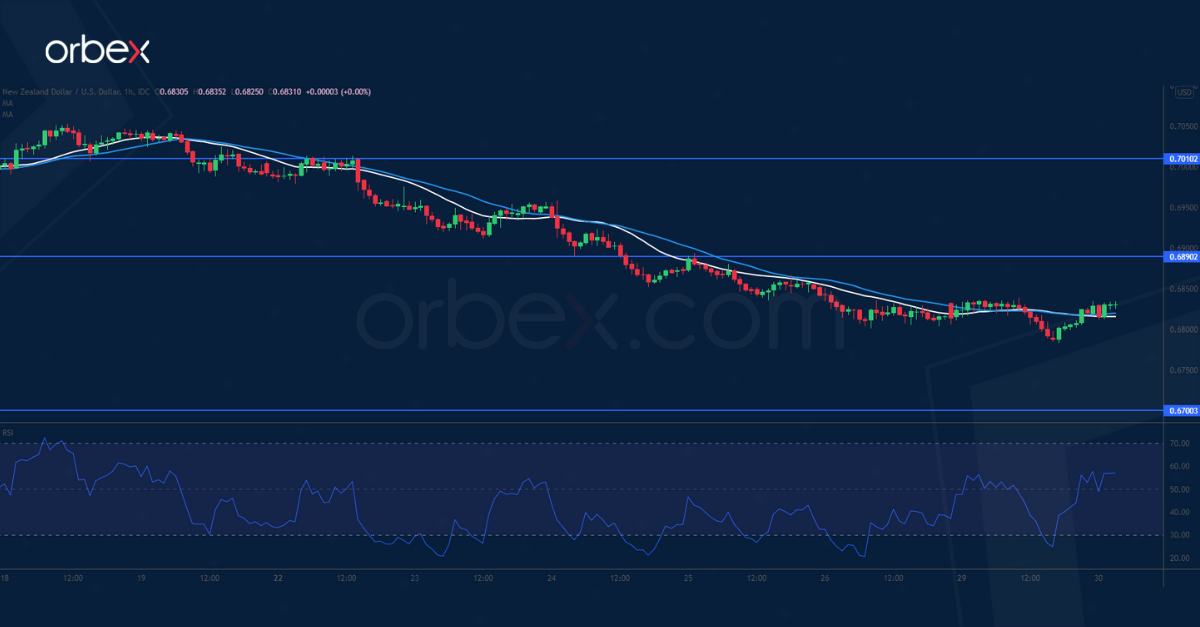
The New Zealand dollar remains under pressure as risk assets suffer from the omicron variant scare. A break below the daily support at 0.6860 has put the buy-side on the defense.
Sentiment has become increasingly downbeat after the pair fell past last August’s low at 0.6805, which is a second line of defense on the daily chart. 0.6700 would be the next support.
The RSI’s repeatedly oversold situation has caused a temporary rebound. But buyers will need to clear 0.6890 before they could turn the tables.
USD/JPY Tests Daily Support
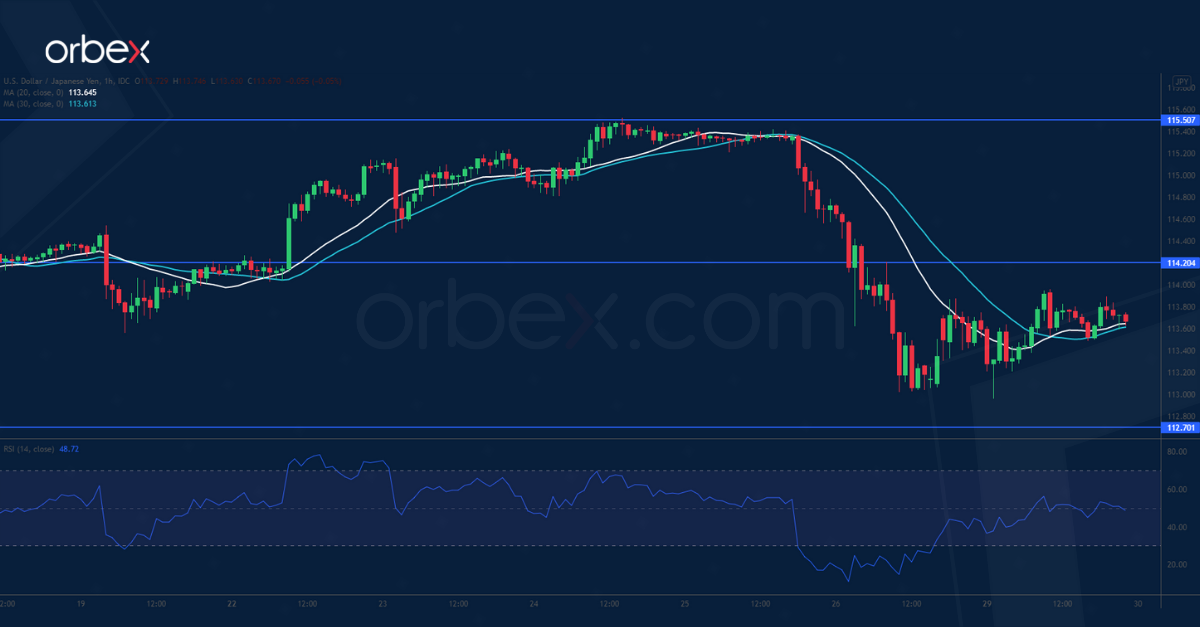
The yen consolidates gains after a drop in Japan’s unemployment rate.
The pair has met stiff selling pressure at March 2017’s high (115.50). The drop below 114.80 then 114.00 has forced short-term positions to bail out, exacerbating the sell-off.
The US dollar is hovering above the key daily support at 112.70. An oversold RSI has brought in some buying interest. 114.20 is a fresh resistance. On the downside, a breakout could dent the optimism in the medium-term and pave the way for a bearish reversal.
Gold On The CUSP Of A Major Bearish Breakout
American stocks jumped on Monday as investors continued to reflect on the Omicron variant and the strong US pending home sales numbers. The Dow Jones rose by more than 250 points while the Nasdaq index rose by more than 290 points. At the same time, the CBOE volatility index declined by more than 21%. This is a signal that investors believe that the new variant will not have a major impact on the economy. Meanwhile, Twitter shares jumped by more than 5% after Jack Dorsey stepped down. Other top laggards were companies like Peloton, Robinhood, and Teladoc. Aviation stocks like United Airlines and American Airlines also jumped.
The US dollar index rose as the market reflected on testimony by Jerome Powell and Janet Yellen. In a statement, Powell reiterated that the American economy was doing quite well. This is evidenced by the recent stream of strong numbers from the country. The unemployment rate has dropped to 4.6% while the initial jobless claims have dropped to the lowest level in more than 50 years. On Monday, data showed that the country’s pending home sales rebounded by 7% in October. Later today, the currency will react to the latest US home price index and consumer confidence data.
The euro was little changed against the US dollar as the market reflected on the strong consumer inflation numbers from Europe. On Monday, data by the German statistics agency revealed that the country’s inflation jumped by 6% in October. The same trend has been seen in other countries even as the European Central Bank (ECB) insisted that it is transitory. The currency will today react to preliminary inflation data from the Eurozone and France. Germany will also publish the latest unemployment numbers.
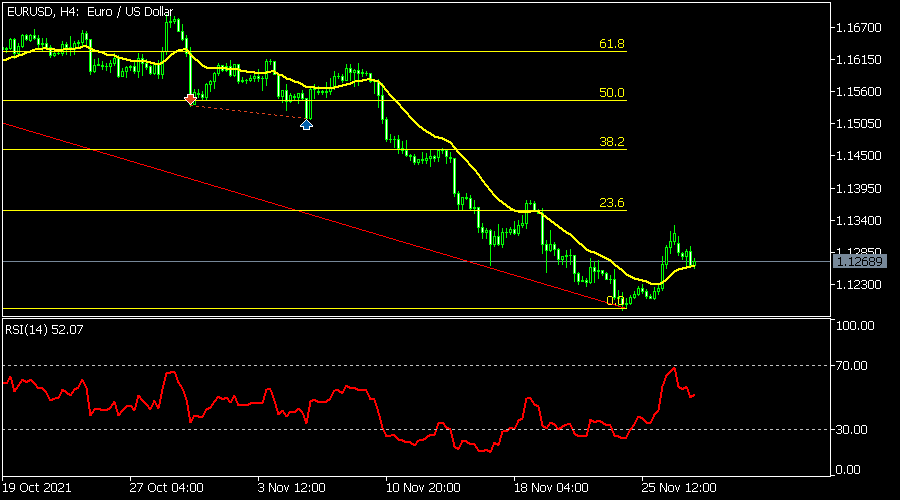
EURUSD
The EURUSD pair retreated slightly during the American and Asian sessions. The pair is trading at 1.1268, which is slightly below last Friday’s high of 1.1335. On the four-hour chart, the pair is still slightly below the 23.6% Fibonacci retracement level. It has also moved to the 25-day moving average while the Relative Strength Index (RSI) has moved below the oversold level. The pair will likely resume the bullish trend as the market target the Friday high at 1.1335.
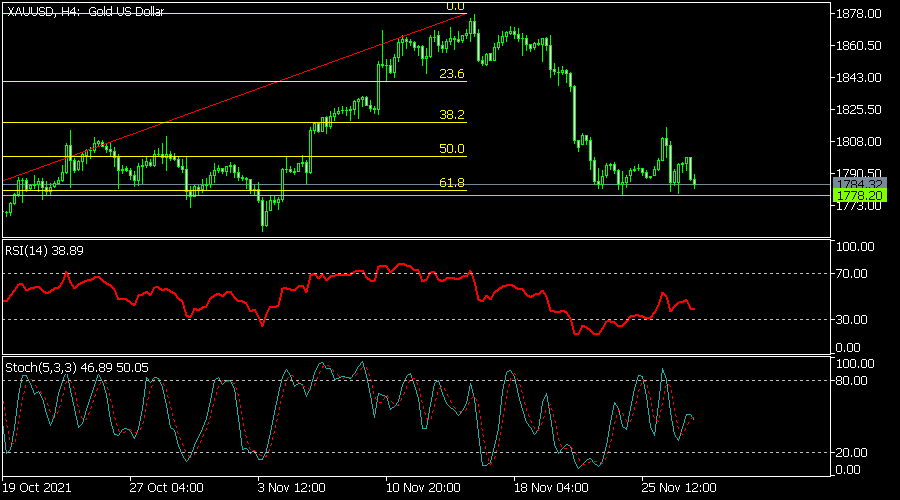
XAUUSD
The XAUUSD pair retreated as the US dollar strength continued. On the four-hour chart, the pair is trading slightly above the key support level at 1,778. This was the lowest level on November 9th. It has moved below the 25-day moving average. Also, it has declined to the 61.8% Fibonacci retracement level. The Stochastic oscillator has also dropped from the overbought level. Therefore, the pair will likely break out lower in the coming days.
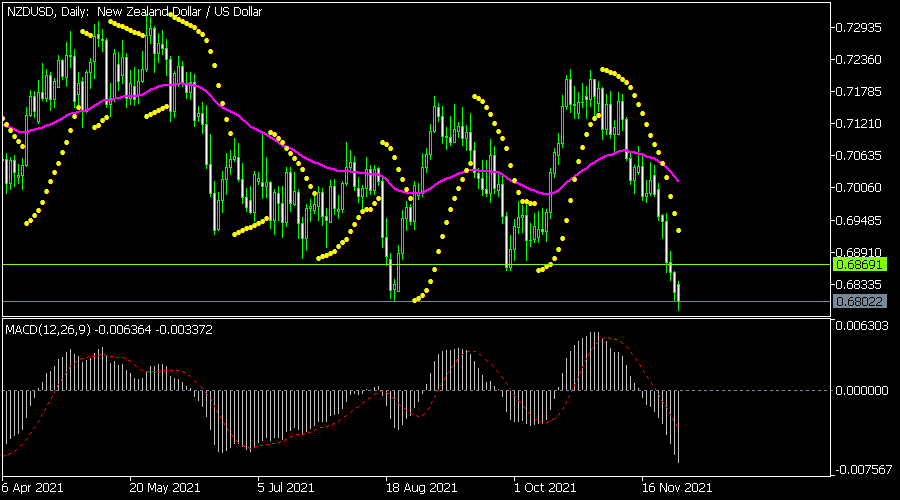
NZDUSD
The NZDUSD pair tumbled to 0.6786, the lowest level since November 2020. On the daily chart, the pair has moved below the key support level at 0.6870. This was the lowest level in September this year. It has also fallen below the 25-day moving average and the Parabolic SAR indicator while the MACD has fallen below the neutral level. Therefore, the path of the least resistance for the pair is to the downside.
USD/CAD Tests Resistance Of 1.2800 Mark
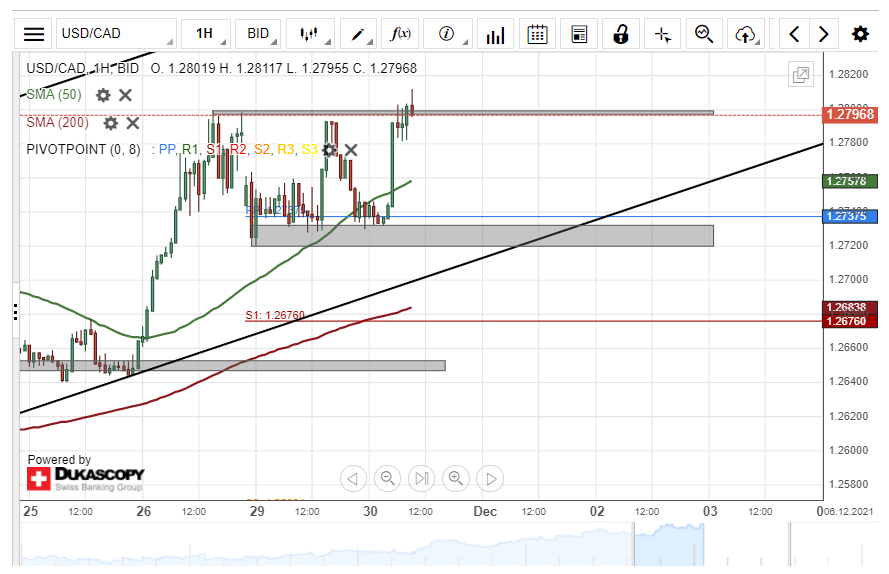
First of all, take into account that the USD/CAD rate has revealed a support zone at 1.2720/1.2732. The support zone has been both keeping the rate from declining and providing support to surges. The pair has made two attempts to surge higher, which have been stopped by the resistance of the 1.2800 level.
If the USD/CAD manages to break the 1.2800 level's resistance, a potential surge might aim at the combination of the weekly R1 simple pivot point at 1.2847 and the 1.2850 mark. Above these levels, the 1.2900 level and the weekly R2 simple pivot point at 1.2909 might serve as resistance.
On the other hand, a bounce off from the 1.2800 mark would most likely once again look for support in the 1.2720/1.2732 zone.
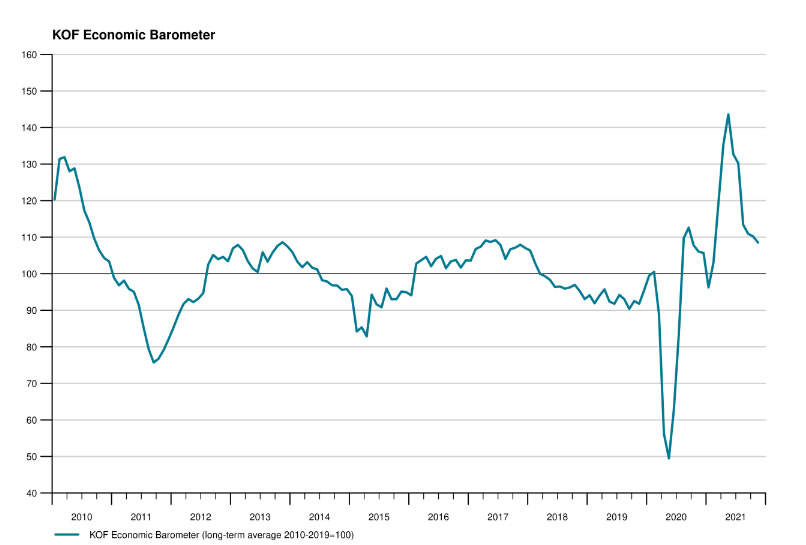
Swiss KOF dropped to 108.5, a step further back to long term average
Swiss KOF economic barometer dropped to 108.5 in November, down from 110.2, below expectation of 109.0.
KOF said: "The KOF economic barometer moves one step further towards its long-term average shortly before the end of the year. The high-flying of the barometer, which was observed in the middle of the year, is being cushioned by a further corrective movement. However, the barometer remains above its long-term average. The prospects for the Swiss economy remain positive, given that economic activity is not impaired by a recurring spread of the virus."
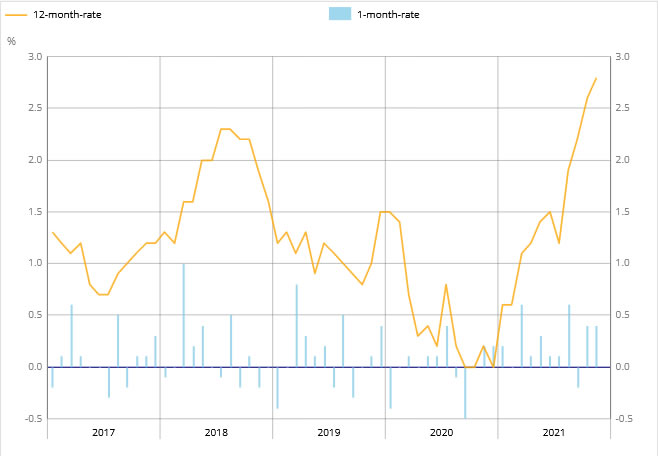
France CPI surged to 2.8% yoy, household consumption dropped -0.4% mom
France CPI surged to 2.8% yoy in November, following 2.6% yoy in October. HICP inflation also jumped to 3.4% yoy, up from 3.2% yoy. That's also the highest level since 2008.
"This inflation for us today is temporary, it is linked to strong demand, itself linked to a recovery that is much stronger than we anticipated," Finance Minister Bruno Le Maire said.
Household consumption expenditure on goods in volume dropped -0.4% mom in October, versus expectation of 0.3% mom rise. Consumption remained below 01.8% below its pre-crisis level in Q4 2019. The contraction was mainly due to a sharp drop in consumption of manufactured goods (-1.8%). It is partially offset by the recovery in consumption of food (+0.7%) and energy (+1.0%).
Also released, GDP was finalized at 3.0% qoq in Q3, unrevised.
GBP/JPY Breaks Triangle Pattern
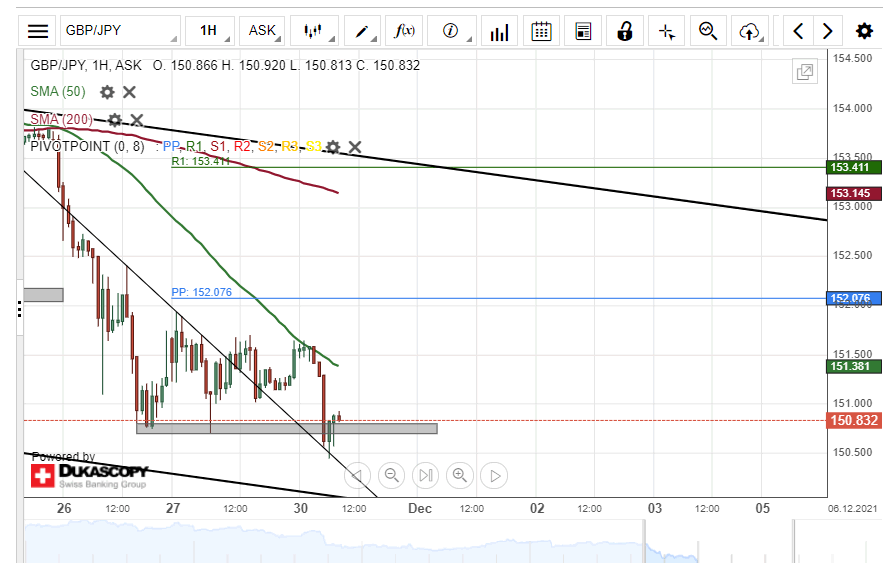
The GBP/JPY pair broke the descending triangle pattern by passing its upper trend line. However, the event did not result in a surge, as the pair traded sideways in an almost 50 base point range between 151.00 and 151.50.
The sideways trading ended on Tuesday morning, as the 50-hour simple moving average approached the rate from above and caused a decline. By the start of the day's European trading, the GBP/JPY had reached the 150.50 mark.
In the case that the rate continues to decline, it might reach the 150.00 level and the lower trend line of a large scale channel down pattern, which has guided the GBP/JPY lower since the middle of October. In addition, note the support of the weekly S1 at 149.93.
Meanwhile, a potential recovery of the GBP/JPY might encounter resistance in the 50-hour simple moving average above the 151.00 level.
AUD/USD Passes Support Zone
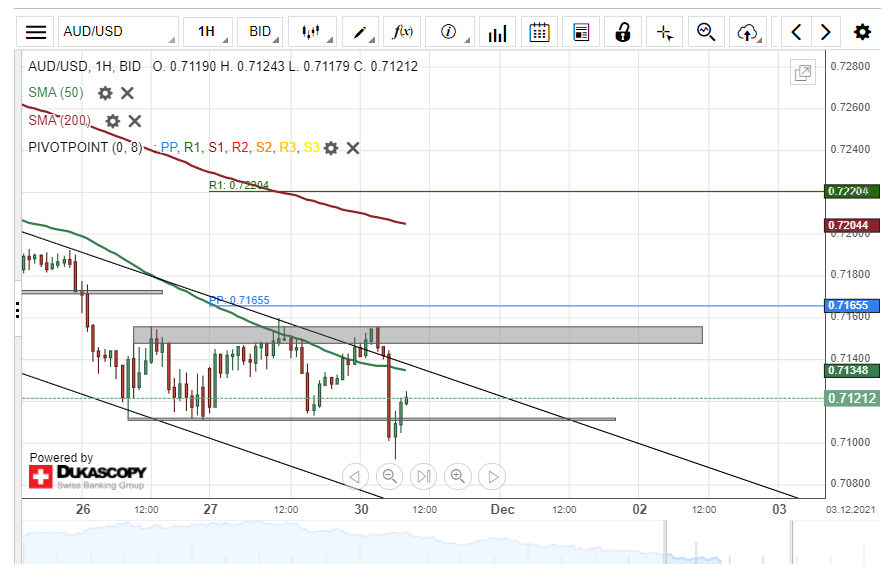
As the AUD/USD currency pair continued to trade in the range between the support of 0.7110 mark and the 0.7148/0.7156 zone, it broke the channel down pattern's upper trend line. However, the event did not result in a surge, as the 0.7148/0.7156 zone provided enough resistance to the pair for a decline to start. By the start of Tuesday's European trading session, the pair had reached below the support of the 0.7110 mark.
A continuation of the decline of the AUD/USD would most likely result in the rate reaching the combined support of the weekly S1 simple pivot point at 0.7058 and the 0.7050 mark. Below these levels, support might be found in the weekly S2 simple pivot point and the 0.7000 mark.
However, in the case of the pair recovering from the 0.7100 and 0.7110 levels, the AUD/USD might once again test the resistance of the 0.7148/0.7156 zone. Above the zone, note the weekly simple pivot point at 0.7166.