Sample Category Title
Elliott Wave Analysis: EUR/USD And GBP/USD Eye More Downside
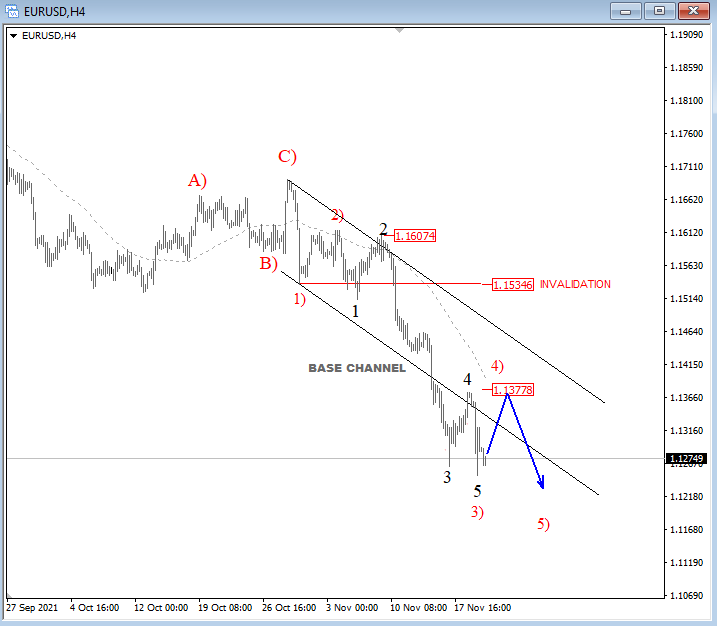
EURUSD is coming much lower with an extended and accelerating price action away from 1.1607 that looks like an impulse so we are aware of more downside after rallies. Ideally, another bounce will show up in the near future, a red wave 4) back to 1.1377 resistance from where we can expect another sell-off as part of ongoing sub wave D) within a triangle from a daily chart.
EUR/USD 4h Elliott Wave analysis
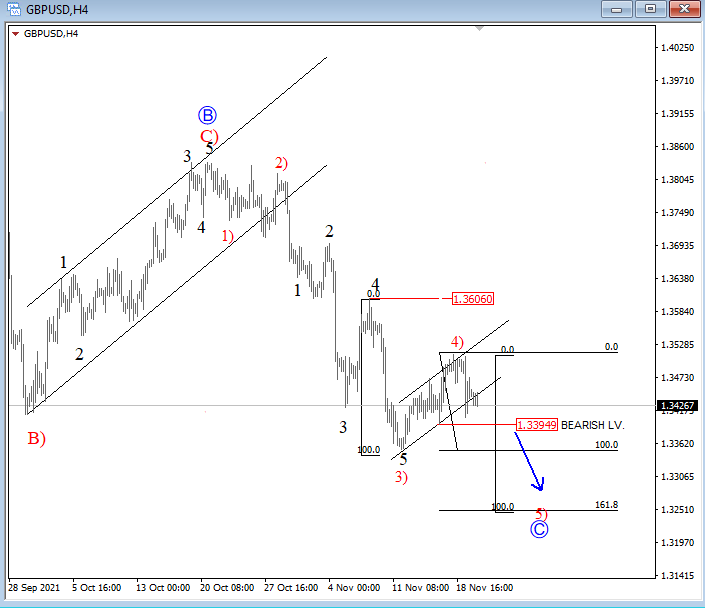
GBPUSD is sharply down again in the 4-hour chart after a slow corrective recovery, which we ideally still see it as wave 4) correction that can send the price back to lows, probably for the final wave 5) of C. Break below 1.3394 makes a room for 1.3300.
GBP/USD 4h Elliott Wave analysis
Surging COVID-19 Infections Weigh On The Euro
The single currency is struggling to find support, having fallen more than 7.5% so far in 2021. The euro is now the second worst-performing currency after the Japanese Yen, and the fourth wave of Covid-19 infections is adding to its losses.
Just when we thought that Covid-19 risks were behind us, Europe became the new epicenter of the pandemic. Austria is the first country to reimpose a full lockdown starting today, with further curbs expected to come into force in other European countries.
The Netherlands and Germany have also seen a rapid increase in cases, with the current German acting health minister warning of a full lockdown. Meanwhile, Italy, Greece, Slovakia, and Belgium began imposing new restrictions, especially on the population who are unvaccinated.
Business activity on the continent is already suffering from supply chain disruptions and high costs, and adding further Covid-19 restrictions will only exacerbate these issues. As a result, the upcoming purchasing managers’ index survey released on Tuesday is expected to paint a gloomy picture of Europe’s economy. The PMI index for manufacturing is projected to decline to 57.2 from 58.3 and the services index is expected to fall by a similar margin to 53.6. Investors will be monitoring Germany’s data closely, where record infection numbers are anticipated to put more pressure on business activity.
Shorting the euro on rallies should remain the preferred trading strategy in currency markets, especially with several Fed officials signaling the possibility of a faster taper when the FOMC meets in December.
The Federal Reserve’s preferred measure of inflation, the PCE price index, will be released on Wednesday and traders will be watching it very closely as consumer prices earlier this month showed US inflation rose at its fastest pace in 30 years. If the PCE data surprises to the upside, the case for faster tapering will grow, as will the argument for hiking interest rates sooner.
Markets are now anticipating a 59% chance of three or more rate hikes by the end of 2022, compared to 44% a month ago, according to CME FedWatch tool. These probabilities are likely to change after Wednesday’s PCE release. Given the low liquidity in a holiday-shortened trading week due to US Thanksgiving on Thursday, expect volatility to pick up in FX if we see big deviations in data from current expectations.
Euro Crashes Against Sterling As BoE And ECB Divergence Widens
The euro declined on Monday morning as investors remained concerned about rising covid-19 cases in Europe. Recent data show that the number of cases has jumped in several countries like Germany, Netherlands, and Austria. Germany has already threatened to announce more restrictions. Austria also started a controversial new lockdown as thousands protested in Vienna over the weekend. The euro has also declined as investors remain concerned about the divergence between the ECB and the Fed. In a statement on Friday, Christine Lagarde reiterated that the bank will not hike interest rates in 2022.
Global stocks were relatively unchanged in the morning session as concerns about the fourth wave of the pandemic in Europe continued. Stocks also declined as the rising tensions between Russia and Ukraine rose. In a statement during the weekend, Ukraine asked the US for more military help as the likelihood of an invasion rose. At the same time, France warned about grave consequences if Russia manages to invade the country. In the past few weeks, Russia has increased its presence near its border with Ukraine. Stocks also reacted to the rising dealmaking. During the weekend, KKR announced that it would acquire Telecom Italia. The deal is being valued at about 7.5 billion euros.
The economic calendar will have minimal events today. Markit, the global data company, will publish the latest flash manufacturing and services PMI data from the UK. These numbers will come two days after the ONS published strong UK retail sales data. Meanwhile, in the US, the main data to watch will be existing home sales numbers. Analysts expect the data to show that its existing home sales data rose to more than 6.2 million in October. Other key events to watch this week will be the US new home sales, durable goods orders, and GDP numbers.
GBPUSD
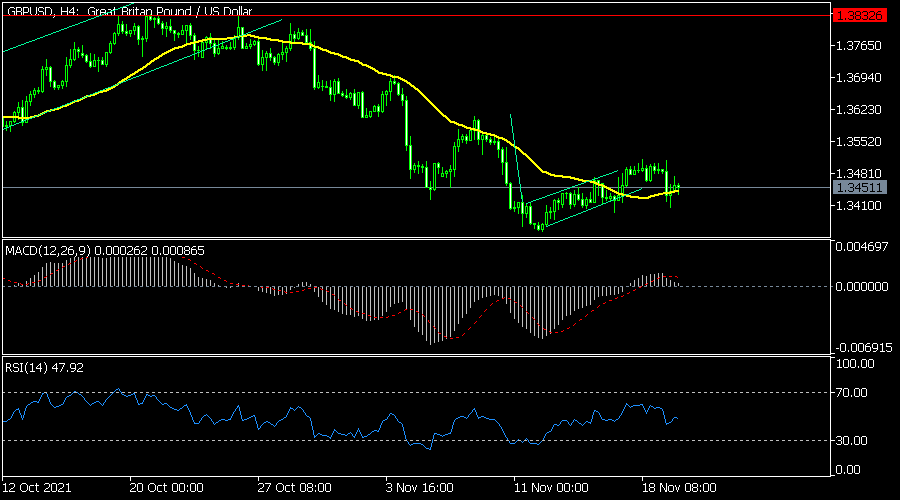
The GBPUSD pair has been relatively unchanged in the past few days. This is unlike other currency pairs like the EURUSD that have dropped sharply. This performance is mostly because of the strong data from the UK and US. The pair is trading at 1.3445, which is a few points below last week’s high of 1.3512. It has also formed a bearish flag pattern. It is also slightly below the 25-day moving average. Therefore, the pair will likely break out lower this week.
EURUSD
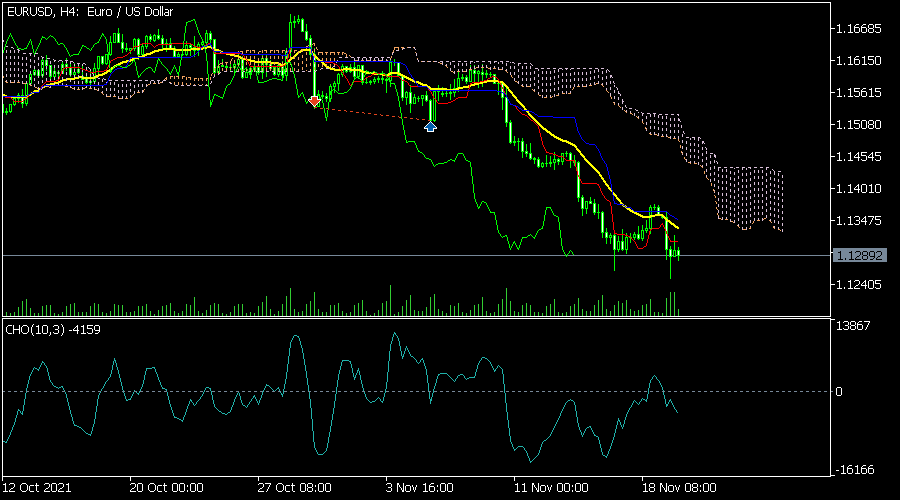
The EURUSD has fallen sharply recently. This month alone, it has dropped by more than 3.5%. The pair has also moved below the 25-day moving average. It has also crossed the important support level at 1.1300. Most importantly, it is below the Ichimoku cloud. Therefore, the pair will likely keep falling as bears target the key support at 1.1200.
EURGBP
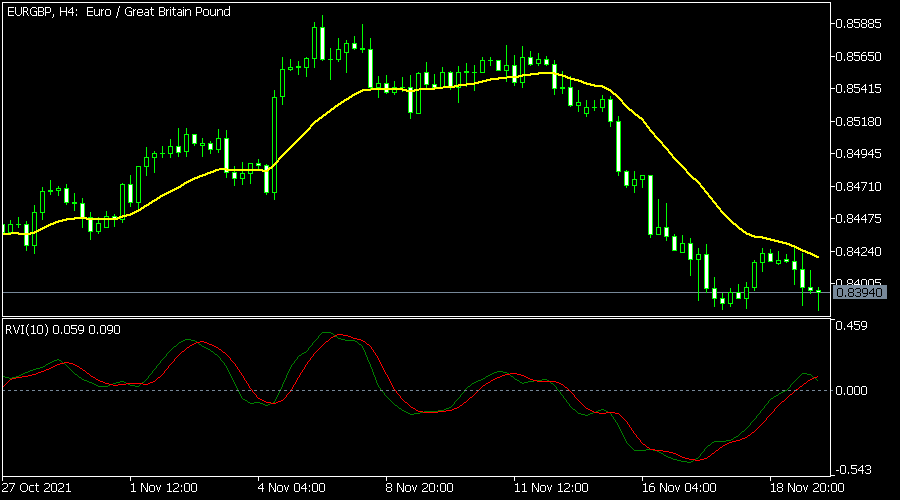
The EURGBP pair has been in a major sell-off lately. It is currently hovering near its lowest level in 21 months. As a result, the Relative Strength Index (RSI) has moved below the 25-day moving average. It has also dropped below the important support at 0.8400. Therefore, like the EURUSD pair, it will likely continue falling as the divergence between the ECB and BOE widens.
AUD/USD Daily Report
Daily Pivots: (S1) 0.7211; (P) 0.7251; (R1) 0.7275; More...
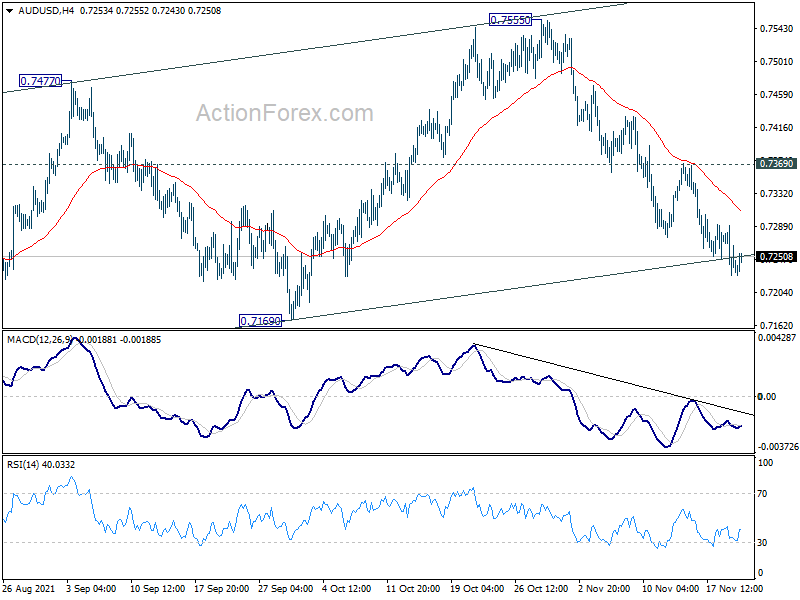
Intraday bias in AUD/USD remains on the downside at this point. As noted before, rebound from 0.7105 is complete with three waves up to 0.7555, and fall from 0.8006 is probably ready to resume. Further fall should be seen to 0.7169 support first. Break will target 0.7105 and below. On the upside, break of 0.7369 resistance is needed to indicate short term bottoming. Otherwise, outlook will stay mildly bearish in case of recovery.
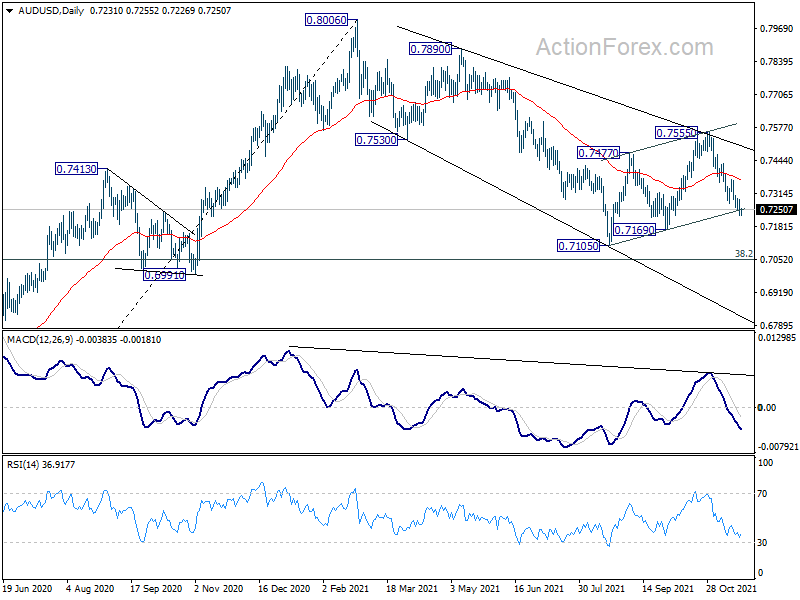
In the bigger picture, with 0.6991 cluster support (38.2% retracement of 0.5506 to 0.8006 at 0.7051) intact, we're seeing price action from 0.8006 as a correction only. That is, up trend from 0.5506 low would resume after the correction completes. In that case, main focus will be 0.8135 key resistance (2018 high). Sustained break there will carry larger bullish implications. However, sustained break of 0.6991 will argue that the whole medium term trend has indeed reversed.
USD/CAD Daily Outlook
Daily Pivots: (S1) 1.2599; (P) 1.2631; (R1) 1.2676; More...
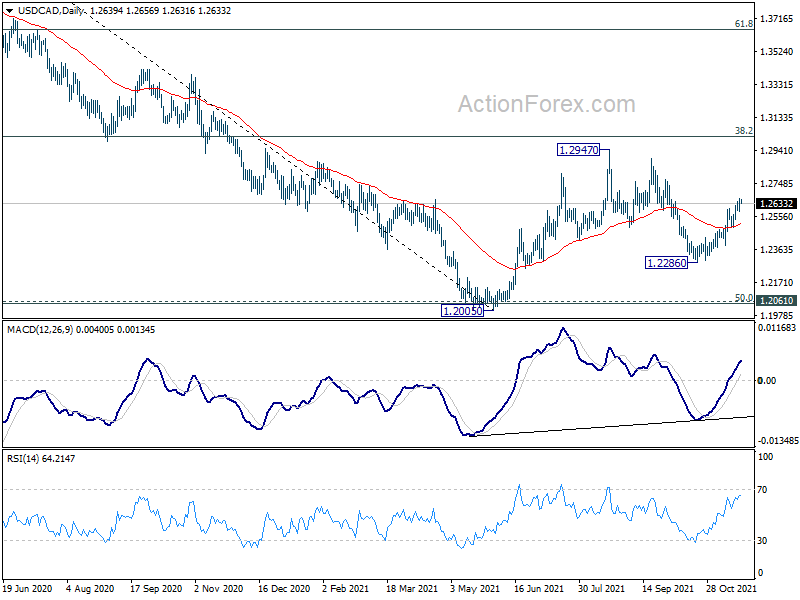
Intraday bias in USD/CAD remains on the upside at this point. Rise from 1.2286 should target a test on 1.2894/2947 resistance zone. On the downside, break of 1.2491 support is needed to indicate completion of the rise. Otherwise, near term outlook will stay mildly bullish in case of retreat.
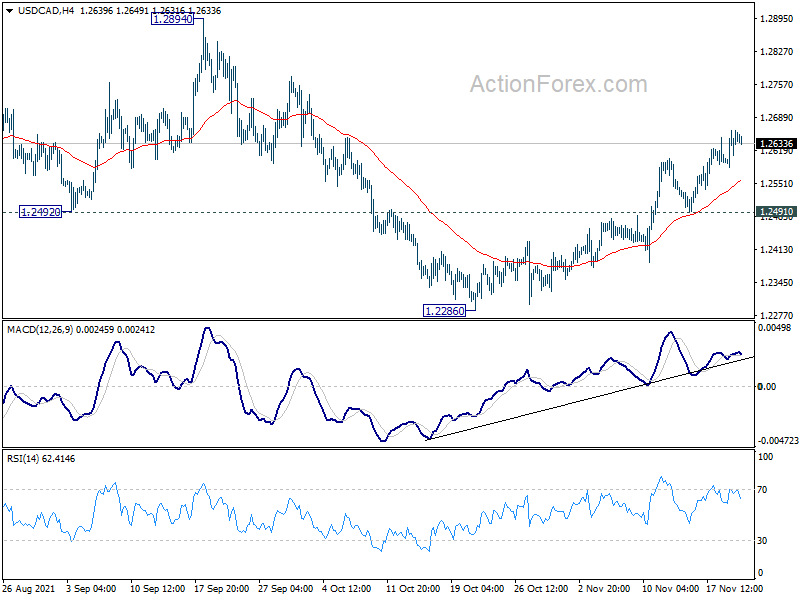
In the bigger picture, medium term outlook is neutral for now. The pair drew support from 1.2061 cluster and rebounded. Yet, upside was limited below 38.2% retracement of 1.4667 to 1.2005 at 1.3022. On the upside, firm break of 1.3022 should affirm the case of medium term bullish reversal. However, break of 1.2286 will turn focus back to 1.2005 low again.
EUR/USD Daily Outlook
Daily Pivots: (S1) 1.1231; (P) 1.1302; (R1) 1.1354; More...
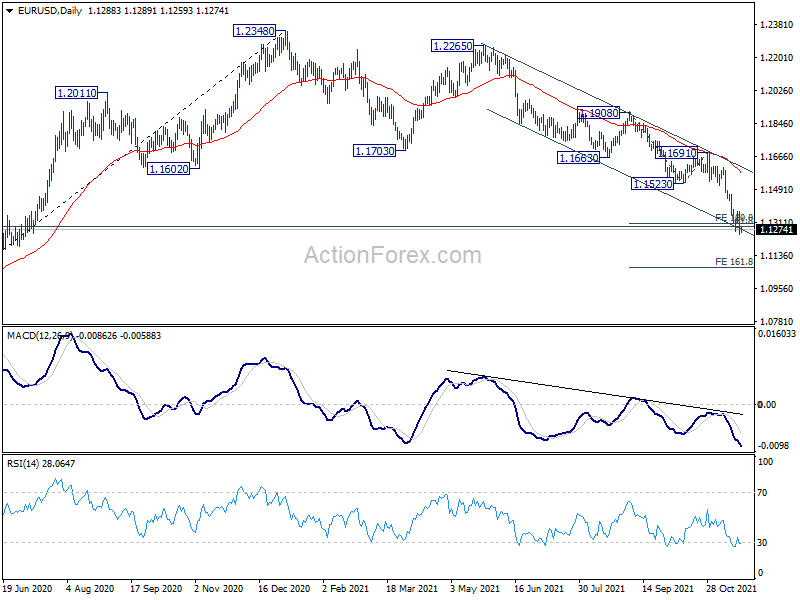
Intraday bias in EUR/USD remains neutral for the moment. On the downside, break of 1.1249 and sustained trading below 1.1289 long term fibonacci level will carry larger bearish implications. Deeper fall would then be seen to 161.8% projection of 1.1908 to 1.1523 from 1.1691 at 1.1068 next. Nevertheless, break of 1.1384 minor resistance will now indicate short term bottoming, and turn bias back to the upside for rebound.
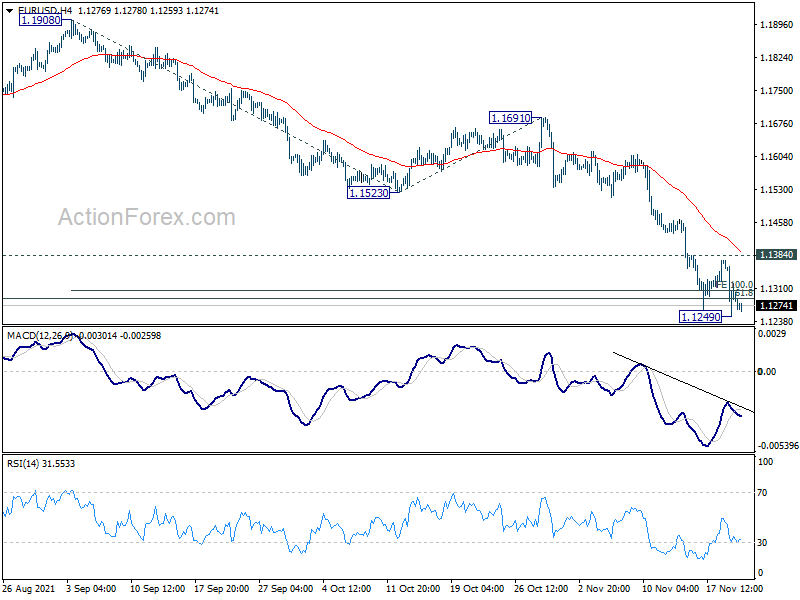
In the bigger picture, there are various ways of interpreting the fall from 1.2348 (2021 high). It could be a correction to rise from 1.0635 (2020 low), the fourth leg of a sideway pattern from 1.0339 (2017 low), or resuming long term down trend. In any case, outlook will now stay bearish as long as 1.1703 support turned resistance holds. Sustained break of 61.8% retracement of 1.0635 to 1.2348 at 1.1289 would pave the way back to 1.0635.
GBP/USD Daily Outlook
Daily Pivots: (S1) 1.3399; (P) 1.3454; (R1) 1.3501; More...
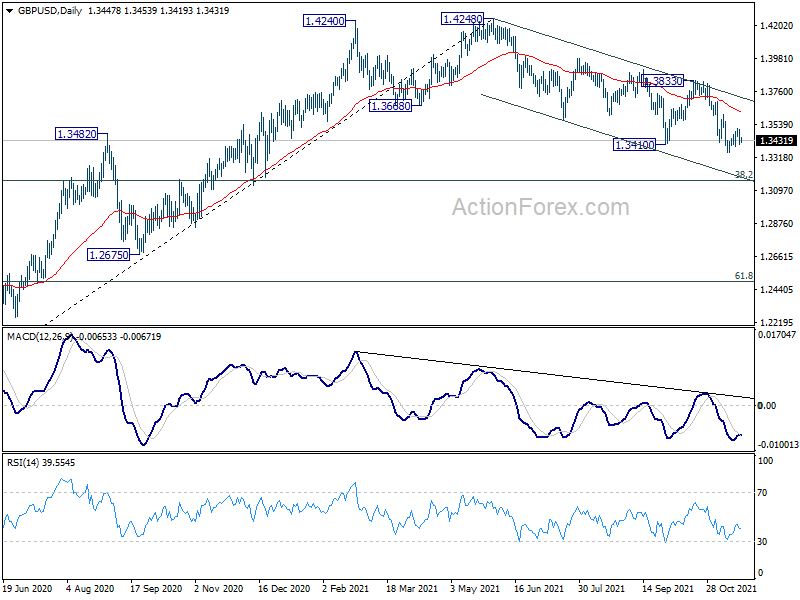
Intraday bias in GBP/USD remains neutral for consolidation above 1.3351. In case of another recovery, upside should be limited below 1.3606 resistance. On the downside, break of 1.3351 will extend the decline from 1.4248 to 1.3164 fibonacci level next.
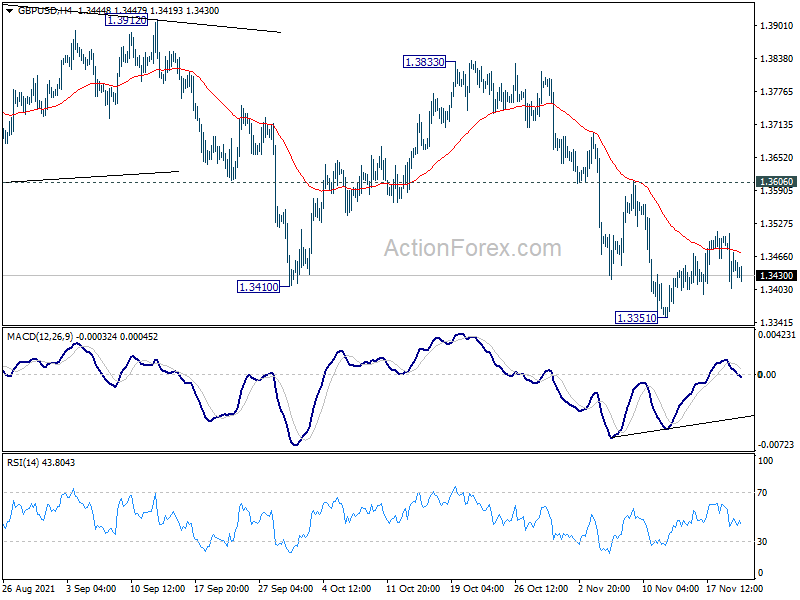
In the bigger picture, the structure of the fall from 1.4248 suggests that it's a correction to the up trend from 1.1409 (2020 low) only. While deeper fall cannot be ruled out yet, downside should be contained by 38.2% retracement of 1.1409 to 1.4248 at 1.3164, at least on first attempt, to bring rebound. On the upside, firm break of 1.4376 key resistance (2018 high) will add to the case of long term bullish reversal. However, sustained trading below 1.3164 will revive some medium term bearishness and target 61.8% retracement at 1.2493.
USD/CHF Daily Outlook
Daily Pivots: (S1) 0.9263; (P) 0.9276; (R1) 0.9303; More....
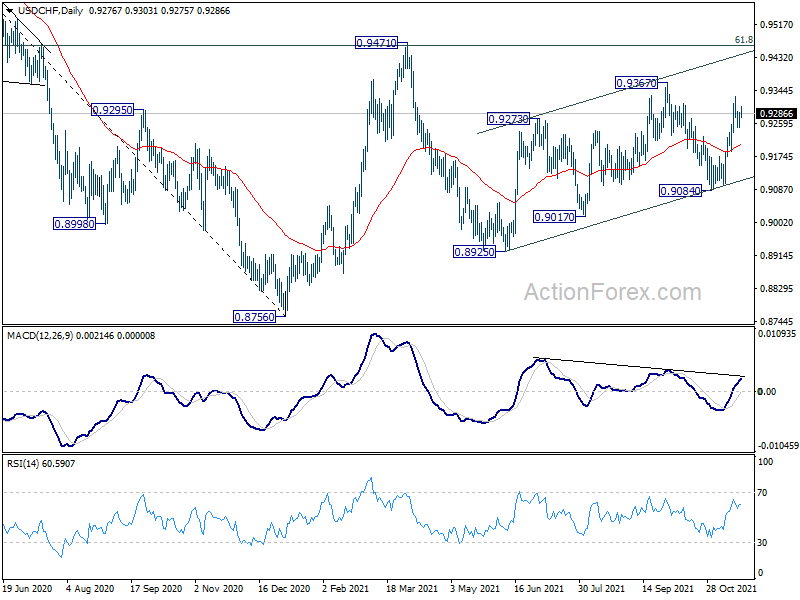
Intraday bias in USD/CHF stays neutral for consolidation below 0.9328 first. On the upside, above 0.9328 will resume the rally from 0.9084 for 0.9367 resistance. On the downside, below 0.9236 minor support will turn intraday bias back to the downside for 0.9084 instead.
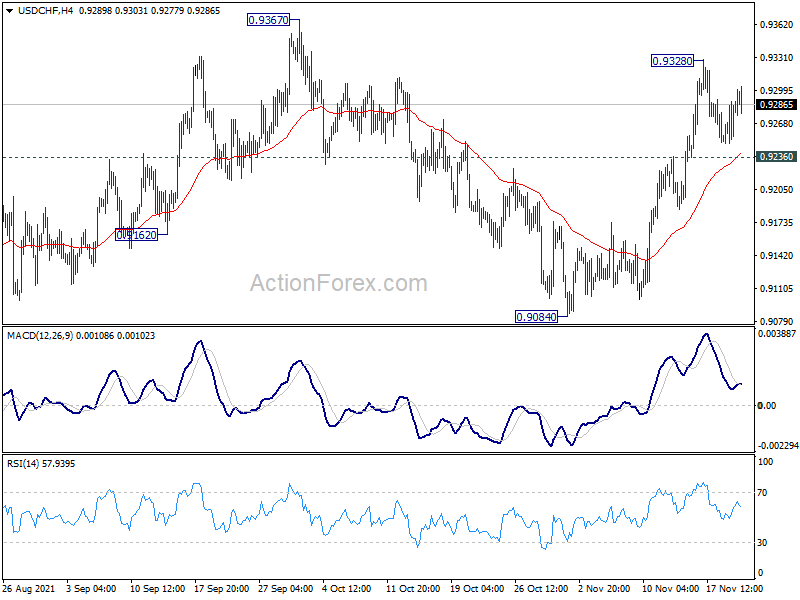
In the bigger picture, the corrective structure of the rebound from 0.8925 argues that fall from 0.9471 is not complete yet. It could either be the second leg of pattern from 0.8756 (2021 low), or resuming larger down trend from 1.0237 (2018 high). We'd pay attention to the downside momentum and assess the odds later. But for now, medium term outlook will be neutral at best as long as 0.9471 resistance holds.
USD/JPY Daily Outlook
Daily Pivots: (S1) 113.56; (P) 114.05; (R1) 114.51; More...
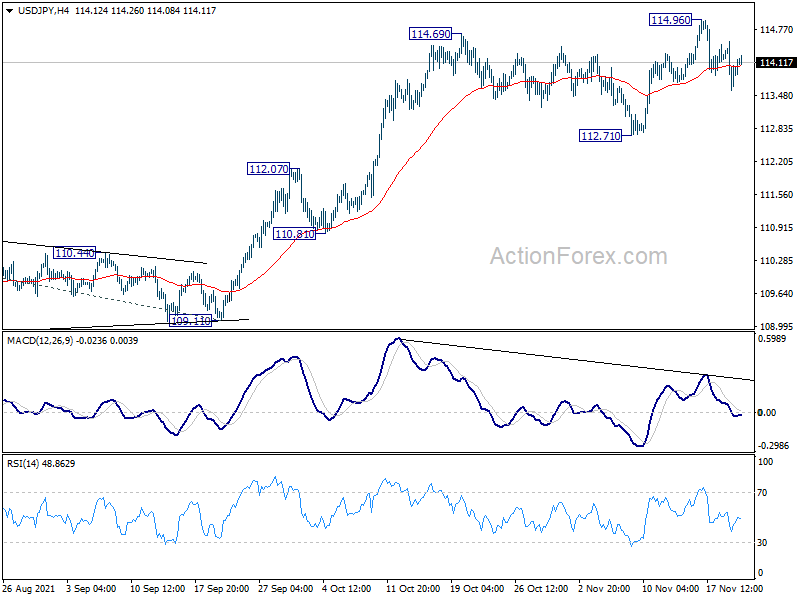
Intraday bias in USD/JPY is turned neutral again with today's recovery. For now, break of 114.96 is needed to confirm up trend resumption. Otherwise, outlook will be neutral for more corrective trading first. As long as 112.71 support holds, such consolidation should be relatively brief. However, firm break of 112.71 will bring deeper correction back towards 111.65 resistance turned support.
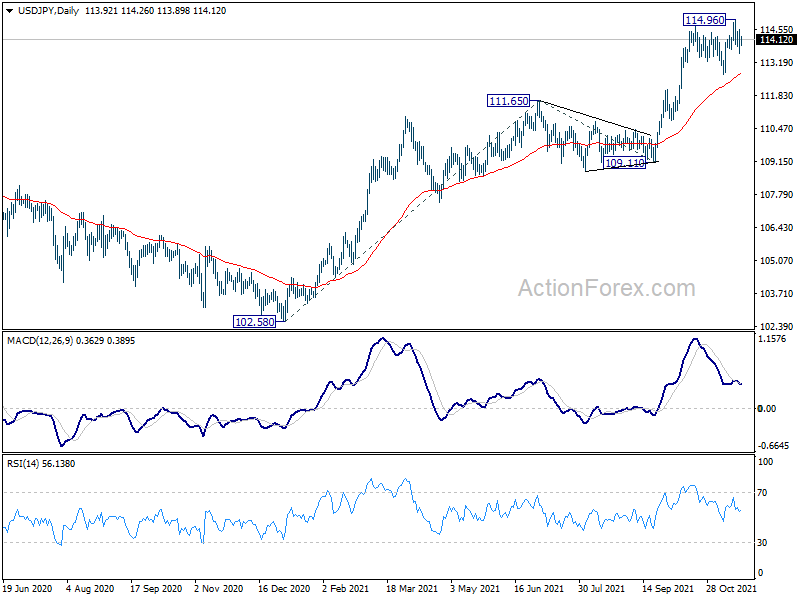
In the bigger picture, corrective decline from 118.65 (2016 high) should have completed at 101.18 already. Rise from the 102.58 is seen as the third leg of the up trend from 101.18. Next target is 118.65 high. This will now be the preferred case as long as 111.65 resistance turned support holds, even in case of deep pull back.
Daily Technical Analysis
Daily Technical Analysis
EUR/USD
Current level - 1.1273
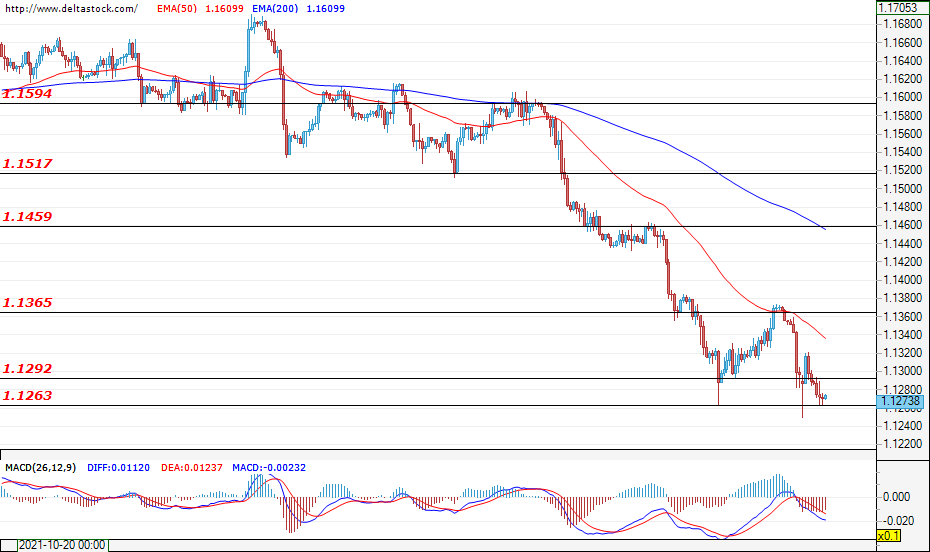
During the past week, the European single currency continued to shed from its value against the U.S. dollar. The bulls managed to limit the sell-off to slightly above the support level of 1.1263, but the current sentiment remains negative.. Only a successful breach of the resistance zone of 1.1365 could be a prerequisite for an additional appreciation of the euro and a test of the next significant level of 1.1459, all of which would signal that the downtrend might be over. This week, investors will focus on the new home sales (Monday; 15:00 GMT) and the initial jobless claims data for the U.S. (Wednesday; 13:30 GMT).
| Resistance | Support | ||
| intraday | intraweek | intraday | intraweek |
| 1.1300 | 1.1460 | 1.1260 | 1.1200 |
| 1.1365 | 1.1517 | 1.1200 | 1.1180 |
USD/JPY
Current level - 114.13
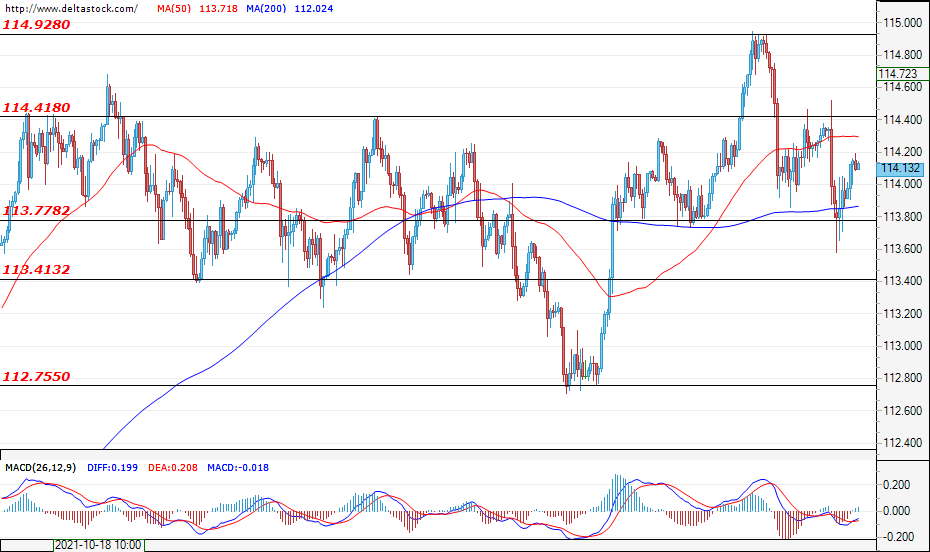
The test of the support of 113.77 was unsuccessful as the dollar recovered some of its recent losses against the yen and, during the early hours of today`s trading, the pair is trading just below the resistance of 114.40. If the bears re-enter the market and manage to violate the mentioned support, the decline should continue towards the zone of 113.40. The first target for the bulls is the level of 114.40, followed by the resistance of 114.90.
| Resistance | Support | ||
| intraday | intraweek | intraday | intraweek |
| 114.41 | 115.50 | 113.77 | 113.40 |
| 114.92 | 117.00 | 113.40 | 112.75 |
GBP/USD
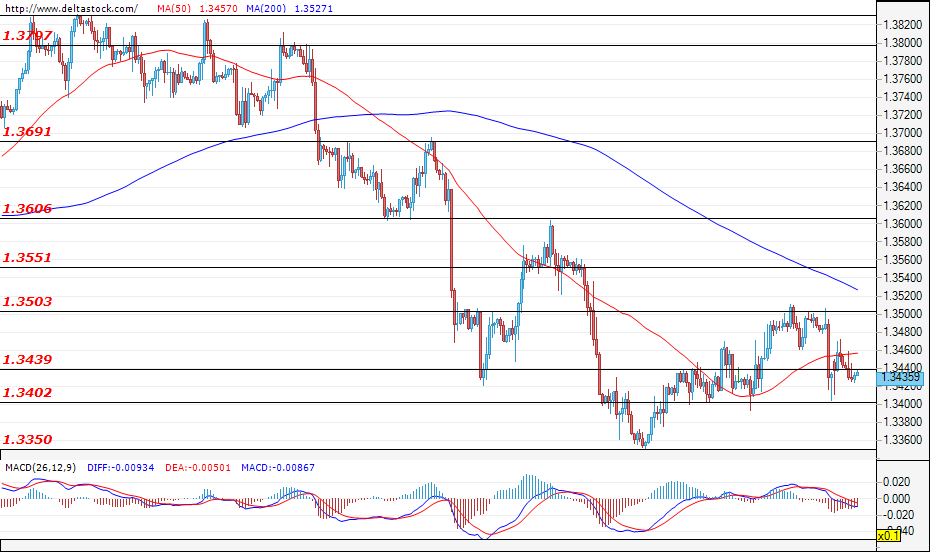
Current level - 1.3435
The bulls couldn’t manage to breach the resistance at 1.3500 and the consolidation still continues in the interval between 1.3400 and 1.3500. The expectations for today’s trading session are for the pair to test the support at 1.3350. If this level is breached, then a downward movement towards the next support at 1.3300 would be the most probable scenario. At the time of writing, a short-lived bullish offensive towards 1.3500 before the sell-off continues still cannot be excluded.
| Resistance | Support | ||
| intraday | intraweek | intraday | intraweek |
| 1.3500 | 1.3600 | 1.3440 | 1.3350 |
| 1.3550 | 1.3690 | 1.3400 | 1.3200 |