Sample Category Title
Daily Technical Analysis
EUR/USD
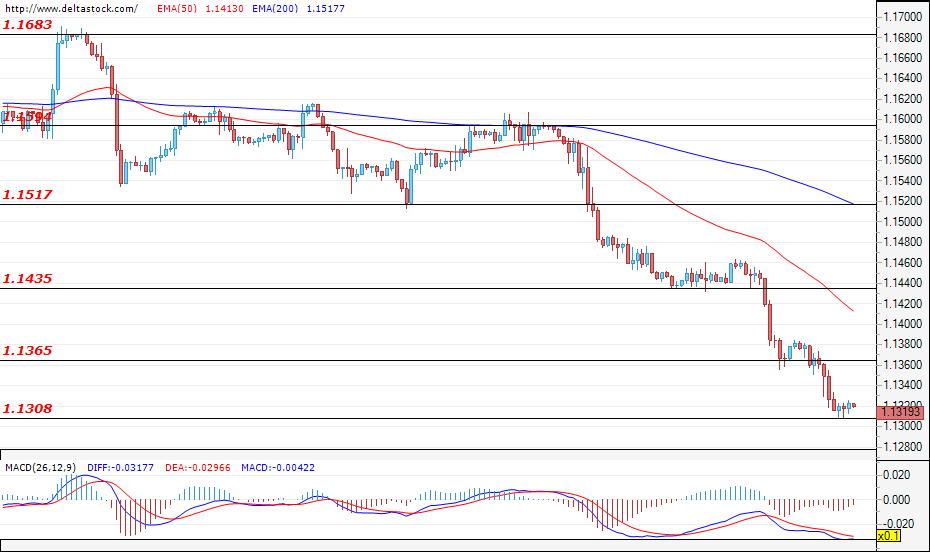
Current level - 1.1319
The dollar continues to appreciate against the common European currency as it violated yet another support level – the one of 1.1365. The sentiment is strictly negative and the expectations are for the pair to test and breach the local bottom at 1.1310, which would pave the way towards the next support at 1.1260. After the sharp decline, it is possible that we could witness a corrective move, which would be limited below the resistance level of 1.1435. The data on the building permits for the U.S., which is to be announced today at 13:30 GMT, is expected to cause a spike in volatility.
| Resistance | Support | ||
| intraday | intraweek | intraday | intraweek |
| 1.1365 | 1.1600 | 1.1310 | 1.1260 |
| 1.1435 | 1.1680 | 1.1260 | 1.1200 |
USD/JPY
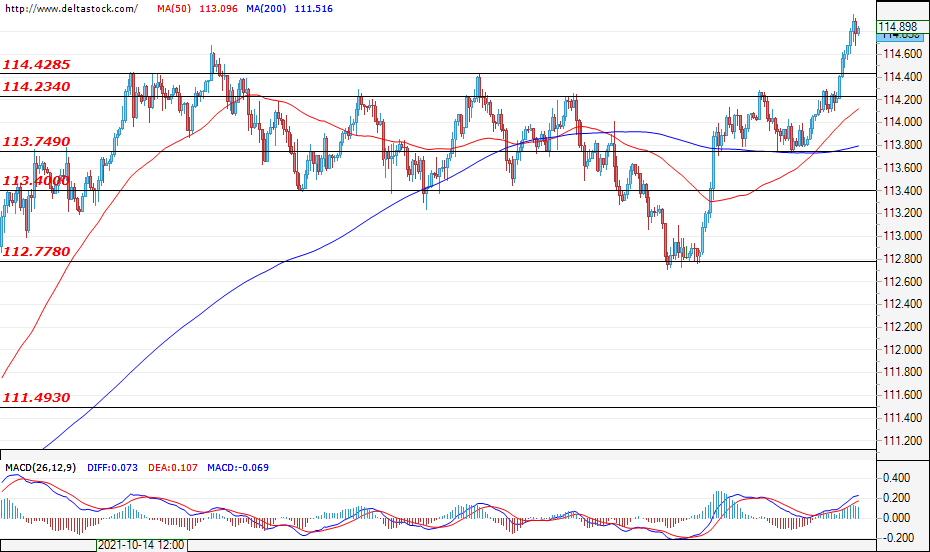
Current level - 114.89
During yesterday's trading session, two consecutive breaches of the support levels of 114.23 and 114.42 ended the range phase for the Ninja and paved the way towards the resistance zone of around 115.50. In the negative direction, the mentioned level of 114.42 is now acting as a support, and the former lower border of the range at 113.40, in which the pair was previously trading, is the major support for the pair.
| Resistance | Support | ||
| intraday | intraweek | intraday | intraweek |
| 115.50 | 115.50 | 114.42 | 112.77 |
| 117.00 | 117.00 | 113.75 | 111.50 |
GBP/USD
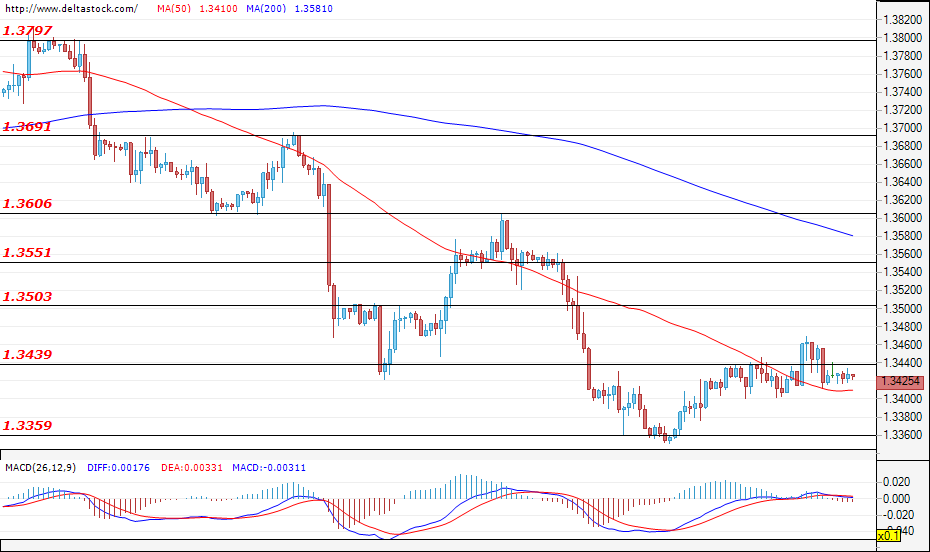
Current level - 1.3425
Following the sharp decline, the Cable entered a consolidation phase and is trading in the narrow range between 1.3359 and 1.3439. Only a confirmed breach of either of the borders of the range would set the future direction for the pair. However, considering the strong performance of the dollar against most of the other currencies, the most likely scenario is for the Cable to violate the lower border of the range and move towards 1.3290.
| Resistance | Support | ||
| intraday | intraweek | intraday | intraweek |
| 1.3440 | 1.3550 | 1.3360 | 1.3200 |
| 1.3500 | 1.3600 | 1.3290 | 1.3200 |
Central Banks In Focus
Central banks are heavily in focus on Wednesday as we get a bunch of inflation data from across the globe and hear from a number of policymakers whose views on the trend will set the tone for the markets.
Stock markets have been struggling to build on a strong earnings season recently as inflation and interest rates have topped the list of investors concerns over the coming months. Given how long that list has become and the other risks on it, that's saying something.
Gone are the days when bad news (data) is good news and central bank inaction keeps the party going in equity markets. Investors are increasingly concerned about the levels of inflation that we're seeing and how widespread it is.
That's not to say they all believe it's here to stay and that extreme levels are just around the corner, but the higher the numbers get, the more widespread it becomes and the longer it lasts, the greater the risk. Which is going some way to dampening the good vibes from earnings season which gave the impression that the economy is on a strong trajectory.
Sterling pops as UK inflation piles pressure on BoE
The pound has popped higher on the back of the UK inflation figures this morning, which were higher across the board and surpassed expectations. Inflation rising to 4.2% from 3.1% and core up to 3.4% from 2.9% doesn't make for easy reading, particularly for BoE policymakers that have backed themselves into a corner in recent months.
With the furlough scheme having seemingly come to a successful end without any significant jump in unemployment, as per the data yesterday and comments earlier this week, and inflation running hotter than expected, the MPC may have run out of excuses. There will be another labour market and inflation report next month in the days before the meeting but I struggle to see how policymakers can get out of this one.
Oil slipping ahead of EIA report
Oil prices are slipping a little again but continue to hold above the early November lows which is increasingly becoming a key level of support. A move below here - roughly $78 in WTI, $80 in Brent - could see a much deeper correction on the cards.
While the market remains fundamentally bullish, there are more reasons for caution at these levels which may be driving the pullback we've seen. Whether that be slower growth this quarter, lower oil demand forecasts from OPEC or the risk of an SPR release in the US. Traders have been given reason to lock in some profits after an extraordinary run.
There was nothing extraordinary about the API release on Tuesday, which showed a slightly lower inventory build than expected. The market popped slightly but quickly gave these gains back and proceeded to pare earlier gains ahead of the release. EIA is expected to report a similar gain of around one million barrels later today.
Gold in retreat ahead of Fed speak
Gold was in retreat on Tuesday after US yields and the dollar popped higher in response to the bumper US retail sales report. The yellow metal fell a little shy of $1,780 before turning lower and giving back around 1.5%. The rally had been losing momentum in the run-up to the report so it perhaps came at just the right time, allowing for some profit-taking to kick in and a decent correction.
The question now is how eager traders will be to buy the dips given how favoured the yellow metal has been as an inflation hedge. There is a lot of Fed speak to come today which will likely have a big say in whether we're eyeing a run at $1,900 or a larger pullback. The yellow metal has found some support around $1,850 so far but the big test may be $1,833 where it saw such strong resistance prior to last week's breakout.
A logical correction for Bitcoin?
Bitcoin is continuing to come under pressure this week and the correction could become more severe if we see a break of $58,000. This is roughly where it found strong support at the end of October and given how much it's struggled to make major strides higher since, it could be the catalyst for a deeper correction.
There's been lots of good news for bitcoin recently, be that the launch of ETFs or the Taproot upgrade and I wonder whether we're now just seeing some profit-taking on those events. Both were expected, both were priced in, in advance, and with prices at record highs, it would be logical for some price correction to happen. Although that's not always how this space works, as we've seen so often.
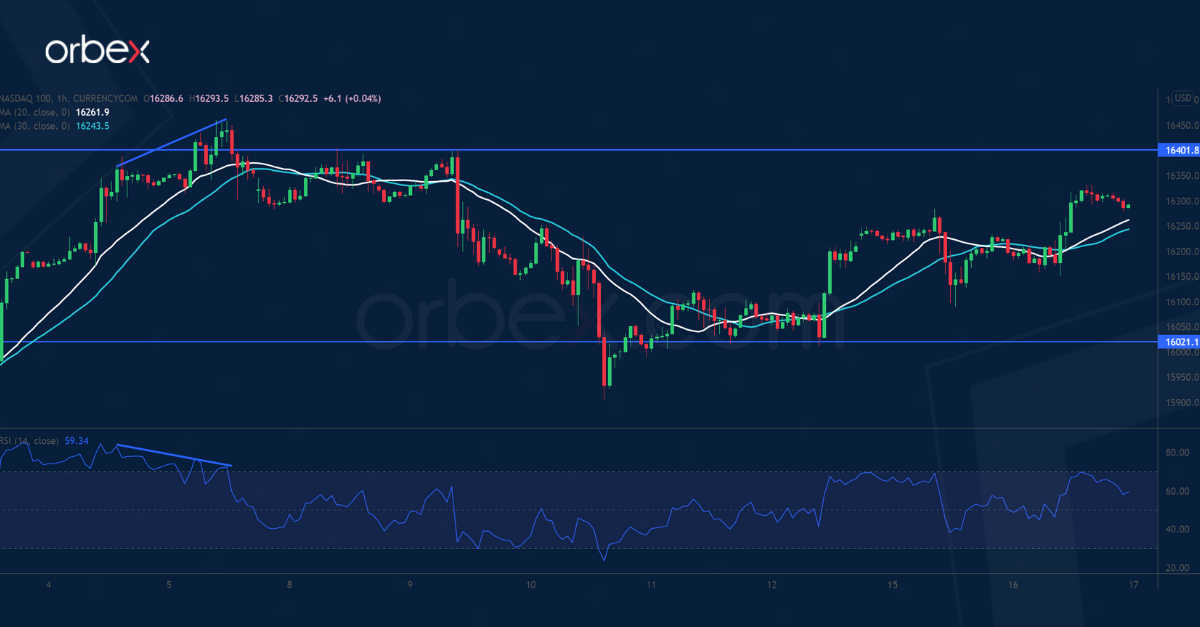
NAS 100 Tests Peak
The Nasdaq 100 bounces back supported by robust tech earnings.
The index showed exhaustion after a four-week-long bull run. A combination of an overbought RSI and its bearish divergence made traders cautious in buying into high valuations.
A break below the psychological level of 16000 has triggered a wave of profit-taking. A deeper retreat below 16020 would send the index to the previous peak at 15700 which coincides with the 30-day moving average.
On the upside, A rally above 16400 would resume the uptrend.
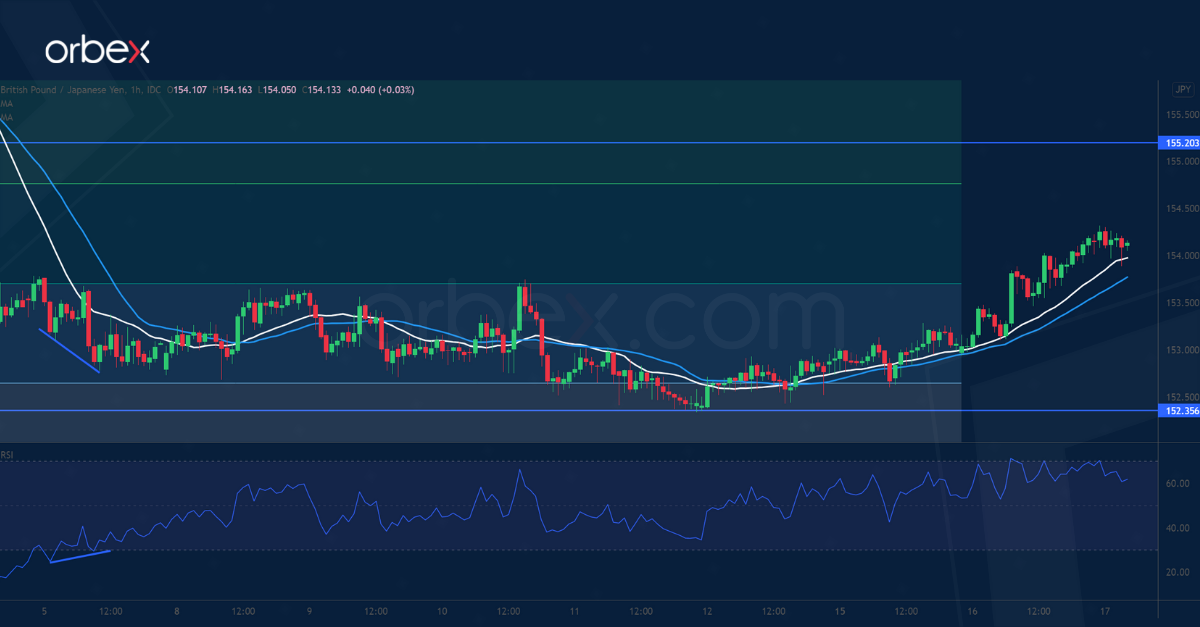
GBP/JPY Attempts To Rebound
The sterling recouped losses after Britain’s unemployment rate dropped to 4.3%. On the daily chart, the pair saw support near the 61.8% (152.60) Fibonacci retracement of the October rally.
A bullish RSI divergence was a sign that the bearish pressure was fading. A break above 153.60 could be an attempt to turn the mood around.
The initial surge may need more support after the RSI shot into the overbought area. Should the pound stay above 152.35-152.60, a rebound would lift it towards 155.20.
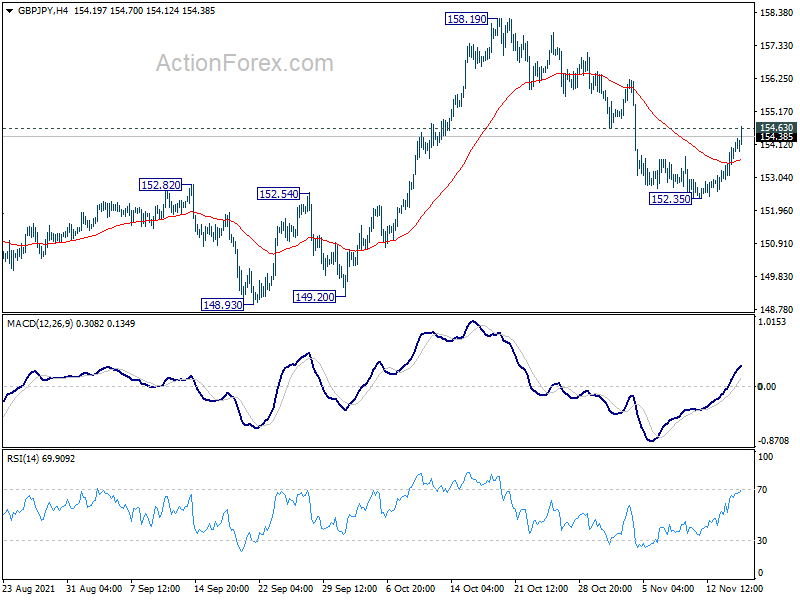
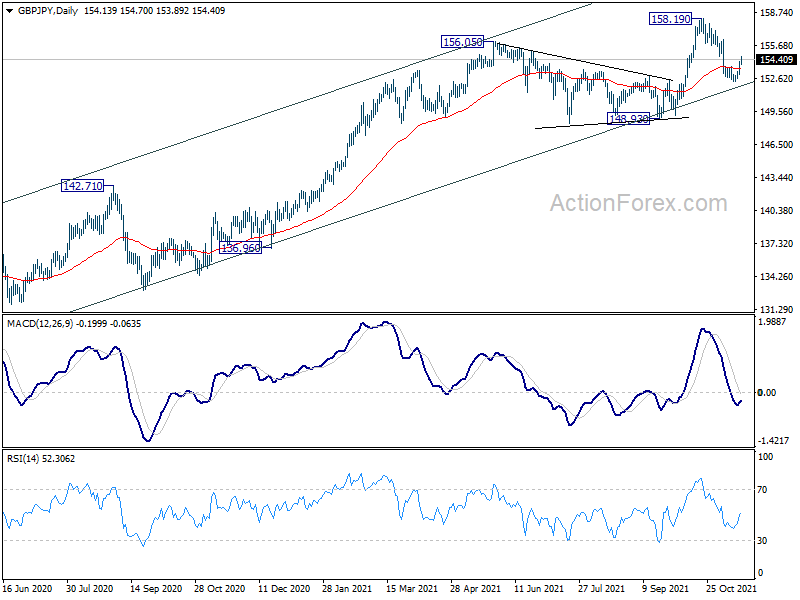
GBP/JPY Daily Outlook
Daily Pivots: (S1) 153.40; (P) 153.80; (R1) 154.56; More...
Intraday bias in GBP/JPY is neutral for the moment with focus on 154.63 minor resistance. Firm break there will argue that pull back from 158.19 has completed. Intraday bias will be turned back to the upside for retesting 158.19 high. On the downside, break of 152.35 will resume the fall towards 148.93 key support instead.
In the bigger picture, rise from 123.94 is seen as the third leg of the pattern from 122.75 (2016 low). The stay above 55 week EMA affirms medium term bullishness. Current rise should now target 61.8% retracement 195.86 (2015 high) to 122.75 at 167.93 next. In any case, outlook will remain bullish as long as 148.93 structural support hold, even in case of deep pull back.
EUR/USD Lacks Support
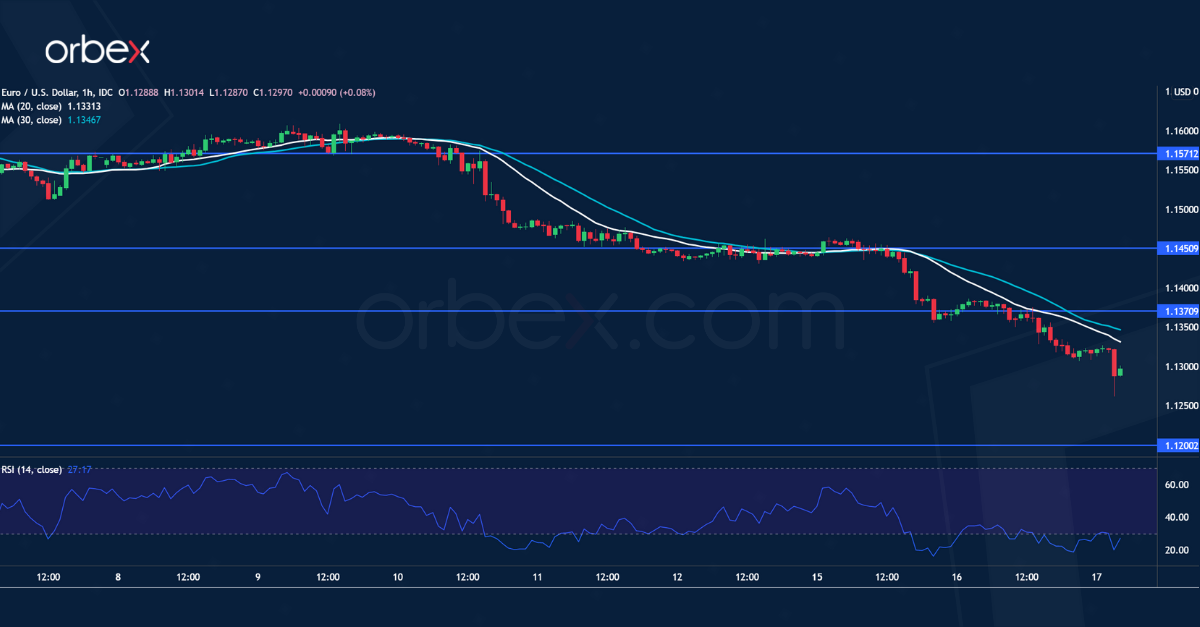
The US dollar inched higher after October’s retail sales beat expectations. There has been a lack of interest in the single currency following its fall below the daily support at 1.1530.
The divergence between the 20 and 30-hour moving averages indicates an acceleration in the sell-off. The bears are targeting the demand zone around 1.1200 from last July.
The RSI’s oversold situation may prompt momentum traders to cover. Though a rebound is likely to be capped by 1.1370 and sellers would be eager to sell into strength.
EUR/JPY Daily Outlook
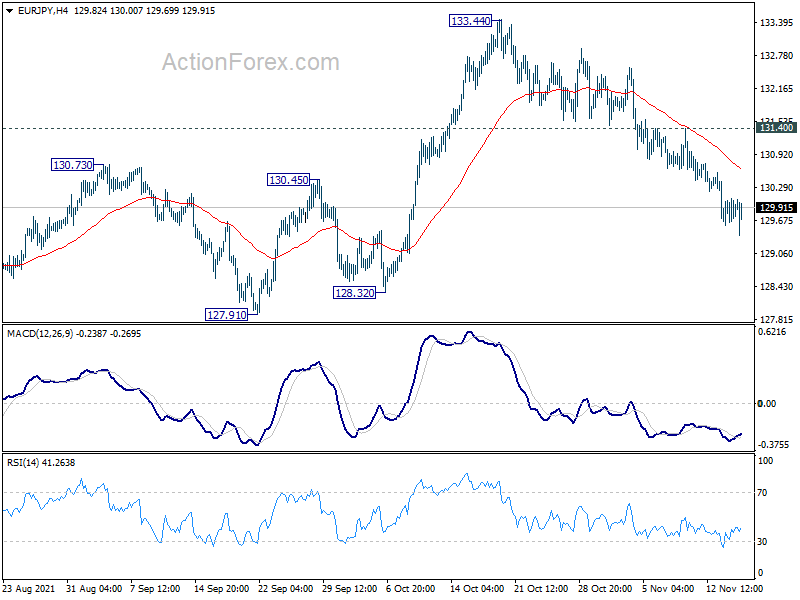
Daily Pivots: (S1) 129.72; (P) 129.92; (R1) 130.17; More....
EUR/JPY is losing some downside momentum as seen in 4 hour MACD. But intraday bias stays on the downside as fall from 133.44 is in progress for 127.92 key support. Firm break there will carry larger bearish implication. On the upside, however, break of 131.40 minor resistance will turn bias back to the upside for stronger rebound, probably back to retest 133.44 high.
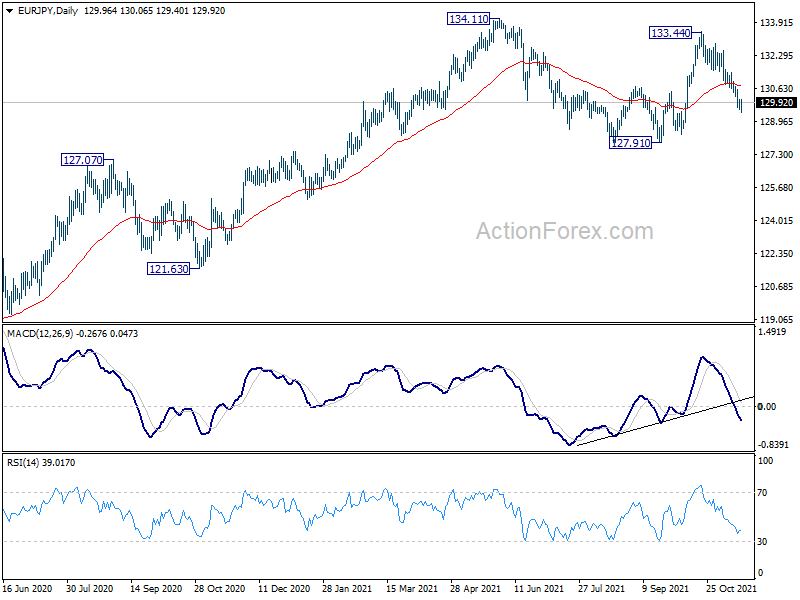
In the bigger picture, rise from 114.42 (2020 low) is still in progress and the strong support support from 55 week EMA affirms medium term bullishness. Further rise would be seen to retest 137.49 (2018 high). Decisive break there will resume the whole long term rise from 109.03 (2016 low). However, sustained break of 127.91 support will argue that a medium term top is formed, and turn outlook bearish for deeper fall.
EUR/USD Hit Important Support At 1.129
Markets
The strong UK labour market report for September with elements that bode well for the month October as well defined European morning trading. This job market resilience is the final missing piece for the BoE to kick off the tightening cycle. The pound strengthened towards the EUR/GBP 2021 lows to finish at 0.8429. UK's yield curve bear flattened with changes varying from 4.2 bps (2y, 5y) to 1.7 bps (30y). US retail sales came in much stronger than expected and took over from the UK labour report as the dominant trading theme in the afternoon. US (real) yields rose 1.3 bps (5y) to 3.6 bps (20y). Hawkish comments from St. Louis Fed Bullard underpinned the UST selloff. He argued to end the tapering faster (in Q1) to have the optionality to hike rates sooner. He also put on the table to start the balance sheet runoff (i.e. not to reinvest proceeds from maturing bonds) immediately after the tapering process instead of waiting a while. Bond yields in Europe in the meantime fell with the German curve bull steepening, seeing the 2y and 5y decline by 4.1 bps and 3.7 bps respectively. The German 10y real yield hit a new alltime low at -2.238%. UST underperformance gave the dollar a clear edge over peers. EUR/USD closed at 1.132, down from 1.137. USD/JPY surpassed recent highs to finish at the highest level since early 2017 (114.82).
Asian equity markets trade generally softer despite the green ending on WS yesterday. The USD grabs the opportunity to extend its winning streak with the DXY testing 96 for the first time since July 2020. EUR/USD hit important support at 1.129 but prevents a break lower for the time being. Core bonds start sideways in a session stripped of important news.
There's an avalanche of speakers scheduled for today that servers as a wildcard for trading since they'll probably contain conflicting views. We'd warn against fighting the current dollar trend. EUR/USD finds itself in a precarious situation. EUR/USD 1.129 has to hold to prevent a return to 1.1163 (March 2020 interim high, June 2020 correction low) followed by 1.10 (76.4% retracement from the March 2020-January 2021 EUR/USD uptrend). The constant pushbacks by ECB officials (eg. Rehn this morning) on policy normalization by stressing the temporary nature of inflation obviously are no help for the euro or European yields either. That's different for the pound, where early investors just received another rude awakening by above-consensus UK CPI. Headline inflation sprinted from 3.1% to 4.1% y/y and core measures coming in at 3.4%, strengthening the BoE's tightening case even further. Sterling gets a boost. EUR/GBP 0.84 is under attack. A sustained break paves the way towards the 2020 lows of 0.8282.
News headlines
US Treasury Secretary Yellen updated House Speaker Pelosi on the Treasury Department's ability to continue to finance the operations of the federal government under constraints of the debt limit. After the small October increase of the latter, Yellen projected that funds would run dry by December 3. She now refined that projection, indicating that the Treasury would be left with insufficient remaining resources to finance the US government beyond December 15. To ensure the full faith and credit of the US, Yellen stresses that it is critical that Congress raise or suspend the debt limit as soon as possible.
Australian wage growth increased by 0.6% Q/Q in Q3 with annual growth coming in at 2.2% Y/Y. That remains below the 3% something threshold put forward by Reserve Bank of Australia governor Lowe as a condition to sustainably lift inflation back in the 2-3% target band. Private (0.6% Q/Q) and public (0.5% Q/Q) sector wage growth was more or less similar with real wages falling by 0.2% Q/Q and 0.8% Y/Y. The Aussie dollar this morning loses out against an overall stronger US dollar with AUD/USD trading below 0.73 for the first time since early October.
US 100 Index Flirting With Record Highs Again
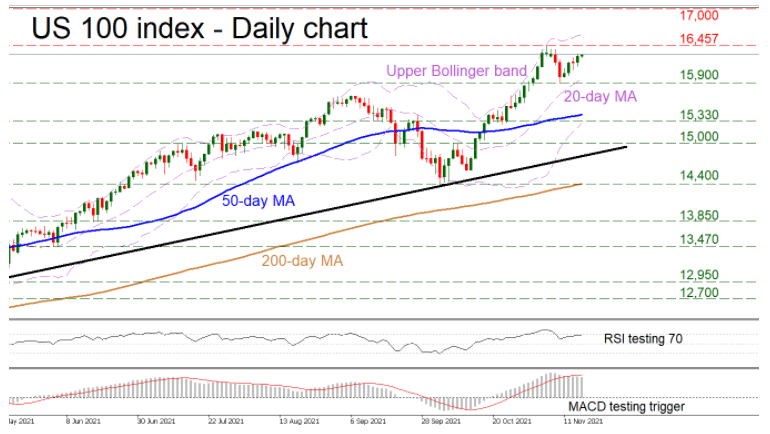
The US 100 cash index came back swinging after the retreat in September, powering higher to reach a new record of 16,457 last week. The picture remains bright overall, with the market trading above all its moving averages (MAs) and an uptrend line drawn from the lows of September 2020.
Short-term oscillators are transmitting mixed messages. The MACD looks ready to cross above its red trigger line, which would be an encouraging signal. However, the RSI is testing its overbought 70 zone, something that typically precedes a pullback in the index.
If buyers remain in charge, their first target will likely be the record high of 16,457. A violation would bring the market into uncharted waters, turning the focus towards round psychological numbers like 17,000 that could provide resistance. Even higher, the bulls might encounter a tougher battle around 17,730, which is the 261.8% Fibonacci extension of the September-October pullback.
Now in case the bears retake control, initial support may be found near the crossroads of the 15,900 zone and the 20-day MA. Sinking lower, the 50-day MA currently at 15,430 could come into play, alongside the neighboring 15,330 barrier. If this area is breached too, all eyes would turn to the intersection of the 15,000 region and the uptrend line.
In short, the technical picture is overwhelmingly positive. For that to change, the sellers would need to punch below the 14,400 low and the 200-day MA.
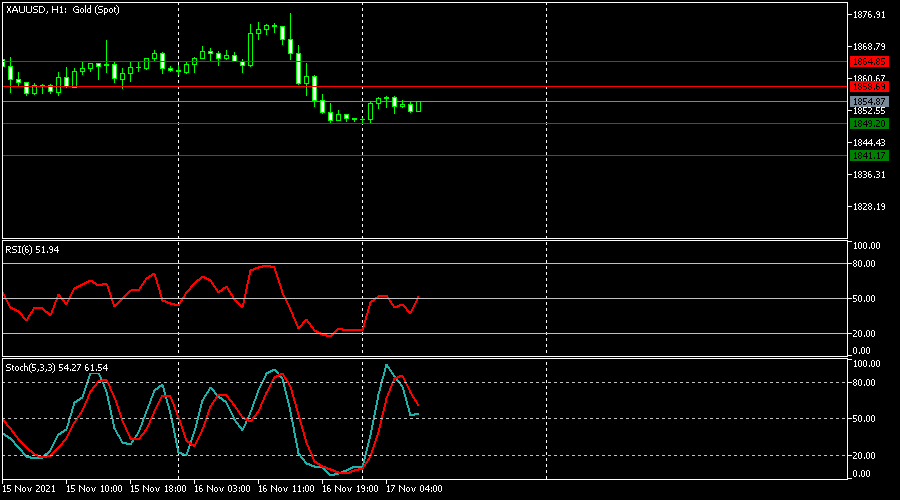
XAUUSD Is Possibly Bullish
Technical analysis
The RSI is above level 50.
The Stochastics is above level 50.
Most likely scenario – BUY
Target prices: 1,858,69 1,864,85
Alternative scenario – SELL
Target prices: 1,849,20 1,841,17
Key levels
Support 1,849,20 1,841,17
Resistance 1,858,69 1,864,85