Sample Category Title
Euro In Freefall As Outlook Dims, Pound Gains On Inflation Jump
- Euro tumbles again as dovish ECB and mounting worries weigh
- Pound modestly higher after UK inflation tops 4%
- Dollar reigns supreme as strong US data run continues
Euro can’t catch a break
The euro is sinking, stretching its week-long slide and breaching the $1.13 level for the first time since July 2020, as investors turn more bearish on the Eurozone outlook. The single currency had already come under heavy selling pressure from last week’s big jump in US inflation, which propelled the dollar higher, but had managed to stabilize before ECB chief Christine Lagarde triggered a fresh wave of selling on Monday.
Lagarde merely repeated what she had communicated on the ECB’s forward guidance on rates at the last policy meeting, but although money markets once again dismissed her remarks, currency traders are having a rethink. Recent economic pointers have generally been much stronger for the United States than for the Eurozone, with inflation also surging at a more alarming rate across the pond than in the euro area.
More worryingly, this comparative underperformance comes even before fresh restrictions have started to kick in across Europe to fight rising Covid infection levels. Austria and the Netherlands recently introduced new measures to contain the latest virus wave, while Germany is also considering tighter curbs.
But there are other headwinds that are causing angst among investors. Natural gas futures in Europe are soaring again amid renewed fears of shortages after Germany suspended the approval of the Nord Stream 2 pipeline that runs under the Baltic Sea to Russia. With oil prices also elevated and winter approaching, Europe’s energy crunch could get much worse, though so far, there’s no sign of Russian supplies being disrupted either due to the German ruling or tensions with Belarus.
The euro was last trading around $1.1315, having earlier brushed an intraday low of $1.1262. Against the pound, the single currency slid to a 21-month trough of 0.8389, while versus the Swiss franc, it fell to an 18-month low of 1.0507.
December rate hike eyed after UK CPI surge
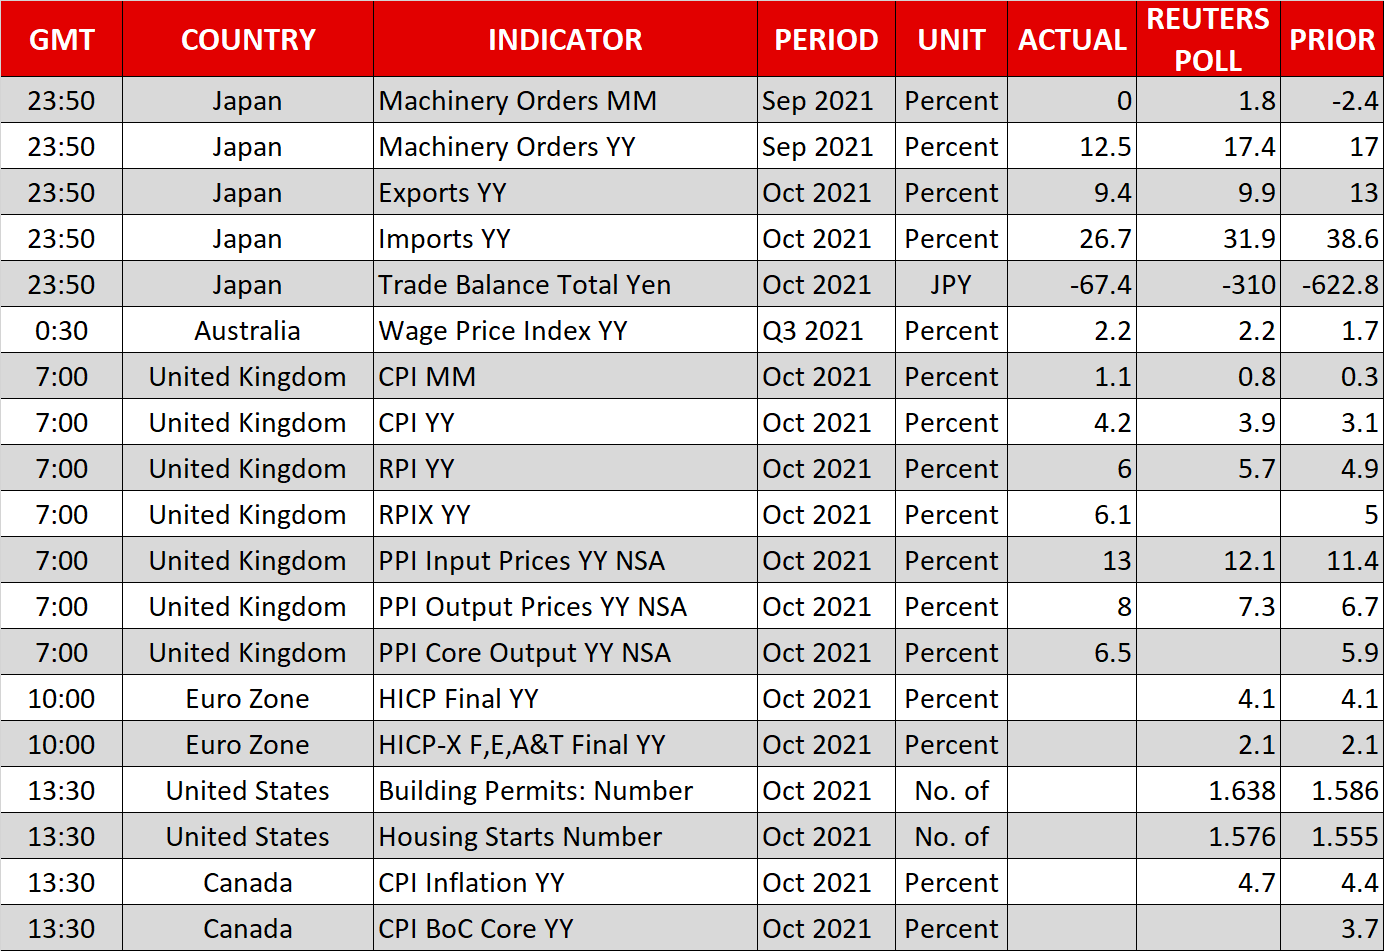
Consumer prices in the UK rose at annual rate of 4.2% in October, likely unsettling some policymakers at the Bank of England. Analysts had forecast inflation to rise to 3.9%. The stronger-than-expected figures come just a day after the robust employment data that showed the UK labour market managed to more than absorb the furloughed workers that were still on government support when the program ended in September, clearing a major hurdle for the BoE to raise rates.
Many would argue that spiralling inflation and a tight jobs market are classic signs of an economy overheating. However, with the spike in inflation being driven mainly by supply-side factors rather than from excess demand, market punters think a premature rate hike would be damaging for the British economy.
However, BoE Governor Andrew Bailey reiterate his ‘unease’ about inflation this week, opening the door to possible action as early as the next meeting in December.
The pound edged higher today, retracing some of yesterday’s pullback to climb to around $1.3430.
Dollar marches on after stellar retail sales report
The US dollar scaled fresh 16-month highs against a basket of currencies on Wednesday, surpassing the 96.0 level, emboldened by yesterday’s impressive retail sales readings, which reinforced the view that US growth is gaining momentum in the fourth quarter.
Treasury yields have also continued inch up, aided by hawkish remarks by St. Louis Fed President James Bullard, who will become a voting member on the FOMC next year.
More Fed speakers are coming up later today, including governors Waller and Bowman and Chicago Fed President Evans.
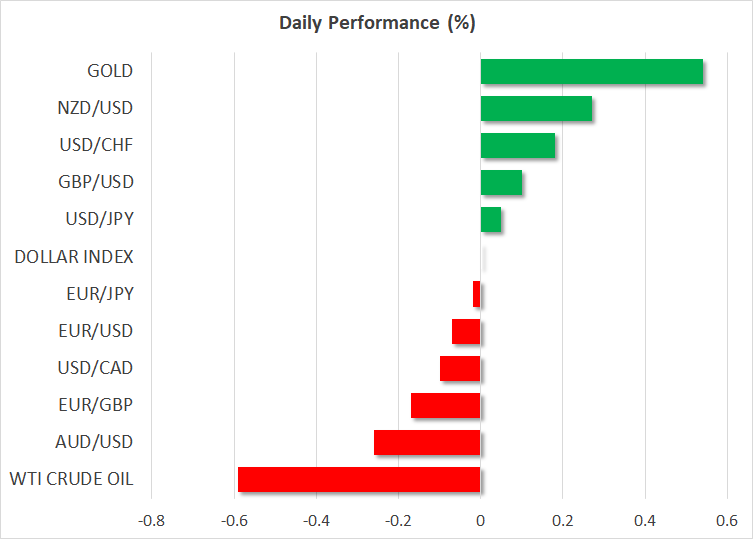
In other currencies, the New Zealand dollar was paring some of yesterday’s sharp losses but the aussie slipped further, hitting one-month lows versus the greenback after underwhelming domestic wage growth data. Although Australia’s wage price index picked up to 2.2% in the third quarter, it was not seen to be substantial enough to warrant an earlier rate move by the RBA.
The Canadian dollar was struggling too ahead of CPI data due later today that is expected to show Canada’s inflation rate approaching 5%. The loonie may not enjoy much of a boost if the CPI numbers beat expectations after the Bank of Canada’s deputy governor, Lawrence Schembri, yesterday dampened expectations of a rate hike in the first half of 2022.
Eurozone CPI finalized at 4.1% yoy in Oct, EU at 4.4%
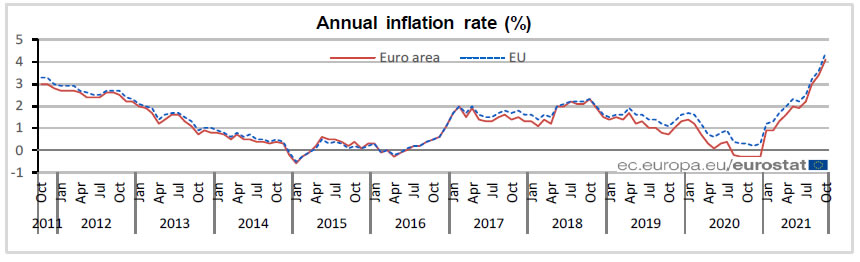
Eurozone CPI was finalized at 4.1% yoy in October, up from September's 3.4%. The highest contribution came from energy (+2.21%), followed by services (+0.86%), non-energy industrial goods (+0.55%) and food, alcohol & tobacco (+0.43%).
EU CPI was finalized at 4.4%, up from September's 3.6% yoy. The lowest annual rates were registered in Malta (1.4%), Portugal (1.8%), Finland and Greece (both 2.8%). The highest annual rates were recorded in Lithuania (8.2%), Estonia (6.8%) and Hungary (6.6%). Compared with September, annual inflation rose in all twenty-seven Member States.
USD Gains On Solid Financial Data
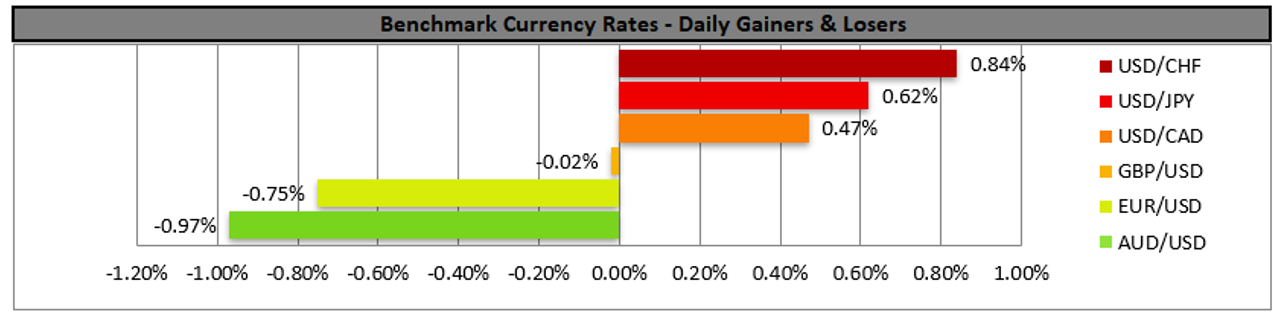
The USD tended to gain against its counterparts yesterday on the back of solid financial data as both the retail sales growth rate and the industrial output outperformed market expectations. The acceleration of the prementioned growth rates for October continued to build on a momentum for the market sentiment strengthening the USD after the release of the US CPI Rates for the same month last week. Also on the monetary front it should be noted that St. Louis Fed President Bullard yesterday stated that the Fed should follow a more hawkish approach that provided additional support for the USD. Given that there is a low number of high impact financial data besides the US construction data we expect fundamentals to be leading the USD for today and should the market sentiment be maintained we may see the greenback gaining further.
The USD Index continued to rise testing the 96.15 (R1) resistance line. We tend to maintain a bullish outlook for the index as long as it remains above the upward trendline incepted since the 9th of November. Please note though that the RSI indicator below our 4-hour chart has clearly surpassed the reading of 70 and may be overbought and could correct lower. Should the bulls actually be maintained we may see the index breaking the 96.15 (R1) resistance line and aim for the 96.65 (R2) level. Should the bears take over, we may see the index reversing course and aiming if not breaking the 95.60 (S1) support line.
EUR retreats on dovish ECB
The common currency retreated yesterday against the USD and displayed a similar behavior against the pound yet seems to stabilize somewhat against safe havens JPY and CHF. The solid financial data released yesterday from the US and the UK tended to increase market expectations for a more hawkish stance for the Fed and the BoE, in contrast to the dovish ECB thus increasing the adverse interest differential outlook for the EUR. It’s characteristic that ECB President Lagarde had pushed back against the idea of a rate hike in 2022 on Monday, thus underscoring the dovish stance of the bank and allowing for little hope for the market. On a more fundamental level we note the delay of the operation of Nordstream 2 in Germany, as German authorities have announced a halt of its approval, which in turn could have an adverse effect on the economic recovery of the Eurozone. Today we note the release of Eurozone’s final HICP rate for October while on the monetary front, ECB’s Lagarde and Schnabel are scheduled to speak and should the bank’s dovishness be reaffirmed we may see the EUR losing more ground.
EUR/USD continued to drop against the USD yesterday breaking the 1.1300 (R1) support line, now turned to resistance during today’s Asian session. We maintain a bearish outlook for the pair as long as it remains below the downward trendline incepted since the 10th of November. Please note that the RSI indicator below our 4-hour chart is clearly below the reading of 30, which in the one hand confirms the bearish sentiment for the pair, yet on the other strongly suggests that the pair may be at oversold levels and could correct higher. Should a selling interest continue to be displayed by the market for EUR//USD we may see the pair breaking the 1.1225 (S1) support line, paving the way for the 1.1165 (S2) level. Should on the other hand a correction higher take place we may see the pair breaking the 1.1300 (R1) line and aim for the 1.1370 (R2) level.
Other market highlights for today
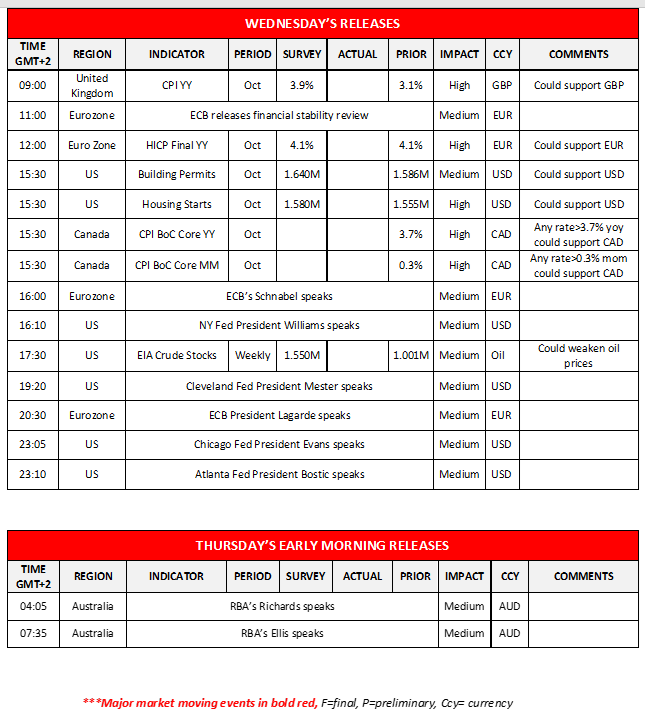
Today we note the release of UK’s CPI rates for October and Eurozone’s final HICP rate for the same month during the European session while on the monetary front ECB’s Lagarde and Schnabel are scheduled to speak. In the American session we get the US construction data for October and from Canada we get the CPI rates for October while oil traders may be more interested in the release of the EIA weekly crude oil inventories figure. On the monetary front NY Fed President Williams, Cleveland Fed President Mester, Chicago Fed President Evans and Atlanta Fed President Bostic are scheduled to speak.
USD Index H4 Chart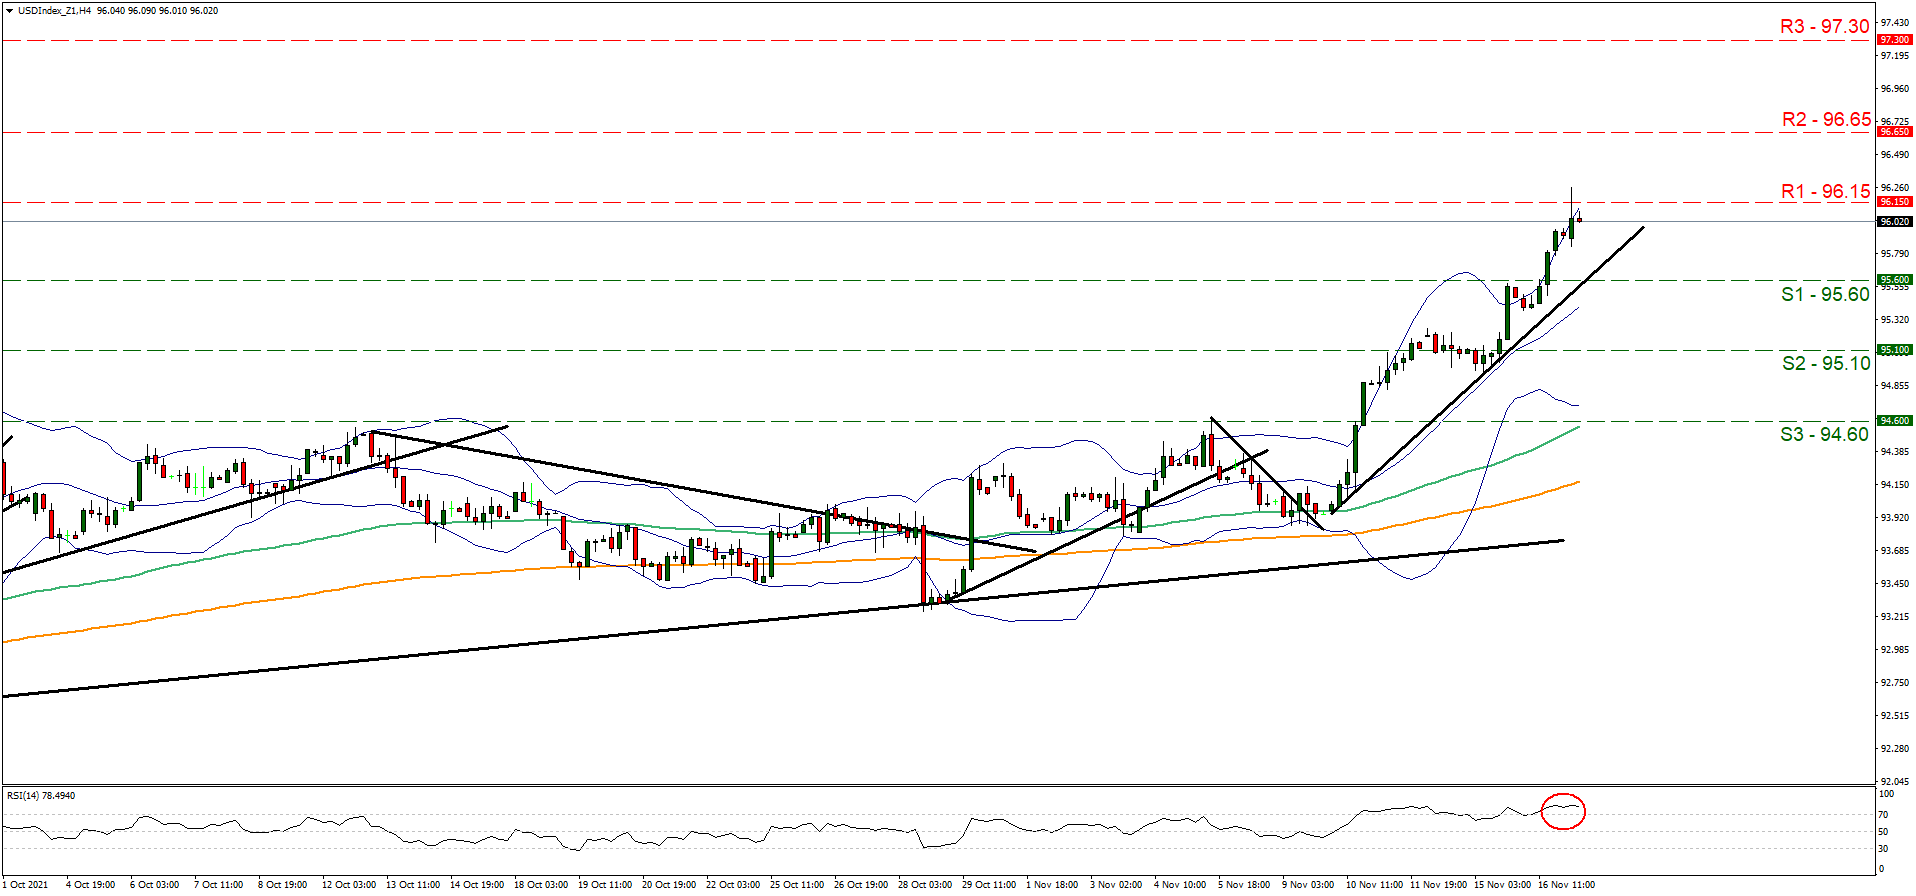
Support: 95.60 (S1), 95.10 (S2), 94.60 (S3)
Resistance: 96.15 (R1), 96.65 (R2), 97.30 (R3)
EUR/USD H4 Chart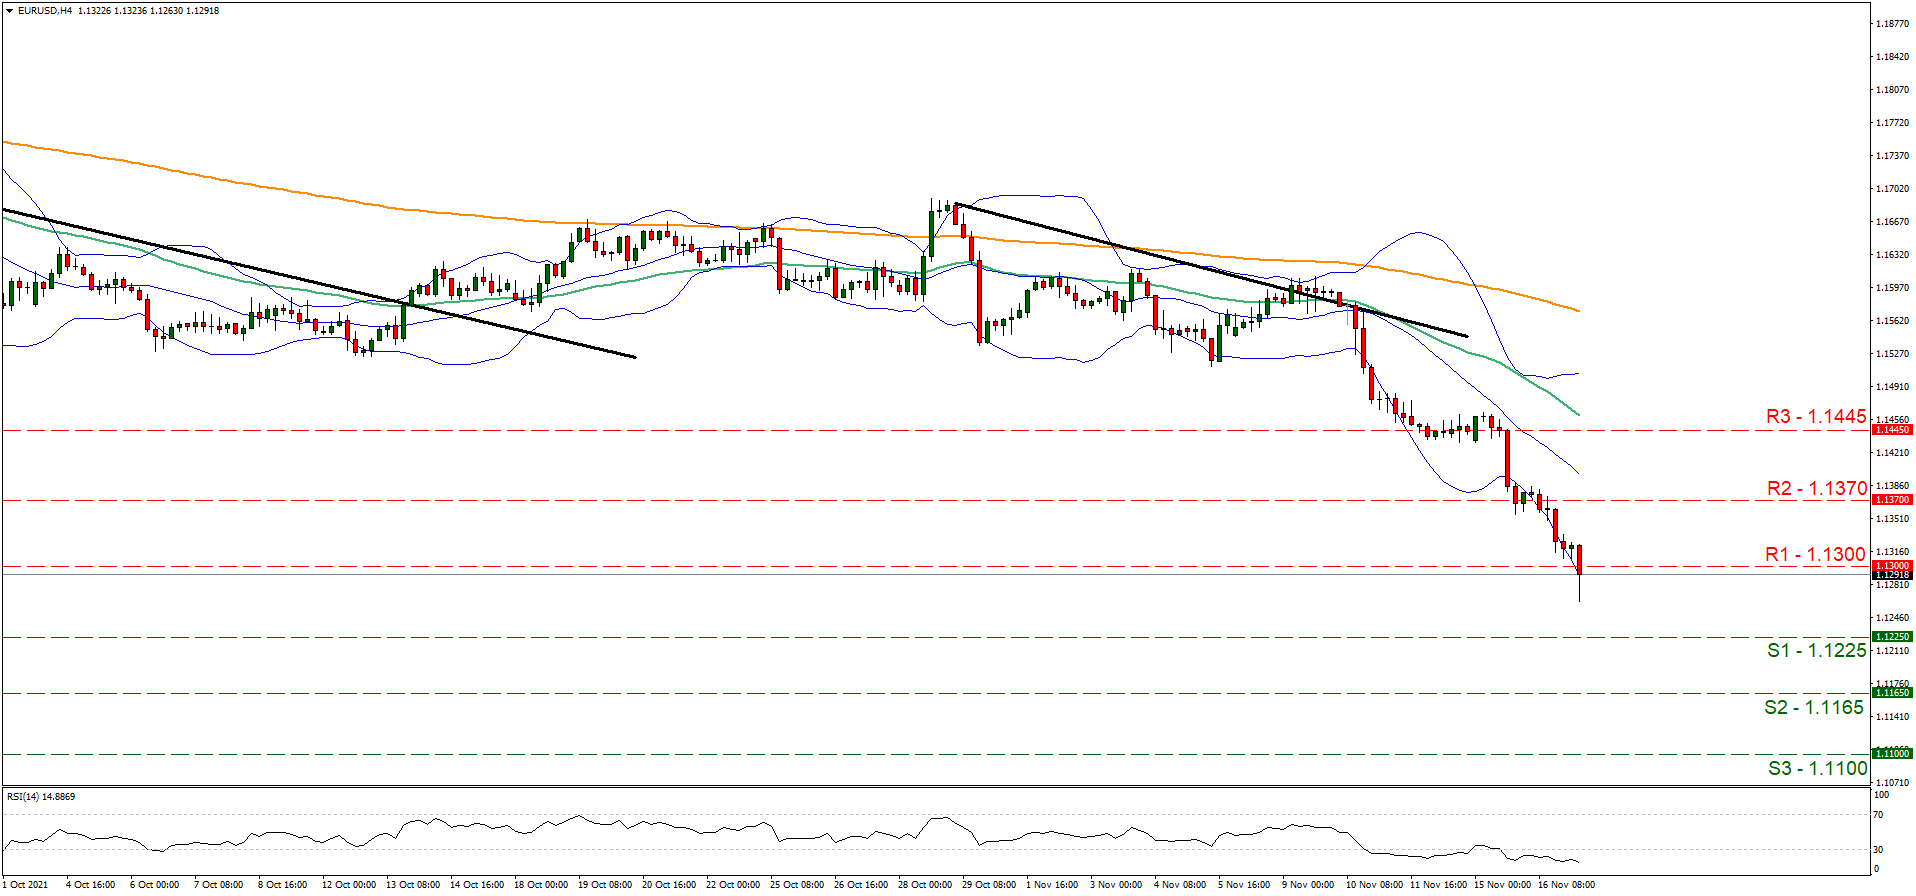
Support: 1.1225 (S1), 1.1165 (S2), 1.1100 (S3)
Resistance: 1.1300 (R1), 1.1370 (R2), 1.1445 (R3)
An Inflation Rate Increased Sharply In The UK
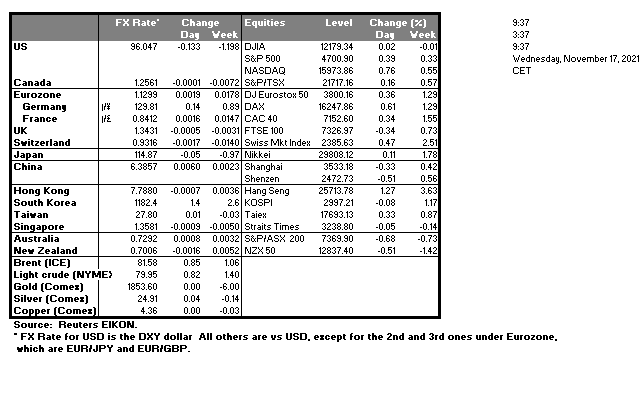
Major US indices finished Tuesday's trading with growth amid optimistic retail sales data for October and amid the signing by the president of the infrastructure package. By the close of the stock market, the Dow Jones increased by 0.15%, the S&P 500 added 0.39%, and the NASDAQ jumped by 0.76%. The US retail sales in October increased by 1.7% compared to the previous month. In October, the US industrial production also added 1.6% from the previous month.
Yesterday, President Joe Biden signed a bipartisan infrastructure bill worth $1.2 trillion over the next 10 years. The initiative includes spending to upgrade the transportation system, improve utility infrastructure, and provide universal Internet access.
Treasury Secretary Janet Yellen indicated lawmakers risked defaulting on the US government if they couldn't raise the statutory debt ceiling by Dec. 15.
Biden said he would make a final decision on the Federal Reserve chairman within about four days. The main candidates for the post are Jerome Powell and Fed Board of Governors member Leil Brainard. Given that Brainard's stance on US inflation and interest rates this year is the same as Powell's, current Fed policy is likely to continue regardless of which of the two leads the Fed.
On Tuesday, St. Louis Fed President James Bullard endorsed a more aggressive approach to monetary policy, saying he believes the central bank should move in a "more hawkish direction." With consumer prices rising at their fastest pace in three decades, the central bank may need to recognize that much of the growth reflects an overheating economy. Such a turnaround could push the dollar higher against major currencies such as the euro and yen, as higher rates attract funds from abroad.
Pfizer submits an FDA application for emergency approval of tablets for COVID-19 treatment.
Europe's stock indices traded flat yesterday. Germany's DAX and France's CAC 40 increased by 0.6% and 0.3%, respectively. The British FTSE 100 decreased by 0.3%, Italian FTSE MIB decreased by 0.2%, and Spanish IBEX lost 0.6%. The UK unemployment rate fell more than expected to 4.3% from 4.5% previously, the lowest since July 2020. Meanwhile, the UK consumer price index was 4.2% in annual terms (forecast 3.9%, previous 3.1%), suggesting that inflation is accelerating. Inflation rose 1.1% in the last month (forecast 0.8%).
The UK core CPI (excluding food and energy prices) was 3.4% (forecast 3.1%, previous 2.9%). Two more gas and electricity retailers in the UK went bankrupt, including Neon Energy and Social Energy Supply. Already 20 British energy retailers have gone out of business in recent months. Bank of England Governor Andrew Bailey said next month's employment data will be crucial for the central bank while considering whether to raise the bank rate for the first time since the pandemic began or not.
ECB spokesman Rehn said yesterday that inflation in the Eurozone would decrease next year, and that the acceleration in inflation is due to the energy and supply crises. Europe will report on inflation today.
Ukraine will lose about $2 billion (1.5% of the country's GDP) every year if Nord Stream 2 starts working, the head of Naftogaz said. He also expects the US to impose sanctions against the pipeline operator because Russia is "not playing by the rules." Germany has temporarily suspended the certification procedure for Nord Stream 2. The certification of Nord Stream 2 operator will continue if the form of its organization complies with German law. Gas futures prices in Europe increased by 10.7% amid the suspension of Nord Stream 2 certification. The suspension may last for 4-6 weeks.
In October, OPEC+ increased its oil production by 240,000 barrels per day, to 27.42 million barrels per day. IEA raised OPEC+ crude production forecast for 2021 and expected an increase of another 480,000 barrels per day.
Most Asian stocks fell on Wednesday as the US dollar held near a one-year high, helped by strong US economic data that underscored the need for tighter monetary policy and higher Treasury yields.
Main market quotes:
- S&P 500 (F) 4,700.90 +18.10 (+0.39%)
- Dow Jones 36,142.22 +54.77 (+0.15%)
- DAX 16,247.86 +99.22 (+0.61%)
- FTSE 100 7,326.97 −24.89 (-0.34%)
- USD Index 95.96 +0.55 (+0.58%)
Important events for today:
- ECB President Christine Lagarde’s Speech at 03:20 (GMT+2);
- UK Consumer Price Index (m/m) at 09:00 (GMT+2);
- Eurozone Consumer Price Index (m/m) at 12:00 (GMT+2);
- US Building Permits (m/m) at 15:30 (GMT+2);
- Canada Consumer Price Index (m/m) at 15:30 (GMT+2);
- US FOMC Member Williams speaks at 16:10 (GMT+2);
- US Crude Oil Inventories (w/w) at 17:30 (GMT+2);
- US FOMC Member Bowman speaks at 18:00 (GMT+2);
- US FOMC Member Waller speaks at 19:40 (GMT+2);
- US FOMC Member Daly speaks at 19:40 (GMT+2);
- US FOMC Member Evans speaks at 23:05 (GMT+2);
- US FOMC Member Bostic speaks at 23:10 (GMT+2).
Oil Price In A Downside Correction Below $78.50
Crude oil price started a downside correction from well above the $82.00 level against the US Dollar. The price tested the $78.50 support zone, where the bulls emerged.
The price recovered above $80.00, but it failed to continue higher. A high was formed near $80.62 before there was a fresh decline. There was a break below a key contracting triangle with support near $79.45 on the hourly chart.
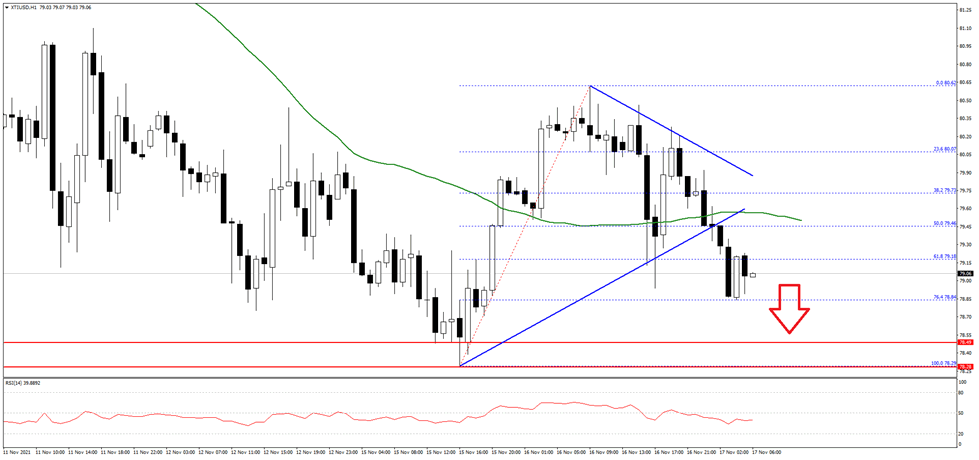
On the downside, an initial support is near $78.80 on FXOpen. The first major support is near the $78.50, below which there is a risk of more losses. In this case, the price could even test $77.00 in the near term.
On the upside, the $80.50 level is a key hurdle. A clear break above the $80.00 and $80.50 levels could start a fresh increase in the near term.
USDCHF Came Back Swinging As Bullish Forces Resurface
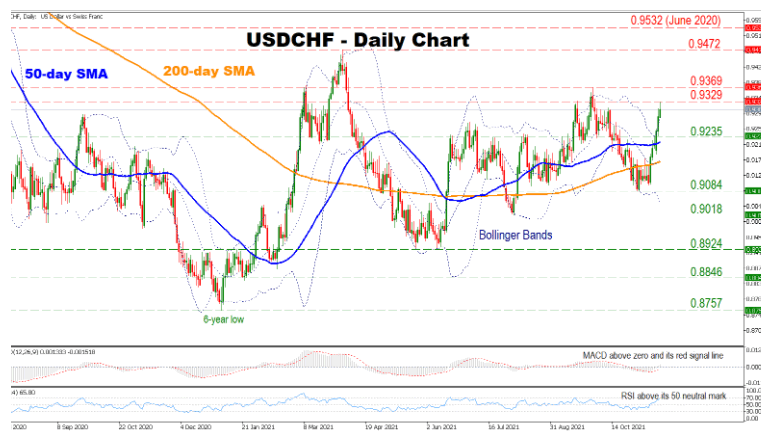
USDCHF came back swinging after its October retreat, crossing above its 50- and 200-day simple moving average (SMA) in the past couple of sessions. However, this positive momentum might be short lived as the pair is currently trading above the upper bound of its Bollinger Bands, signalling an overbought market.
Despite the mixed signals, the short-term oscillators are transmitting a positive bias, reflecting the recent price appreciation of the pair. The RSI is increasing above its 50 neutral mark, while the MACD is found above zero and its red signal line.
Should the bulls remain in charge, initial resistance might be found at the 0.9329 level. Surpassing this barrier, could pave the way towards the 0.9369 obstacle before targeting the 0.9472 region. Breaching the latter could strengthen the pair’s positive momentum, sending the price to test its June 2020 high of 0.9532.
On the flip side, if the price breaks below the congested region, which encapsulates the 0.9235 support and the 50-day SMA currently at 0.9218, the bears might then target the 200-day SMA, currently found at 0.9163. Sinking below that crucial level, all eyes would turn into the 0.9084 barrier.
In brief, the technical picture is cautiously positive. For that to change, the sellers would need to breach the 200-day SMA.
EURGBP Plummets To 20-Month Low
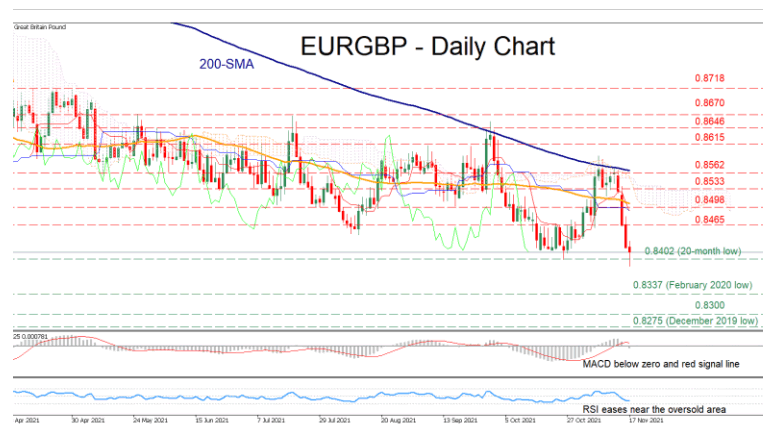
EURGBP has been trending downwards since August 2020. Although the pair has adopted a more sideways pattern in the last eight months, the short-term picture has started to deteriorate again as the price is fluctuating close to record lows.
While EURGBP is pivoting near the 20-month low of 0.8402, momentum indicators suggest an imminent bearish bias. The MACD histogram is below zero and its red signal line, and the RSI is flatlining near the 30-oversold area. Moreover, the price is currently trading below the Ichimoku cloud.
Should the selling pressure intensify and the price falls below the 0.8402 region, the immediate hurdle for the bears would be the February 2020 low of 0.8337. A drop below this support would open the way towards the 0.8300 psychological mark. If this obstacle fails as well, the pair might then seek to halt its decline at the December 2019 low of 0.8275.
Alternatively, should the negative bias fade and the price reverses upwards, buyers may target the 0.8465 level. If they manage to conquer this barricade, then the next challenge could be met at 0.8498, which has provided both resistance and support in the recent months. Overcoming this level, the next hurdle for the bulls might be 0.8533 or even higher the 0.8562 region.
Overall, the outlook for EURGBP is bearish. Should the pair manage to cross below the 0.8402 key resistance area, the negative momentum is likely to strengthen, sending the pair to test its historical lows.
The Analytical Overview Of The Main Currency Pairs
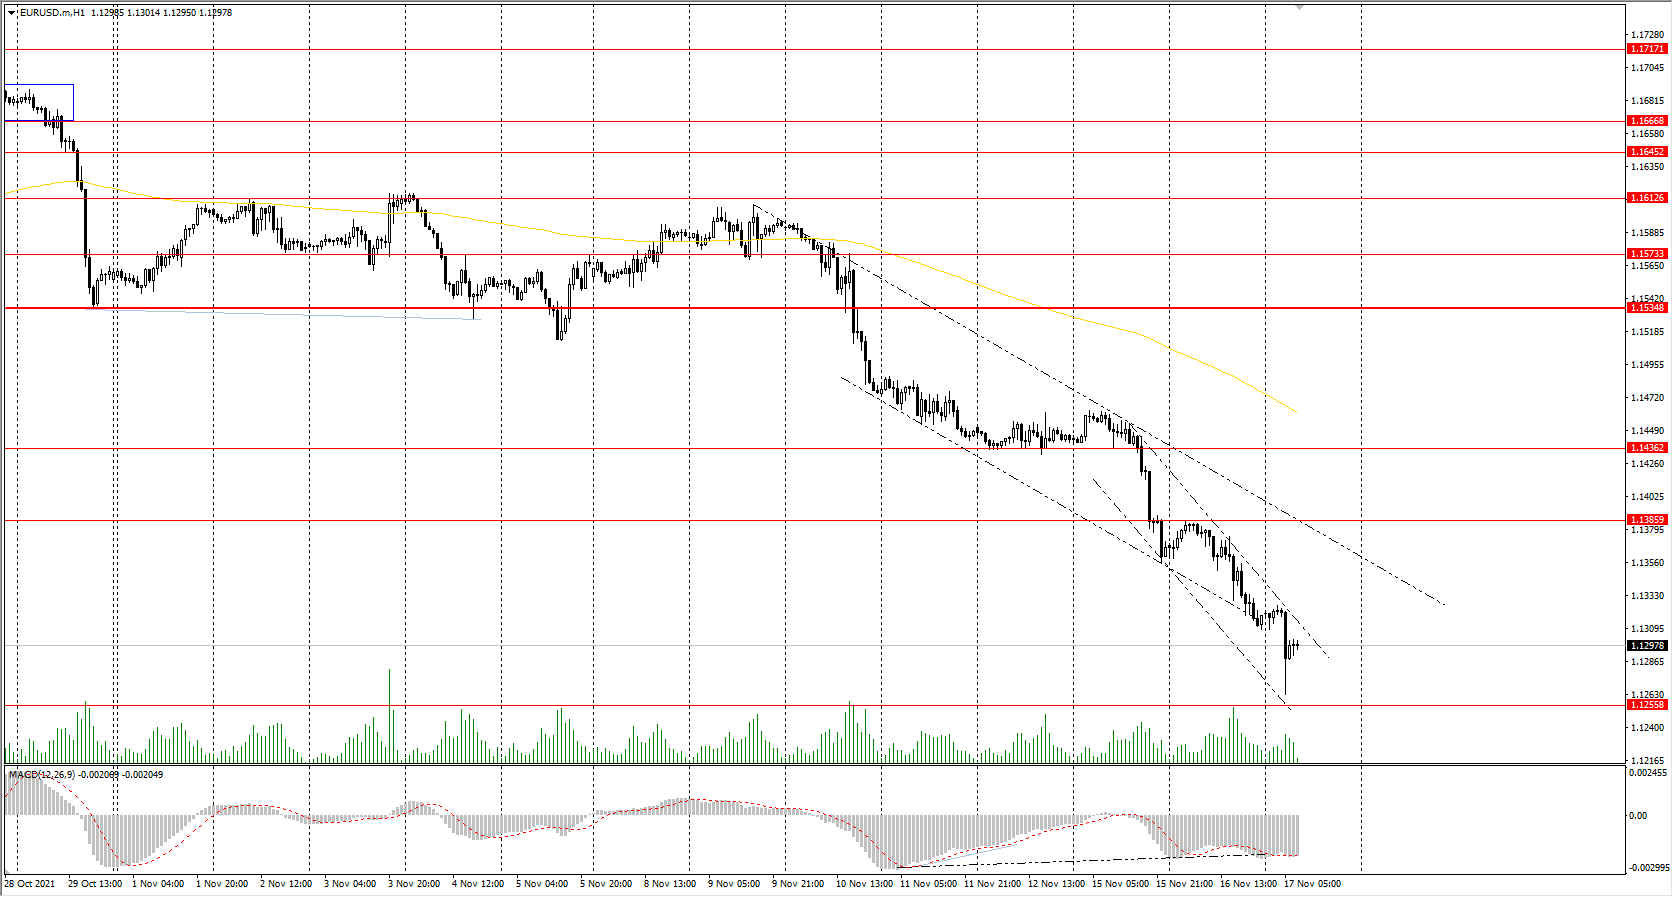
The EUR/USD currency pair
Technical indicators of the currency pair:
Prev Open: 1.1368
Prev Close: 1.1319
% chg. over the last day: -0.43%
Eurozone GDP growth estimate for Q3 remained at 2.2% as expected. Meanwhile, the euro fell to its lowest level against the dollar since July 2020, its worst performance in 6 years. The reason for this lies in 2 factors. The first is that European economic data is lagging behind US data. The second is that the Fed has already started reducing the QE program, while Christine Lagarde said in her speech yesterday that the ECB will not hurry with cutting the stimulus.
Trading recommendations
Support levels: 1.1256
Resistance levels: 1.1386, 1.1436, 1.1535, 1.1613, 1.1667, 1.1717
From the technical point of view, the EUR/USD on the hour time frame is bearish. The Euro continues to decline against the US dollar. The MACD indicator is in the negative zone, but there is a divergence on the higher time frame, which indicates a coming correction. For rebound, a support level is required. Under such market conditions, traders should consider sell positions from the resistance levels near the moving average, as price has deviated strongly from the averages. Buy trades should be considered only from the support levels of the higher time frame, given the buyers’ initiative, but only with short targets.
Alternative scenario: if the price breaks out through the 1.1535 resistance level and fixes above, the mid-term uptrend will likely resume.
News feed for 2021.11.17:
- ECB President Christine Lagarde’s Speech at 03:20 (GMT+2);
- Eurozone Consumer Price Index (m/m) at 12:00 (GMT+2);
- US Building Permits (m/m) at 15:30 (GMT+2);
- US FOMC Member Williams speaks at 16:10 (GMT+2);
- US FOMC Member Bowman speaks at 18:00 (GMT+2);
- US FOMC Member Waller speaks at 19:40 (GMT+2);
- US FOMC Member Daly speaks at 19:40 (GMT+2);
- US FOMC Member Evans speaks at 23:05 (GMT+2);
- US FOMC Member Bostic speaks at 23:10 (GMT+2).
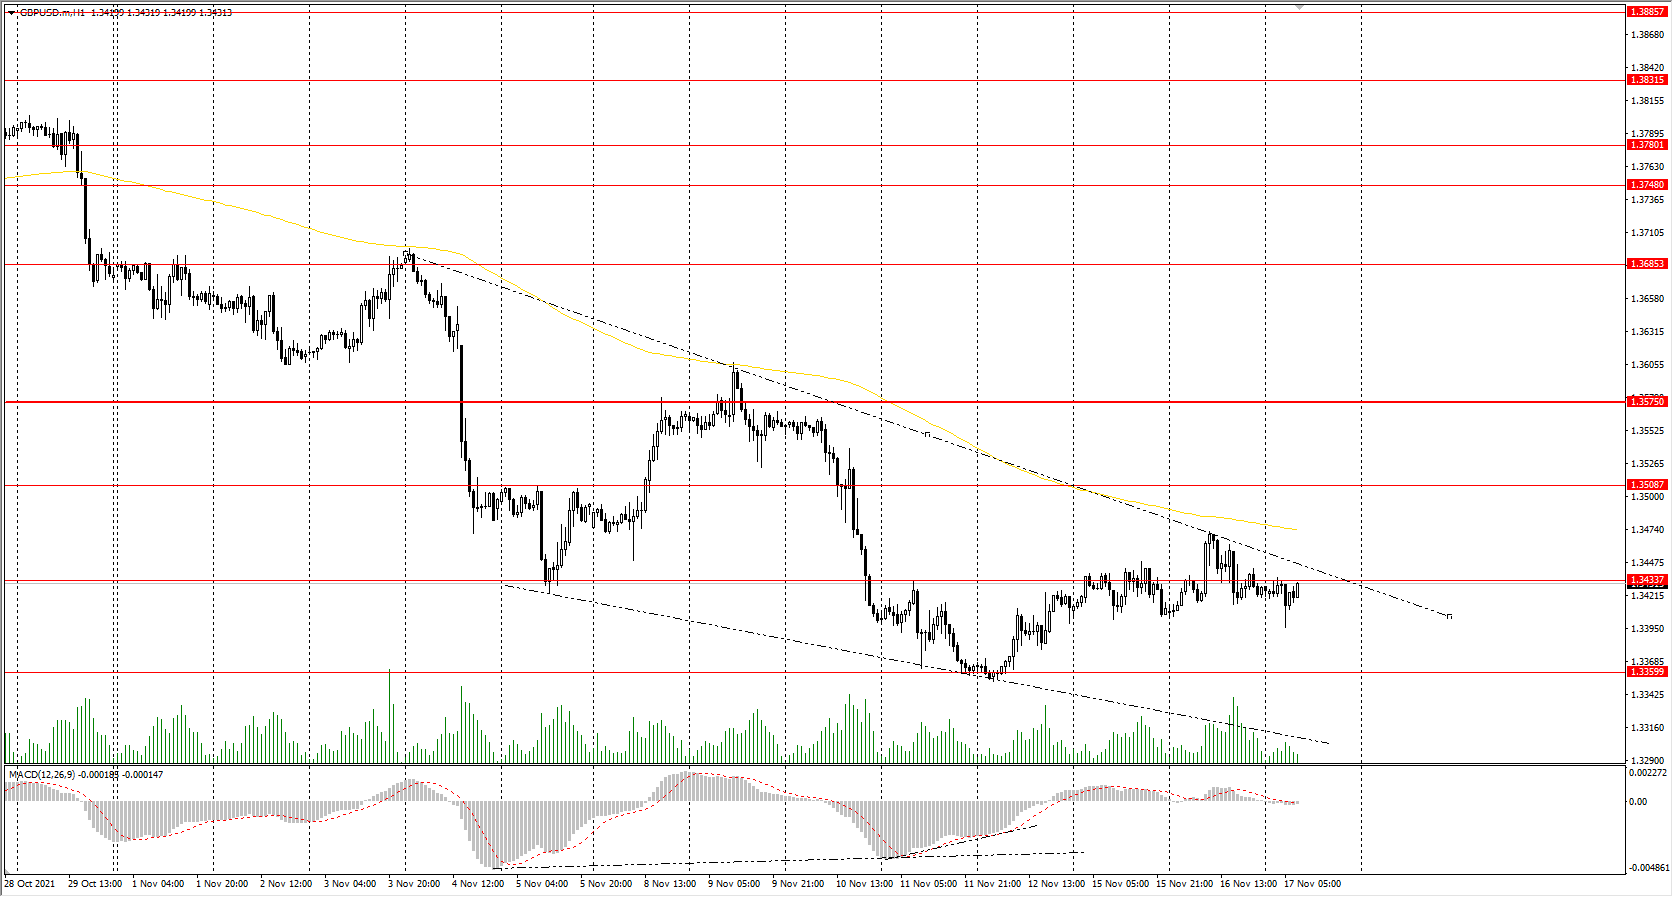
The GBP/USD currency pair
Technical indicators of the currency pair:
Prev Open: 1.3409
Prev Close: 1.3428
% chg. over the last day: +0.14%
The UK unemployment rate fell more than expected to 4.3% from 4.5% previously, the lowest rate since July 2020. Employment rose by 247,000 in July-September, exceeding the projected 185,000 increase, while the number of unemployed fell by 152,000. Bank of England Governor Andrew Bailey said next month's employment and inflation data would be crucial for the central bank while considering whether to raise the interest rate for the first time since the pandemic began.
Trading recommendations
Support levels: 1.3360
Resistance levels: 1.3434, 1.3507, 1.3575, 1.3685, 1.3748
On the hourly time frame, the trend on GBP/USD is bearish. The MACD indicator has become inactive. Under such market conditions, traders should consider sell positions from the resistance levels near the moving average. Buy trades should be considered only from the support levels of the higher time frame, given the buyers’ initiative.
Alternative scenario: if the price breaks out through the 1.3575 resistance level and consolidates above, the bullish scenario will likely resume.
News feed for 2021.11.17:
- UK Consumer Price Index (m/m) at 09:00 (GMT+2).
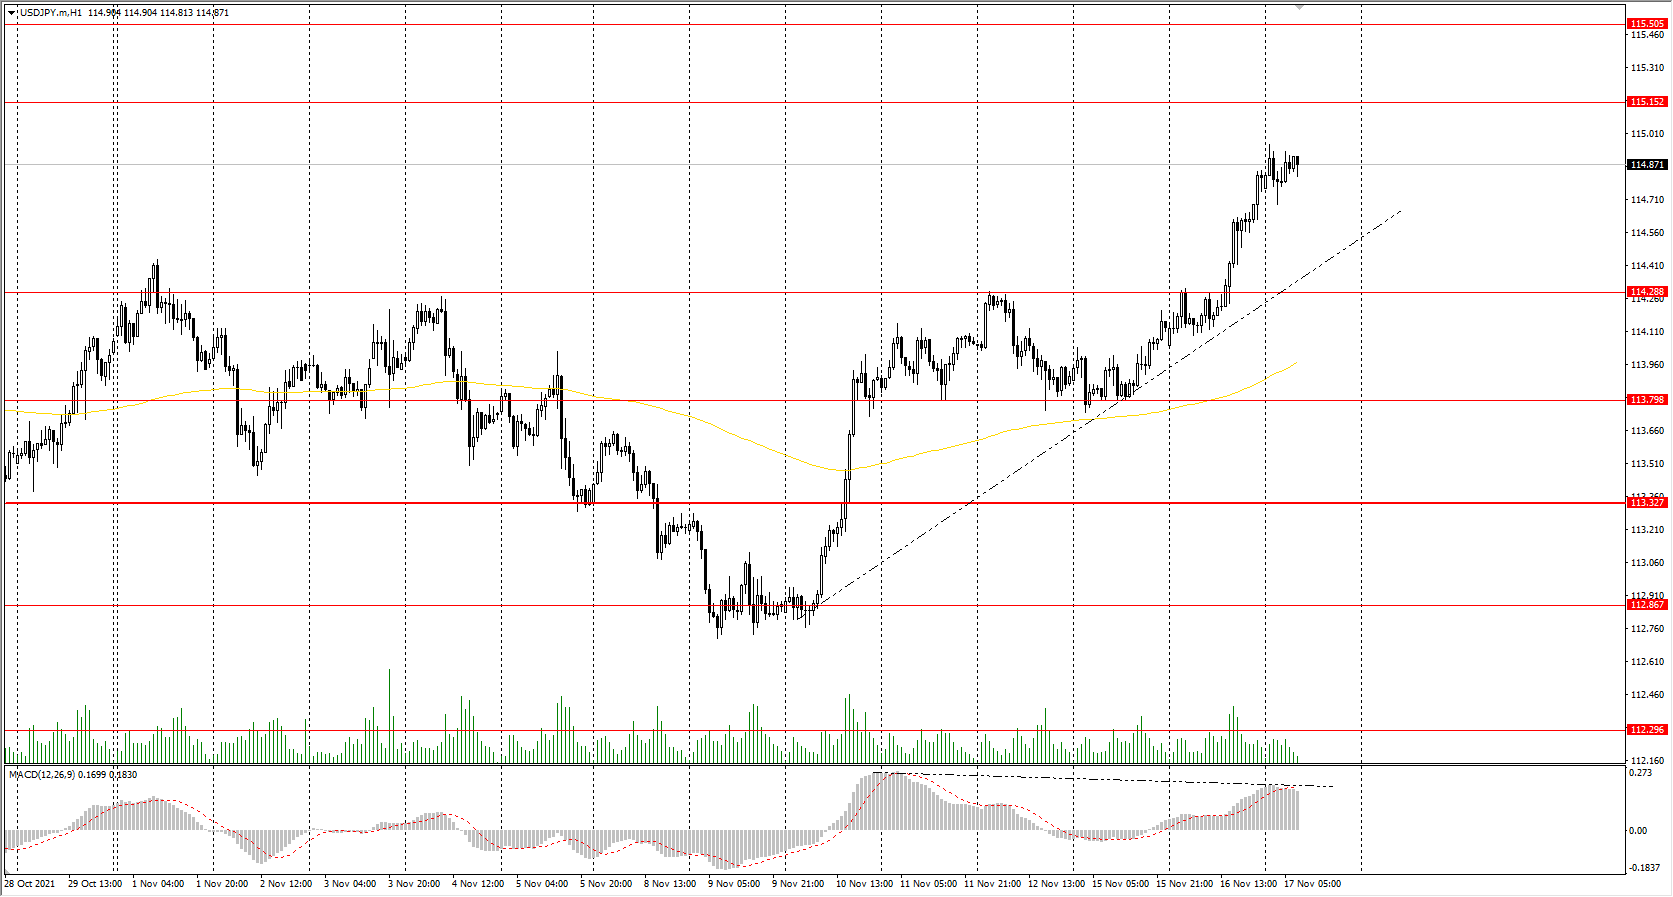
The USD/JPY currency pair
Technical indicators of the currency pair:
Prev Open: 114.05
Prev Close: 114.81
% chg. over the last day: +0.67%
A Bank of Japan scheme introduced to support smaller lenders hurt by its ultra-low interest rates has perversely pushed up short-term borrowing costs, further complicating the central bank's plans to abandon its soft monetary policy. The Japanese yen will continue to decline against major currencies.
Trading recommendations
Support levels: 114.29, 113.79, 113.32, 112.87, 112.30
Resistance levels: 115.15, 115.50
The global trend on the USD/JPY currency pair is bullish. Yesterday, the price broke through the important resistance level and moved further upward. But a divergence appeared on the MACD indicator, which indicates the weakness of the buyers. Under such market conditions, it’s better to look for buy positions from the buyers' initiative zone near the moving average or from the local trend line. Sell positions should be considered from the resistance levels of higher time frames, given there is sellers' initiative, but only with short targets.
Alternative scenario: if the price falls below 113.32, the uptrend will likely be broken.
The USD/CAD currency pair
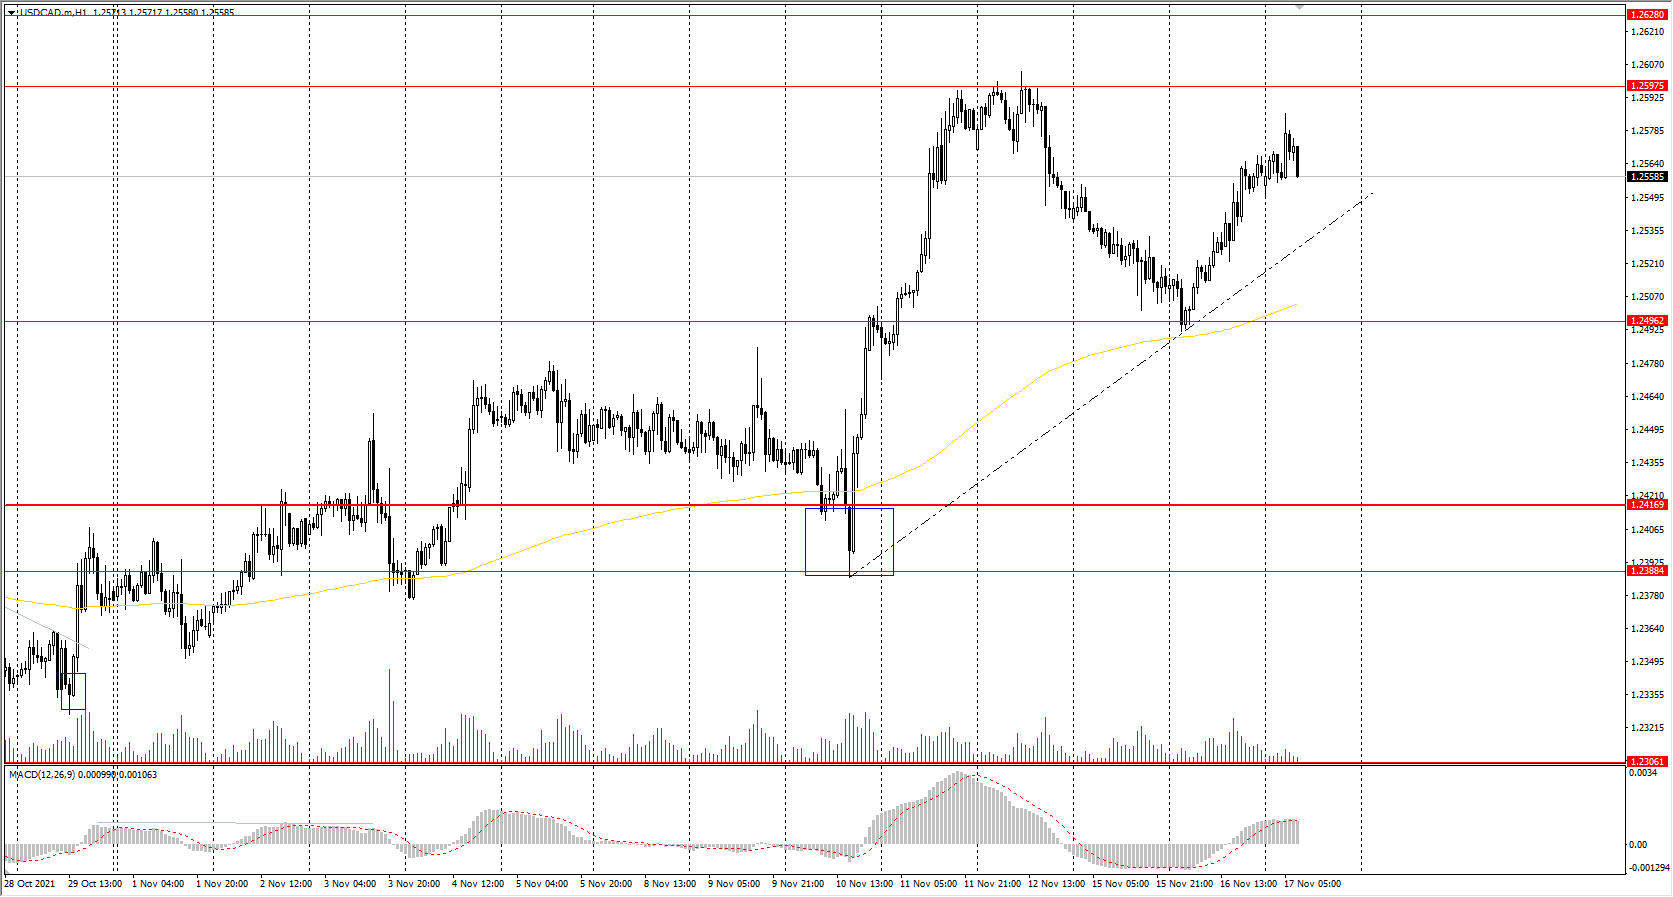
Technical indicators of the currency pair:
Prev Open: 1.2510
Prev Close: 1.2560
% chg. over the last day: +0.40%
The Canadian dollar is a commodity currency, so the USD/CAD currency pair highly depends on the dynamics of the dollar index and oil prices. Yesterday, the dollar index increased while oil prices went down. As a result, the USD/CAD currency pair increased because of the strengthening US currency. Fundamentally, both the dollar index and oil quotes have an upward trend now, so USD/CAD will be trading flat in the medium term.
Trading recommendations
Support levels: 1.2496, 1.2416, 1.2388
Resistance levels: 1.2598, 1.2628, 1.2729
From a technical point of view, the trend of the USD/CAD currency is bullish. The MACD indicator is positive again. Under such market conditions, it is better to look for buy trades from the support levels near the moving average. Sell deals should be considered from the resistance levels of the higher time frame.
Alternative scenario: if the price breaks down through the 1.2416 support level and fixes below, the downtrend will likely resume.
News feed for 2021.11.17:
- Canada Consumer Price Index (m/m) at 15:30 (GMT+2);
- US Crude Oil Inventories (w/w) at 17:30 (GMT+2).
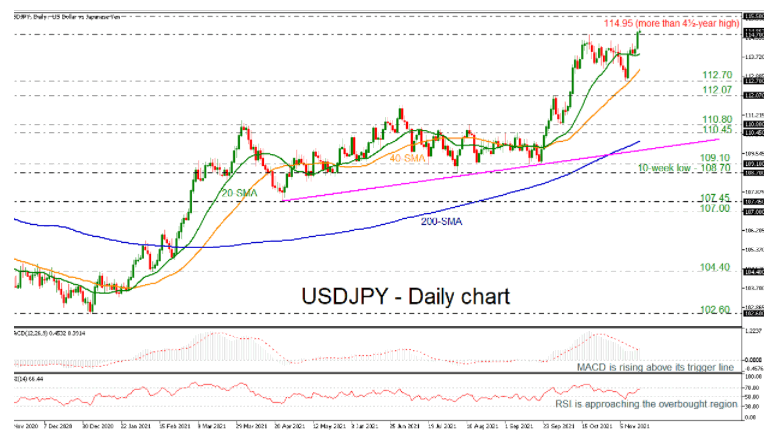
USDJPY Visits The Region Around 115.00, More Than 4½-Year High
USDJPY is recording new highs slightly below the 115.00 psychological level, extending the bullish structure that started from the 112.70 support level.
In trend indicators, the 20- and 40-day simple moving averages (SMAs) are turning higher, following the market price. The MACD oscillator is surpassing its trigger line in the positive region and the RSI is approaching the overbought territory with strong momentum.
More bullish movements could send the market until the 115.50 barrier, registered in March 2017, before taking the price until the next resistance of 118.60, taken from the peak on January 2017.
On the flip side, a bearish move could meet immediate support at the 20-day SMA at 113.86 ahead of the 40-day SMA at 113.20. Beneath these lines, the bears may have a look at the 112.07-112.70 zone.
To sum up, USDJPY has been in a bullish tendency since April 23 with stronger momentum in the last few sessions. However, any declines below the 200-day SMA and the uptrend line, it could shift the outlook to neutral.
NZDUSD Looks Bearish But Gets Support From Ichimoku Cloud
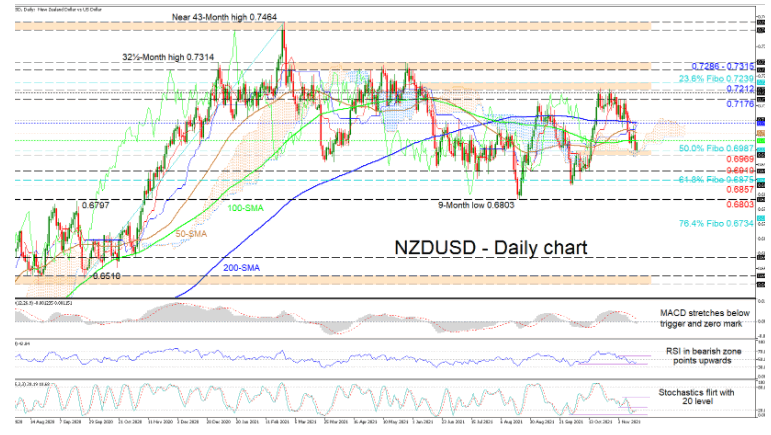
NZDUSD has established a strong foothold in the vicinity of a support zone that has formed between the 0.6987 and 0.6969 levels, the former being the 50.0% Fibonacci retracement of the up leg from 0.6510 until the near 43-month peak of 0.7464. The longer-term 100- and 200-day simple moving averages (SMAs) are reflecting a trendless trajectory in the pair, while the recent dip in the 50-day SMA is suggesting that sellers have a slight lead.
The Ichimoku lines are not sponsoring any clear price direction, while the short-term oscillators are transmitting mixed signals in directional momentum. The MACD has extended beneath its red trigger line and further into the negative region, while the RSI is pushing higher in the bearish territory. Currently, the stochastic lines are failing to exhibit any clear directional impetus in the pair.
If buyers fail to create upside pressure, immediate downside constraints could emanate from the 0.6969-0.6987 support band and the overlapping cloud. Should this tough barricade give way, the price may plunge towards the 0.6910 low before the bears target the 61.8% Fibo of 0.6875 and the adjacent 0.6857 trough. Sinking past these obstacles, traders’ attention could then turn towards the nine-month low of 0.6803.
If bullish traction evolves, a preliminary zone of resistance could take shape between the 100- and 50-day SMAs at 0.7022 and 0.7051. Should upside forces persist, the 200-day SMA at 0.7087 and the nearby 0.7100 handle could come into the picture. Failing to dampen buying powers, the price may then propel for the 0.7176 high prior to challenging the 0.7200 barrier, and the resistance boundary from the 0.7212 mark until the 23.6% Fibo of 0.7239.
Summarizing, in the short-term picture, NZDUSD appears somewhat stuck in a neutral phase. For a definitive price direction to materialise, the price would need to conquer the 0.7286-0.7315 ceiling or extend a dive past the 0.6803 trough and below the 76.4% Fibo of 0.6734.