Sample Category Title
USD Gained As US Retail Sales Are Awaited
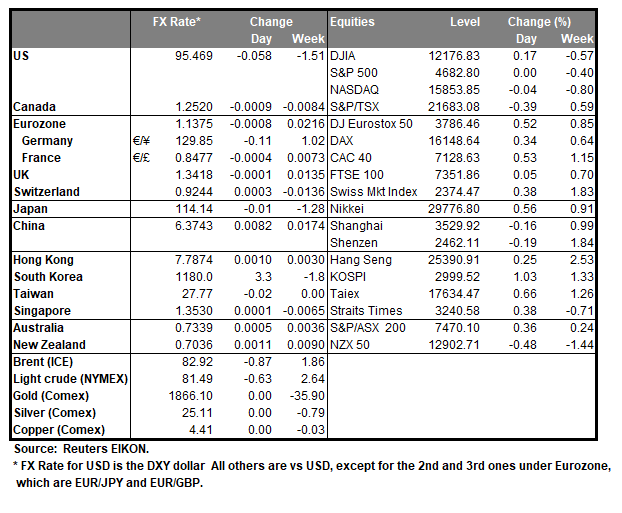
The USD tended to gain against a number of its counterparts yesterday as the market’s attention turns to the release of the US retail sales growth rate for October in today’s American session. It should be noted that shortly after the release also the US industrial production growth rate for the same month is to be released and could extend the volatility for the greenback. On a monetary level the market’s bets on whether the Fed will tighten its monetary policy at a faster pace, after the release of the US CPI rates for October last week, were carried forward and we note Atlanta Fed President Bostic’s speech later on today. On a more fundamental level, we note the friendly tone in the meeting of US president Biden and Chinese leader Xi Jinping and its characteristic that the Chinese leader called the US president an “old friend”, while also called for more cooperation and communication. The Yuan tended to gain and the partial thawing of tensions in the US-Sino relationships could create some safe haven outflows for the USD and provide support for commodity currencies such as the Aussie. US stockmarkets presented little volatility yesterday, yet we would note that Tesla’s share price continued to drop given also that Elon Musk threatened to sell another part of its shareholdings in a Twitter spat with Democratic senator Sanders.
The USD Index rose yesterday testing the 95.60 (R1) resistance line before retreating lower. We tend to maintain a bullish outlook for the index, yet we note that the RSI indicator below our 4-hour chart is at the reading of 70 and could be signalling that the index is overbought and ripe for a correction lower. Should the bulls actually maintain control over the index we may see it breaking the 95.60 (R1) resistance line and aim for the 96.15 (R2) level. Should the correction lower be extended, we may see the index breaking the upward trendline guiding it, the 95.10 (S1) support line and take aim for the 94.60 (S2) level.
Pound traders eye employment data
Despite some stabilisation of the pound against the USD, we still are bearish on cable, yet the pound gained substantially against the weakening EUR and also edged higher against JPY yesterday. On a fundamental level, we get highlight the sleaze allegations against the UK government and should they intensify, we may see the pound retreating somewhat as it could provide some degree of political instability. On the other hand the situation of the pandemic in the UK remains worrying. It’s characteristic of the situation that UK Prime Minister Johnson has warned that a new UK lockdown is possible, given that the National Health Service is struggling. On the monetary front BoE’s dilemma on whether to hike or not in its next meeting is still present and in the following days we note that financial data due out could provide more clarity. Today we highlight the release of UK’s employment data and should a tightening of the UK employment market be reported, we may see the sterling getting some support and vice versa.
GBP/USD maintained a sideways motion yesterday near the 1.3430 (R1) resistance line. We tend to maintain a bearish outlook for the pair as long as it remains below the downward trendline incepted since the 29th of October. Should a selling interest be displayed by the market for cable we may see the pair aiming if not breaking the 1.3290 (S1) support line. Should the pair find fresh buying orders along its path, we may see it breaking the 1.3430 (R1) line, the prementioned upward trendline and aim for the 1.3600 (R2) level.
Other market highlights for today
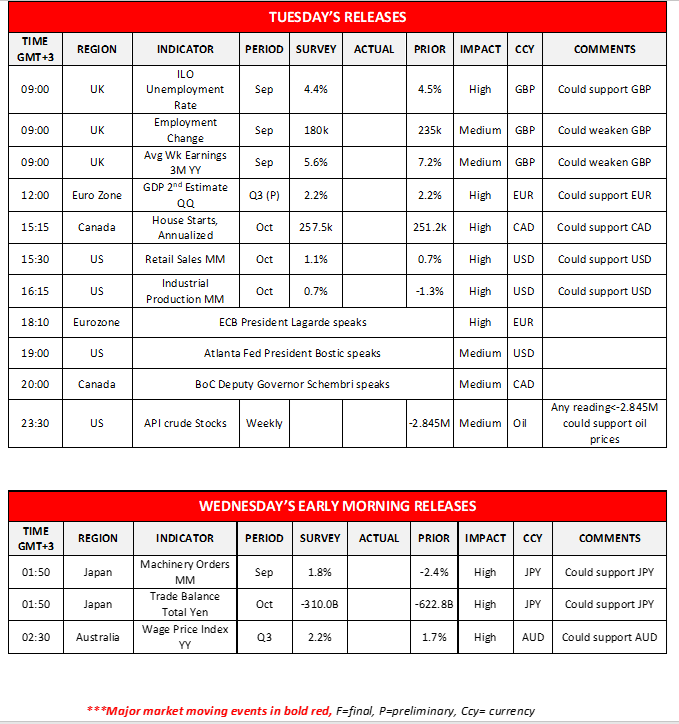
Today we also note the release of Eurozone’s 2nd estimate of the GDP rate for Q3, Canada’s House starts for October and the API weekly US crude oil inventories figure. During the Asian session tomorrow we get from Japan the machinery orders for September and the trade data for October while from Australia we note the wage price index for Q3. On the monetary front ECB’s Lagarde, Atlanta Fed President Bostic and BoC Deputy Governor Schembri is scheduled to speak.
USD Index H4 Chart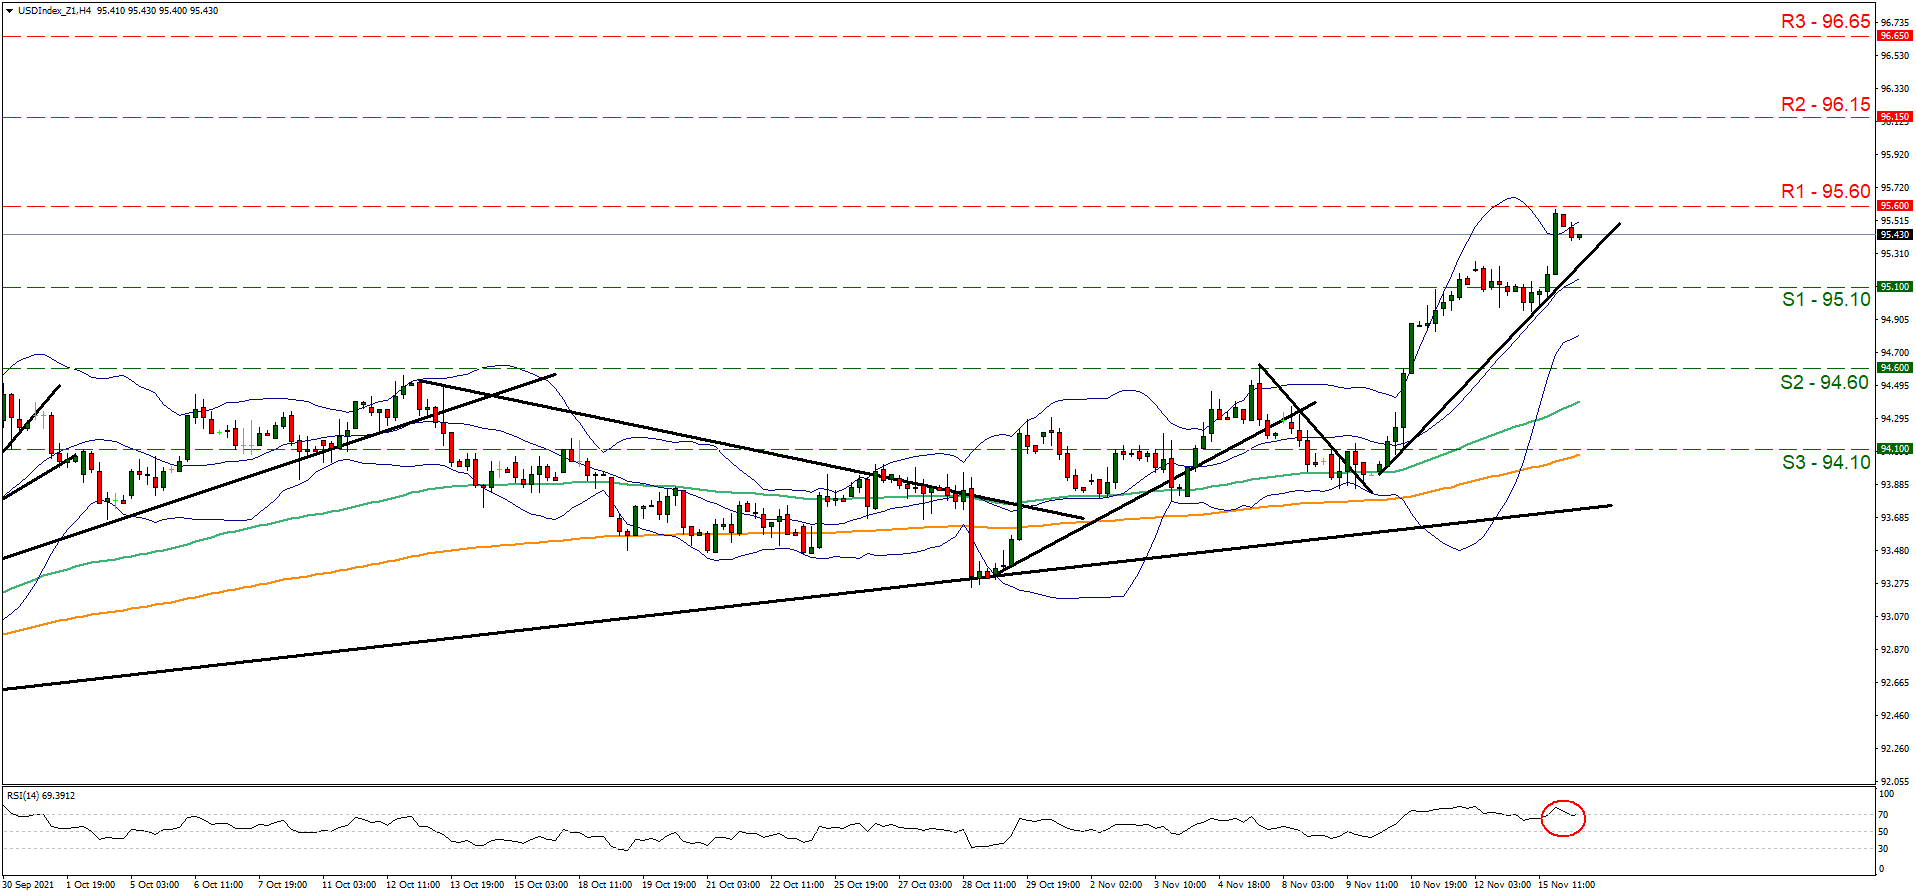
Support: 95.10 (S1), 94.60 (S2), 94.10 (S3)
Resistance: 95.60 (R1), 96.15 (R2), 96.65 (R3)
GBP/USD H4 Chart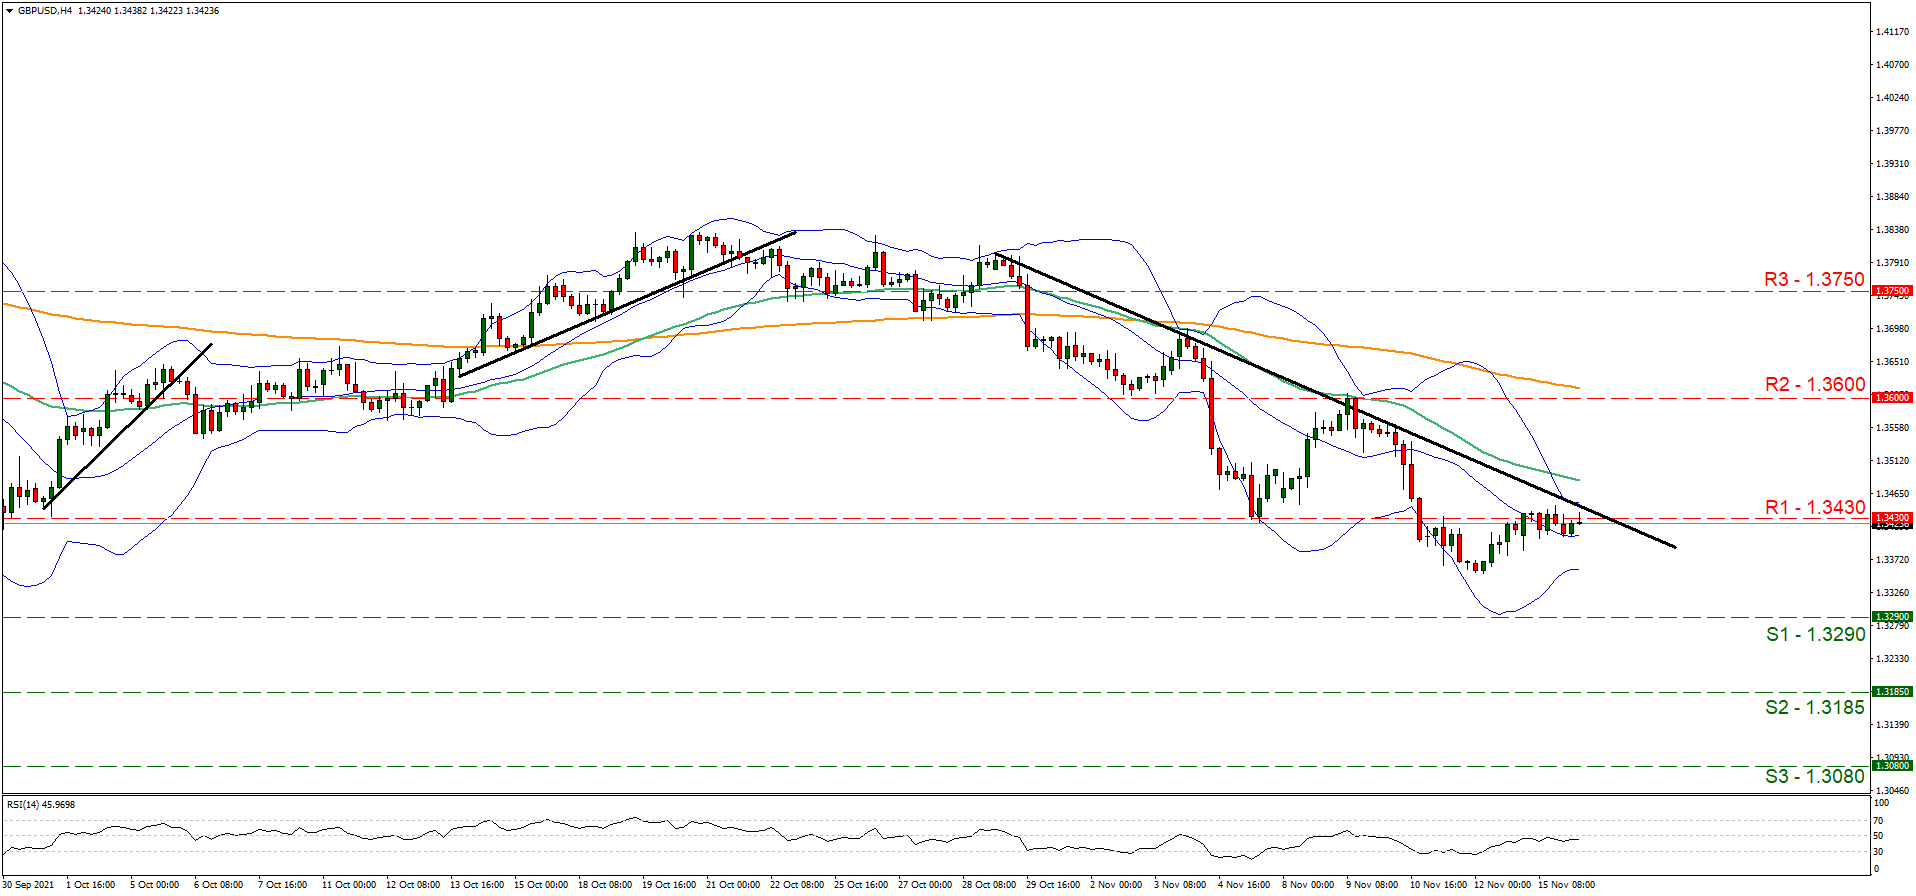
Support: 1.3290 (S1), 1.3185 (S2), 1.3080 (S3)
Resistance: 1.3430 (R1), 1.3600 (R2), 1.3750 (R3)
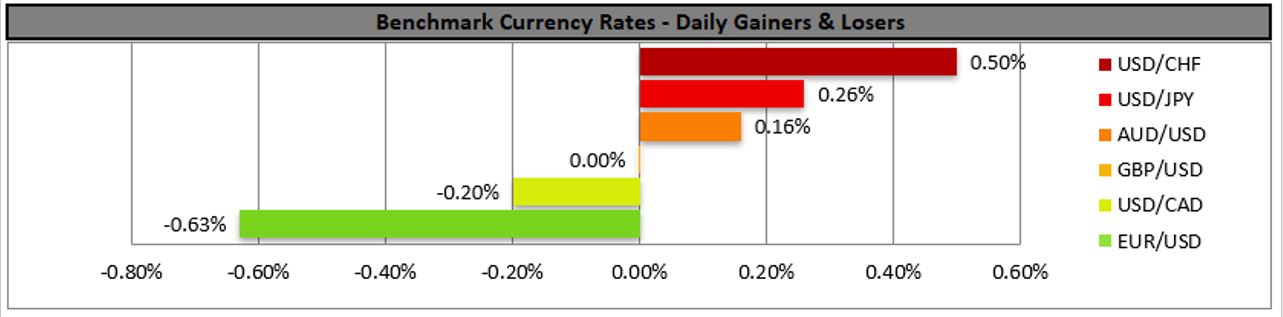
The Analytical Overview Of The Main Currency Pairs
The EUR/USD currency pair
Technical indicators of the currency pair:
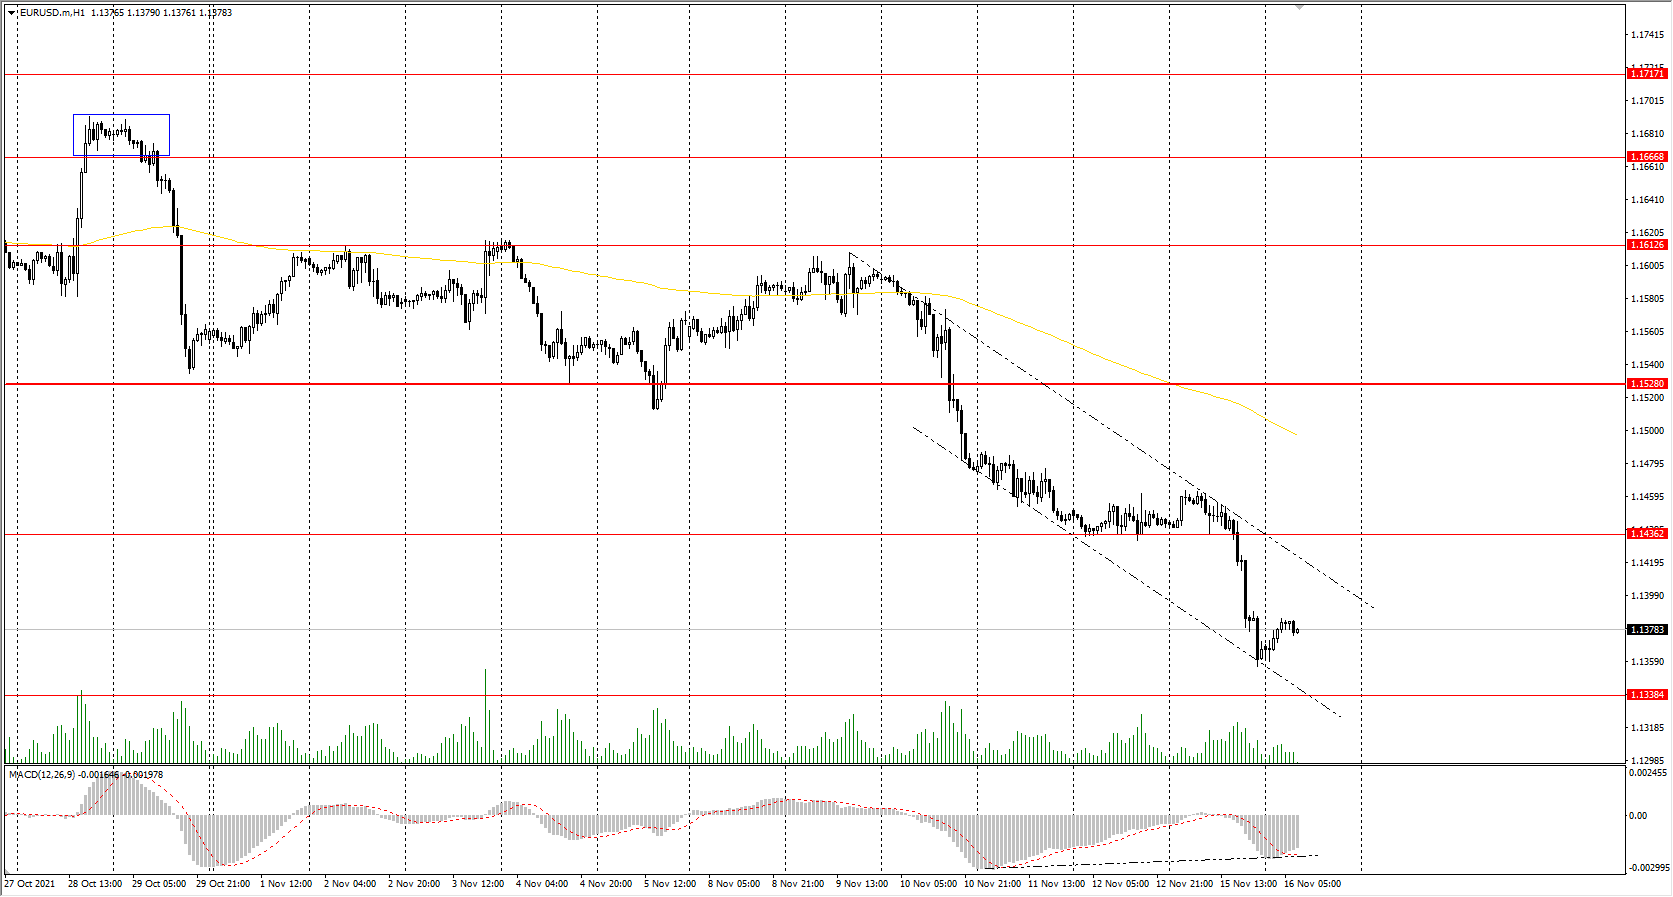
Prev Open: 1.1444
Prev Close: 1.1366
% chg. over the last day: -0.69%
Deutsche Bank is calling on the ECB to tighten its monetary policy as inflation rises. Tomorrow new data on the consumer price index in Europe will be published. The growth in inflation may be a reason for the ECB to consider reducing its bond-buying program at the next ECB meeting.
Trading recommendations
Support levels: 1.3338
Resistance levels: 1.1436, 1.1528, 1.1613, 1.1667, 1.1717
From the technical point of view, the EUR/USD on the hour time frame is bearish. The Euro continues to decline against the US dollar. The MACD indicator is in the negative zone, but a divergence indicates a coming correction. Under such market conditions, traders should consider sell positions from the resistance levels near the moving average, as the price has deviated strongly from the averages. Buy trades should be considered only from the support levels of the higher timeframe, given the buyers’ initiative, but only with short targets.
Alternative scenario: if the price breaks out through the 1.1528 resistance level and fixes above, the mid-term uptrend will likely resume.
News feed for 2021.11.16:
- Eurozone GDP (q/q) at 12:00 (GMT+2);
- US Retail Sales (m/m) at 15:30 (GMT+2);
- US Industrial Production (m/m) at 16:15 (GMT+2);
- ECB President Lagarde’s Speech at 18:10 (GMT+2);
- US FOMC Member Barkin speaks at 19:00 (GMT+2);
- US FOMC Member Bostic speaks at 19:00 (GMT+2);
- US FOMC Member Daly speaks at 22:30 (GMT+2).
The GBP/USD currency pair
Technical indicators of the currency pair:
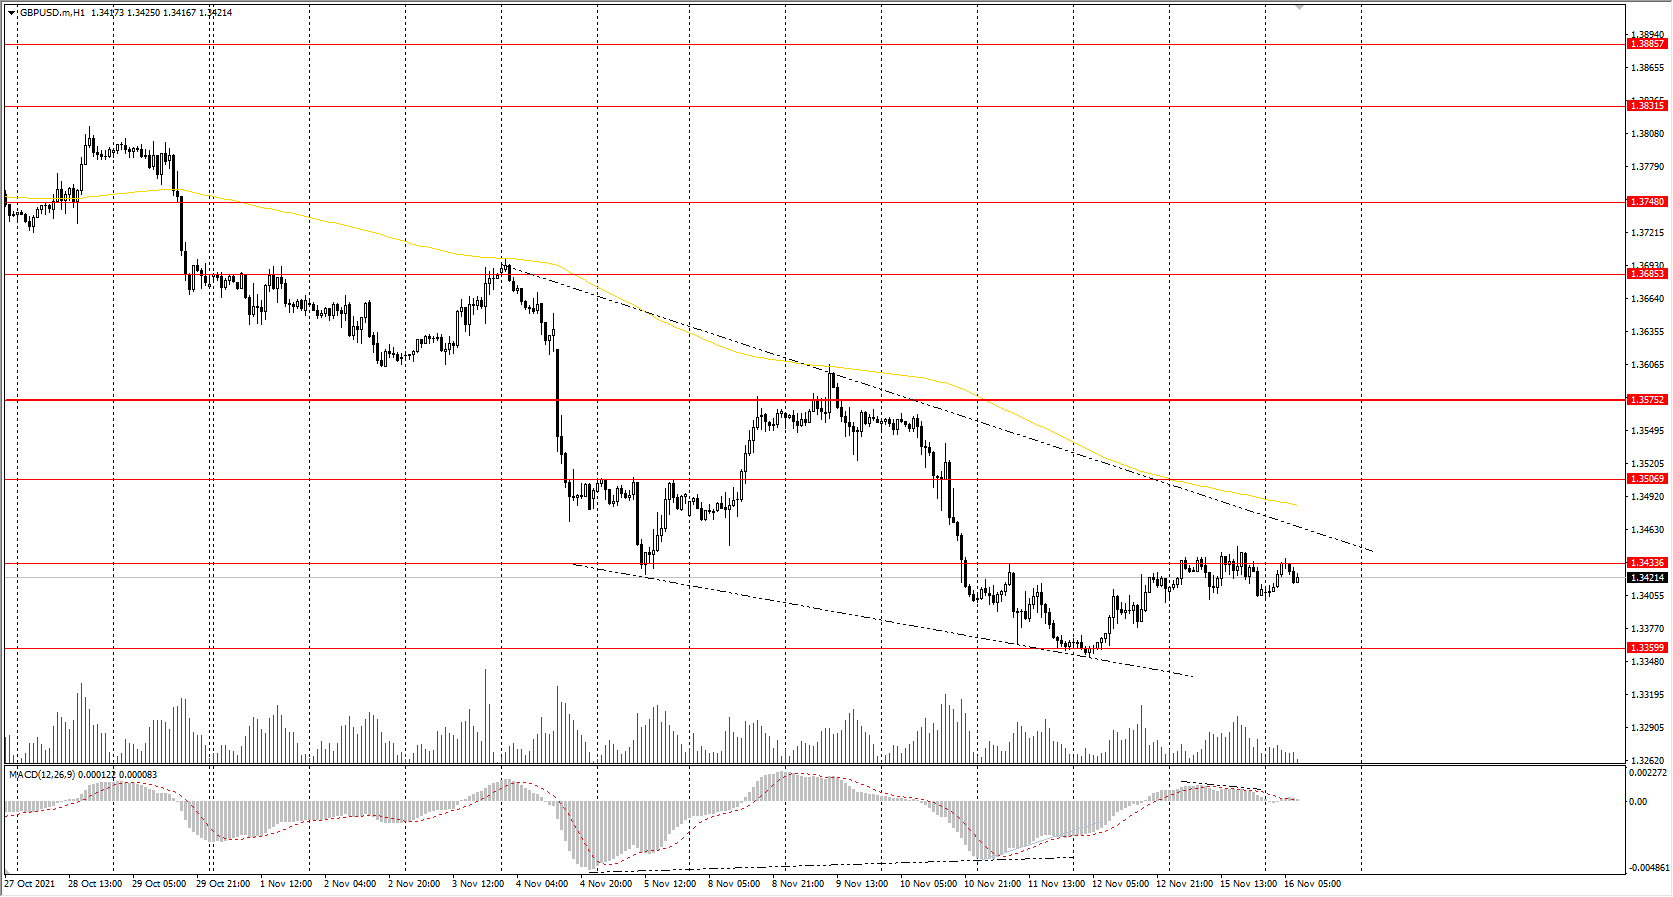
Prev Open: 1.3410
Prev Close: 1.3411
% chg. over the last day: +0.01%
Despite the growth of illnesses all over Europe, the UK is not going to introduce restrictions at the moment. Today, there will be a lot of macroeconomic statistics on the British labor market, so traders should keep a close eye on the currency pairs with the British pound. Amid rumors of an interest rate hike by the Bank of England, the British pound looks more stable than the euro.
Trading recommendations
Support levels: 1.3360
Resistance levels: 1.3434, 1.3507, 1.3575, 1.3685, 1.3748
On the hourly time frame, the trend on GBP/USD is bearish. The MACD indicator has become inactive. Under such market conditions, traders should consider sell positions from the resistance levels near the moving average since the price has deviated strongly from the averages. Buy trades should be considered only from the support levels of the higher timeframe, given the buyer’s initiative.
Alternative scenario: if the price breaks out through the 1.3575 resistance level and consolidates above, the bullish scenario will likely resume.
News feed for 2021.11.16:
- UK Average Earnings Index (m/m) at 09:00 (GMT+2);
- UK Claimant Count Change (m/m) at 09:00 (GMT+2);
- UK Unemployment Rate (m/m) at 09:00 (GMT+2).
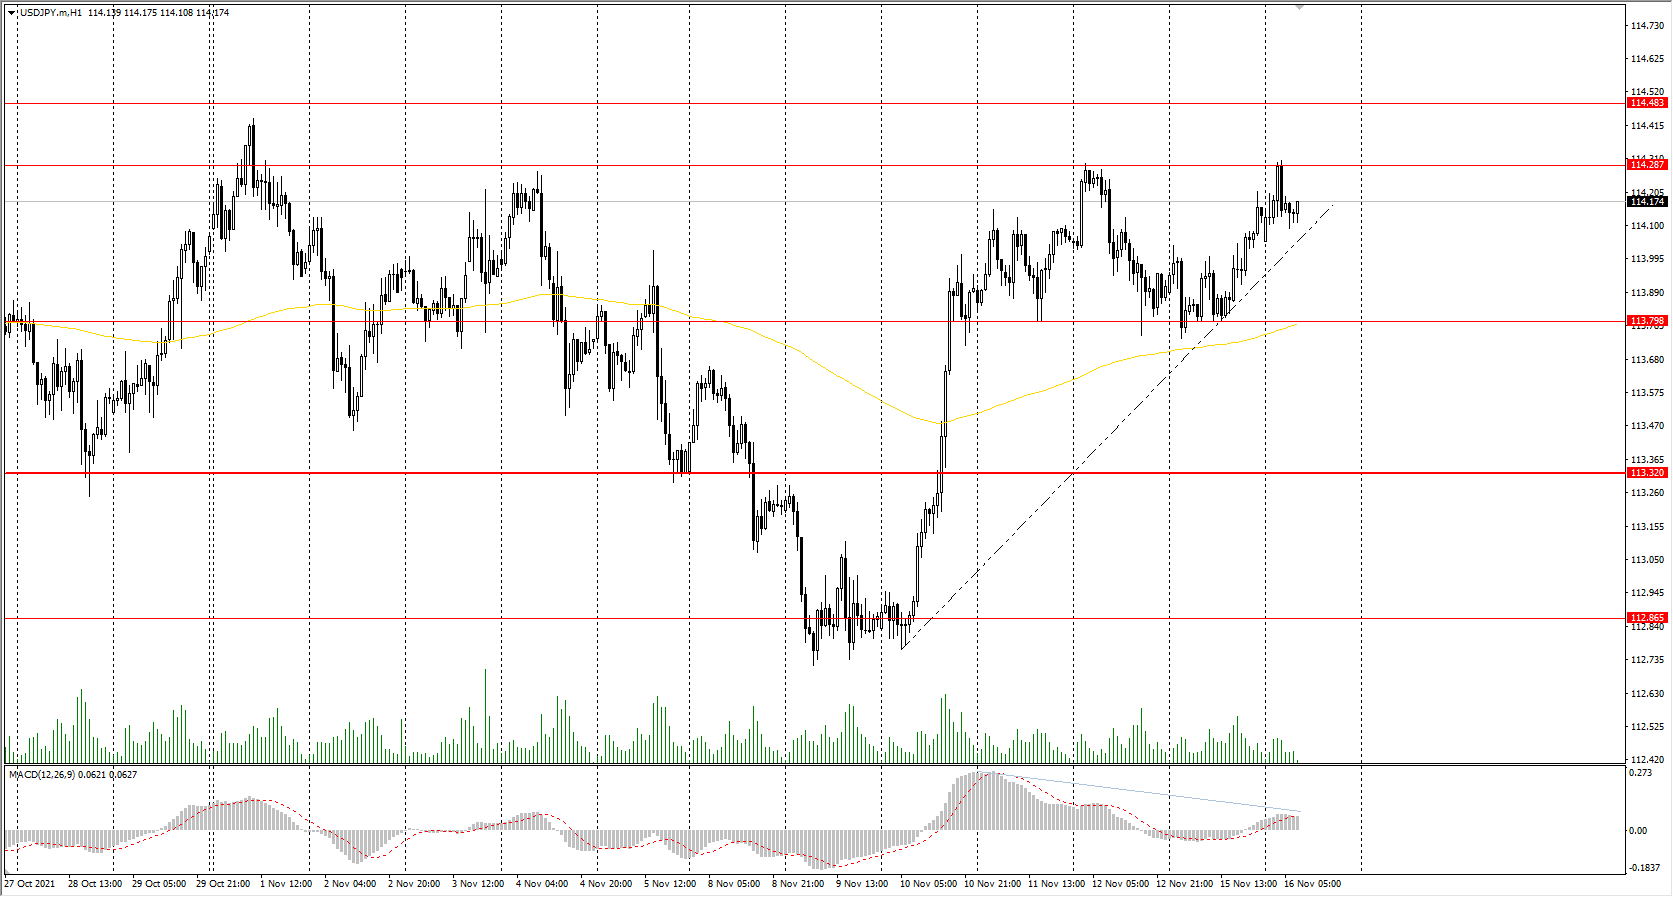
The USD/JPY currency pair
Technical indicators of the currency pair:
Prev Open: 113.89
Prev Close: 114.13
% chg. over the last day: +0.21%
As compared to the previous quarter, Japan's GDP decreased by 0.8% and slowed down to 3.0% in annual terms. This exceeded the expectations since the COVID-19 emergency hit entrepreneurs hard, and the global chip deficit has greatly hit the export of cars. Japan's national currency is currently trending lower as a new stimulus package is on the way.
Trading recommendations
Support levels: 113.79, 113.32, 112.87, 112.30
Resistance levels: 114.29, 114.48, 115.15
The global trend on the USD/JPY currency pair is bullish. At the moment, the price is trading in the price corridor. Under such market conditions, it’s better to look for buy positions from the buyers' initiative zone near the moving average or from the lower border of the corridor. Sell positions should be considered from the resistance levels of higher time frames, given there is sellers' initiative, but only with short targets.
Alternative scenario: if the price falls below 113.32, the uptrend will likely be broken.
The USD/CAD currency pair
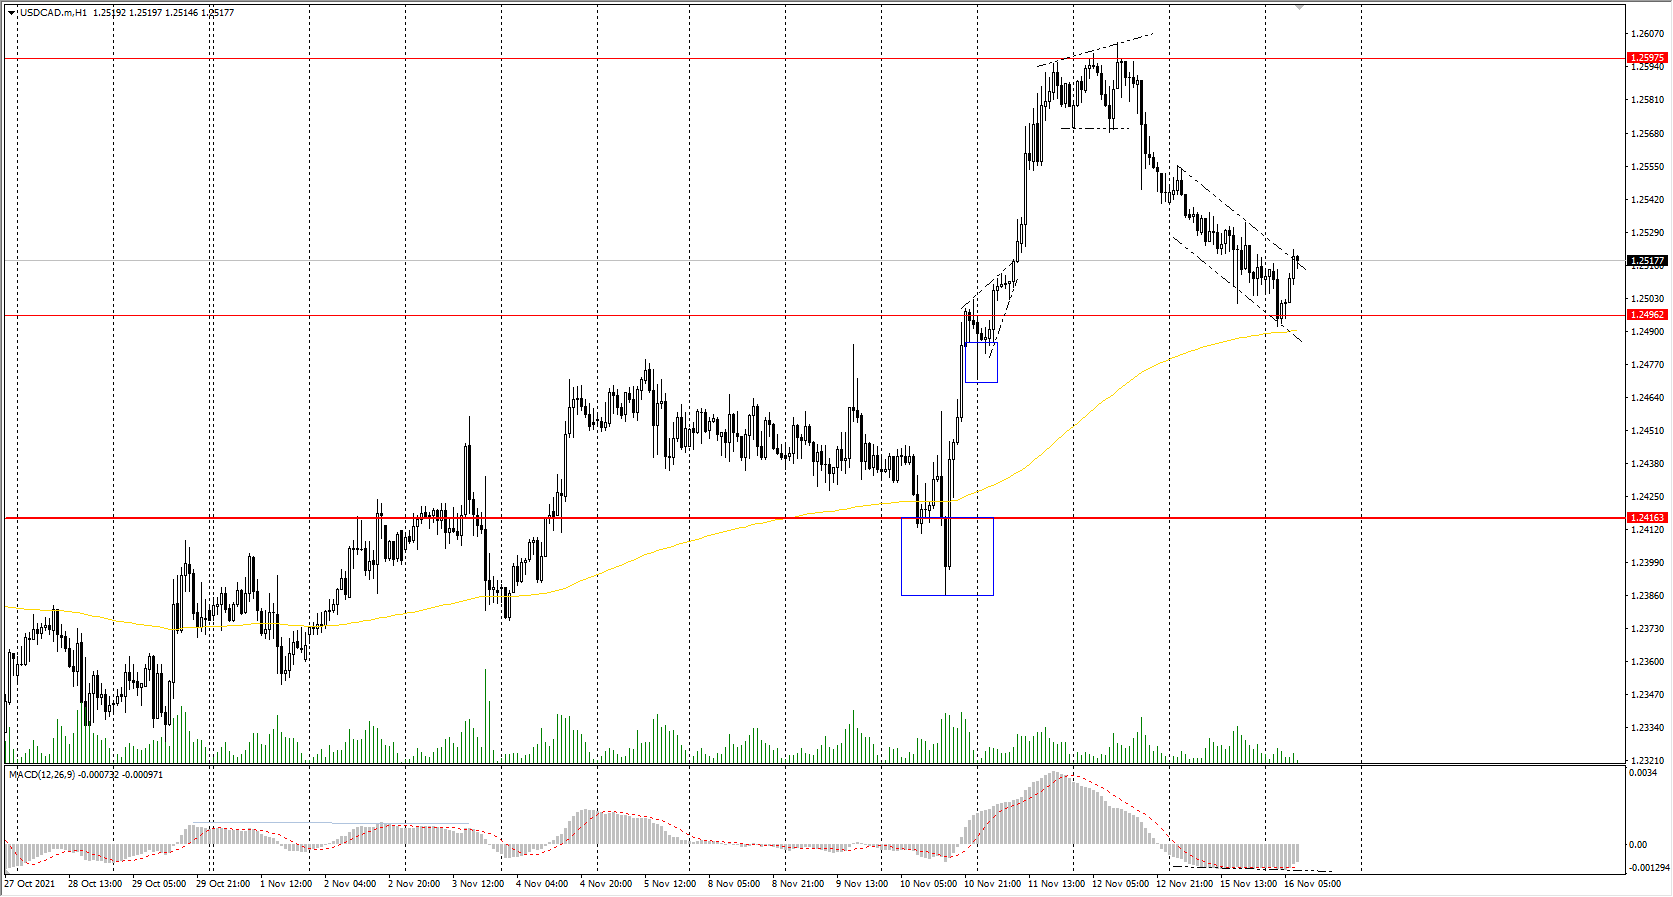
Technical indicators of the currency pair:
Prev Open: 1.2541
Prev Close: 1.2511
% chg. over the last day: -0.24%
The Canadian dollar is a commodity currency, so the USD/CAD currency pair highly depends on the dynamics of the dollar index and oil prices. Yesterday, both the dollar index and oil prices increased. But oil prices increased more confidently. As a result, the USD/CAD currency pair slightly decreased due to the strengthening of the Canadian dollar. Fundamentally, both the dollar index and oil quotes have an upward trend now, so USD/CAD will be traded flat in the medium term.
Trading recommendations
Support levels: 1.2496, 1.2416, 1.2388
Resistance levels: 1.2598, 1.2628, 1.2729
From a technical point of view, the trend of the USD/CAD currency is bullish. The MACD indicator is in the negative zone, but with signs of divergence. Under such market conditions, it is better to look for buy trades from the support levels near the moving average. Sell deals should be considered from the resistance levels of the higher time frame.
Alternative scenario: if the price breaks down through the 1.2416 support level and fixes below, the downtrend will likely resume.
Daily Technical Analysis
EUR/USD
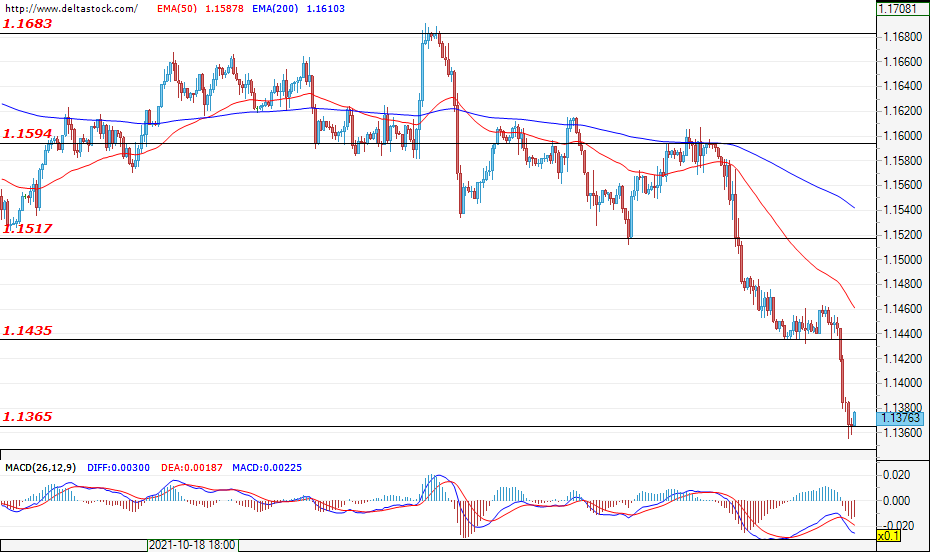
Current level - 1.1376
On the first trading day of the week, the appreciation of the U.S. dollar continued and, after the successful violation of the support zone at 1.1435, the bears have managed to maintain their control over the market, thus leading the pair towards a test of the support at 1.1365. The most probable scenario for today’s trading session is for the currency pair to make a corrective move towards the resistance at 1.1435, and for trading to remain in the range between 1.1365 and 1.1435. However, if the bears continue to pressure the market and manage to overcome the support level at 1.1365, this would strengthen the negative expectations for a move towards the next support at 1.1300. Today, an increase in market activity can be expected around the announcement of the retail sales data (13:30 GMT) and the industrial production data for the United States (14:15 GMT).
| Resistance | Support | ||
| intraday | intraweek | intraday | intraweek |
| 1.1435 | 1.1600 | 1.1370 | 1.1260 |
| 1.1517 | 1.1680 | 1.1300 | 1.1200 |
USD/JPY
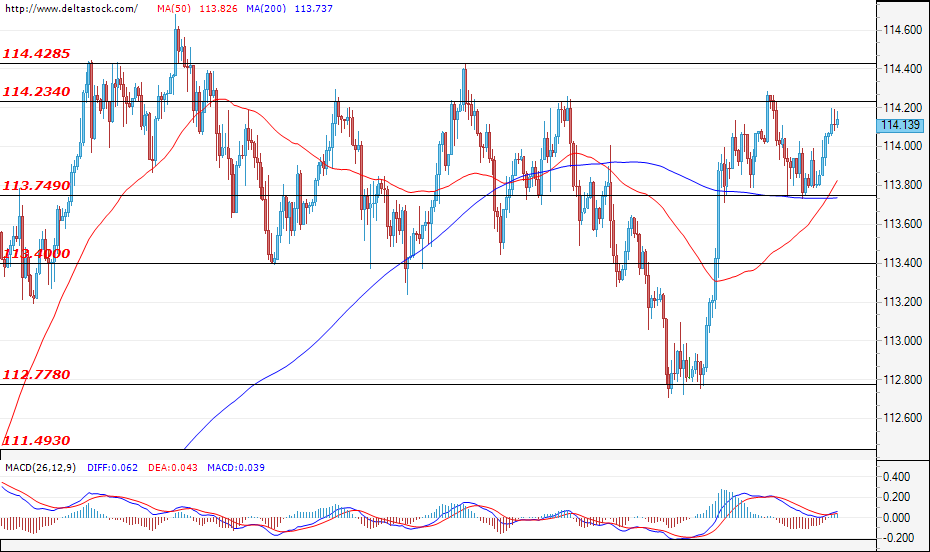
Current level - 114.14
At the time of writing this analysis, the currency pair is trading just below the resistance at 114.23 and the bulls are likely to try and attack this level. A successful breach of this resistance would allow the bulls to gain momentum and lead the pair towards the next resistance at 114.42. The Ninja is still bound to the narrow range between 113.74 and 114.42 and only a confirmed breach of the resistance at 114.42 would suggest that the range phase has ended, which would pave the way for the currency pair towards the resistance at 115.50. In the opposite direction, the first important support is found at the level of 113.74.
| Resistance | Support | ||
| intraday | intraweek | intraday | intraweek |
| 114.20 | 115.50 | 113.75 | 112.77 |
| 114.40 | 117.00 | 113.40 | 111.50 |
GBP/USD
Current level - 1.3420
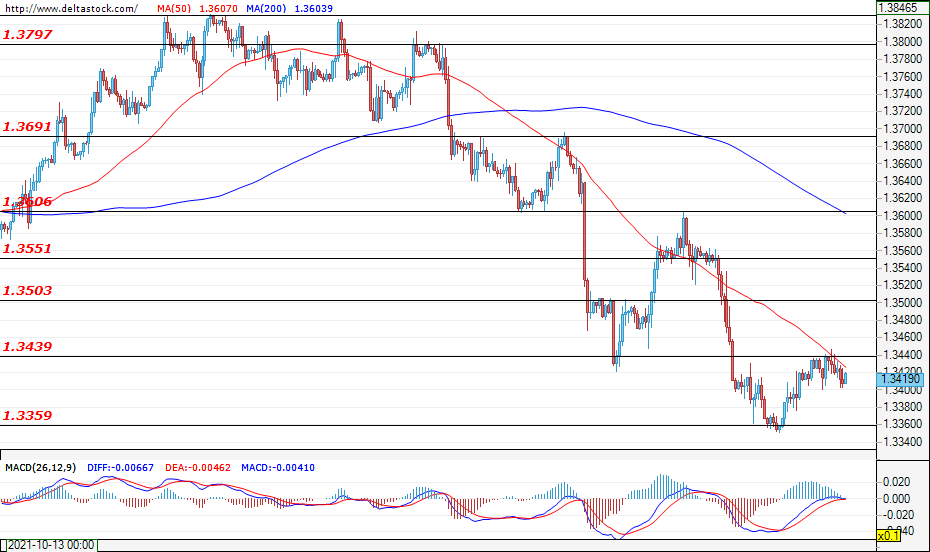
The currency pair is currently trading in the range between 1.3359 and 1.3439 after the bears lost momentum and couldn’t overcome the support at 1.3359. The forecasts for today’s trading session are for the pair to retest the support at 1.3359 and a successful breach of the mentioned level would pave the way for the pair towards the support at 1.3290. On the other hand, a breach of the resistance at 1.3439 may lead the pair towards the next resistance at 1.3503.
| Resistance | Support | ||
| intraday | intraweek | intraday | intraweek |
| 1.3440 | 1.3550 | 1.3360 | 1.3200 |
| 1.3500 | 1.3600 | 1.3290 | 1.3200 |
GBPUSD Pulls Back Off 11-Month Low, Remains In Descending Channel
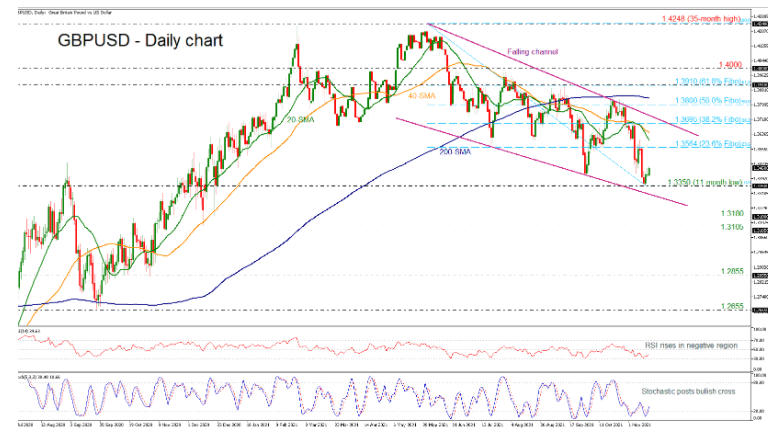
GBPUSD bounced off the 11-month low of 1.3350, holding in a long-term descending channel. Technically, the RSI is rising in the negative region, while the %K line and the %D line of the stochastic oscillator posted a bullish crossover in the bearish area. However, the 20- and 40-day simple moving averages (SMAs) created negative cross in the short-term.
If the pair extends its recent structure to the upside, immediate resistance could come from the 23.6% Fibonacci retracement level of the down leg from 1.4248 to 1.3350 at 1.3564. Even higher, the price could touch the 20- and 40-day SMAs at 1.3600 and 1.3650 respectively ahead of the 38.2% Fibonacci at 1.3695 and the downtrend line at 1.3725.
In the negative region, in case of steeper losses, the market could drop beneath the 11-month trough of 1.3350, hitting the return line of the pattern around 1.3300. Below that, the downward move could be endorsed with the 1.3180 and 1.3105 supports coming next.
All in all, GBPUSD has been struggling within a downward sloping channel over the last five months, and only a jump higher beyond the downtrend line and the 200-day SMA at 1.3830 may shift this outlook to neutral.
Core Bonds Recoup Some Losses
Markets
While we would label the US Empire Manufacturing index as data of secondary importance, markets yesterday clearly disagreed. The sentiment indicator jumped more than expected from 19.8 to 30.9. Even though the 6m forward looking component was much less convincing, it triggered a sharp intraday rise in US bond yields in – admittedly – a lower-volume session. Inflation expectations accounted for two thirds of the move as the price component advanced to the second-highest reading on record. The curve bear steepened with changes ranging from 0.4 bps (2y) over 4.4 bps (7y) to 7 bps (20y). The 10y camped back north of 1.6%. German yields jumped in lockstep but bear flattened instead, ignoring ECB’s Lagarde trying to quash rate hike bets before the European Parliament. Rates rose 5.2 bps (2y) to 2.5 bps (30y). The firmer short-end rate support for the euro proved no match for the technical charts. EUR/USD succumbed and lost support from both the downward sloping trend line (connecting June- Oct lows) and the interim June 2020 high (1.1422) to finish sub 1.14 for the first time in more than a year. The trade-weighted DXY headed further north (95.4) in the upward sloping trend channel. The euro also fell against a resilient sterling. The BoE before UK Parliament stuck to its view that normalizing policy is necessary but it first wants more evidence on the labour market strength. EUR/GBP gave up the 0.85 big figure again. Cable ventured above 1.34.
It’s quiet during Asian dealings today. The Chinese yuan’s strength is noticeable following a constructive summit between US president Biden and his counterpart Xi Jinping. USD/CNY trades at 6.37. The Australian dollar retreats from its intraday high as RBA governor Lowe sought to push back against early tightening bets (see below.) EUR/USD licks its wounds after yesterday’s technical break. The pair trades near 1.137. Core bonds recoup some losses.
US retail sales grab market’s attention today. Consensus lies at 1.5% m/m for the headline series (0.9% control group). We see some minor risks for a downward surprise, having last week’s U. of Michigan survey in mind where US consumers cited searing inflation as eroding purchasing power. Having the technical charts in favour, it may not hurt the USD that much, especially against an ailing euro. After yesterday’s sharp rise, a disappointing report could weigh on core/US bond yields in a daily perspective. The UK labour market report came in strong this morning, allaying some of the BoE’s fears and strengthening the case for a rate hike once again. EUR/GBP weakens towards 0.846. First meaningful support kicks in at 0.845 before the 2021 low of 0.84.
News headlines
RBA governor Lowe again tried to push back against early rate hike bets. Latest data and forecasts do not warrant an increase in the cash rate in 2022. It would need considerable changes to growth/inflation outlook for the RBA to even contemplate it. Australian inflation is only just above the bottom of the 2–3% target range. Lowe thinks that wages will need to grow at 3 point something to sustain price pressure around the middle of that target range. AUD/USD trades a tad softer this morning near 0.734. Australian yields follow the new global repositioning move higher though with the curve bear steepening this morning. The very long end of the curve adds up to 6.5 bps with the front end 2.2 bps higher.
CNB deputy governor Nidetzky said that the central bank’s two-week repo rate will move somewhere above 3% at the turn of the year. The key rate currently stands at 2.75% following an unexpectedly aggressive 125 bps hike earlier this month. The CNB at that same meeting had a discussion about the peak level of interest rates and the pace for reaching it. Autumn forecasts suggested that it could be around 3.75% compared to a neutral rate of around 2.5- 3%. Czech inflation is projected to peak around 7% early next year with demand and supply pressures equally responsible for the move. The CNB with its tightening cycle tries to influence the demand part. EUR/CZK trades stable near the recent bottom of 25.20.
RBA Governor’s Speech and minutes of November board meeting
RBA Governor signals enquiry into Unconventional Monetary Policy Tools; wages growth front and centre of the policy outlook; and emphasises the Board’s patience on rate lift off.
Today we have seen two important communications from the Reserve Bank.
The Minutes of the November Board repeated the messages from the Governor’s Statement and later speech on November 2
However, the Minutes did reveal that the Board plans an enquiry into the Yield Curve Target Policy that was introduced in March 2020 and cancelled following the November Board meeting. Later in the day the Governor expanded on those intentions to cover all the extraordinary measures – YCT; QE; TFF and forward guidance that were introduced during the Covid related emergencies.
The Speech and Key Messages
The Governor discussed the dynamics of the recent surge in inflation overseas in terms of the rebalancing of spending between goods and services. In the G7 goods consumption had lifted by 10% since 2019 whereas services spending was down by around 7%
Supply of goods had been constrained by lockdowns; demand was boosted by fiscal payments while the pressures on logistics from the demand surge boosted freight and other transport costs.
He noted that central banks and International Agencies expected that these inflation pressures would subside in 2022 as supply disruptions eased and spending rebalanced away from goods to services. He noted that the IMF was forecasting a return to around 2% inflation in G7 in 2022.
The key issue was how labour markets respond to the current surge in prices. It would be unusual if prices and wages were not moving together.
In particular the risks were around higher prices boosting inflationary expectations and wage norms.
A period of higher wages growth would have a persistent effect on overall inflation.
A significant issue here was going to be the balance between demand and supply of labour. This is seen to represent a major difference between US/UK /NZ and Australia/ Asia/ Europe.
Policies in Australia and Japan to allow workers to remain attached to their employers during COVID have ensured that participation and employment are sustainable when compared with the US where the participation rate has remained stubbornly low. A more flexible labour supply can contain wage pressures when the demand for labour rises as economies reopen.
A further test here will come with the strong demand for services as economies reopen.
He argues that we are already seeing this dynamic play out as wages growth is surging in US and UK while it has been contained in Australia and Japan.
In turning directly to Australia he plays down the recent surprise lift in underlying inflation as it “remains lower than the average of the past three decades.”
He notes the supply- demand imbalance showing in the cost of building materials; the supply shock effect on some imported durables; although there are important differences with the US/UK/ Europe.
The cost of electricity has been falling in Australia with the surge in renewables while overseas power systems struggle to meet demand.
But he puts considerable weight on the inertia of Australia’s wage setting system – annual minimum wage agreements; 2–3 year enterprise agreements; and public sector wage policies that move slowly.
Of course, that inertia is not prevalent in the informal bargaining sector while the possibility of industrial action as workers feel threatened by rising cost of living in the face of labour shortages could threaten the “inertia” theory.
A potential change of government by May might also have implications for the minimum wage setting result.
This leads to the key foundation for the Governor’s confidence that market pricing for multiple rate hikes in 2022 will prove misplaced, “we are expecting a gradual pick up in wages growth as the labour market tightens”.
Most importantly “We are using wages growth as one of the guideposts in assessing progress towards our goal and whether inflation is sustainably in the target zone.”
Of course, one nagging uncertainty that he often refers to is the link between the forecast unemployment rate of 4.25% by end 2022 (Westpac is 3.8%) and wages since we have not seen such a low unemployment rate since before the GFC and a 4% unemployment rate since he 1970’s.
How wages growth responds to such labour market tightness is a key issue of uncertainty for policy.
He ends his speech with a similar message to the Minutes, “It is likely to take time to meet the condition we have set for an increase in the cash rate and the Board is prepared to be patient.”
Question and Answer
The Governor provided his usual direct perceptive answers to a set of high quality questions as we have come to expect from the Australian Business Economists.
When asked about the mismatch between his guidance and market pricing he pointed to a different reaction function between the market and the RBA.
RBA does not target house prices; pace of inflation pick up required by the market to justify hikes by mid year would require wages growth to quickly lift to above 3% – given his views on the inertia of wages growth seems very low probability.
He was more balanced on the issues of the level of spare capacity in the labour market – pointing to high underemployment and the possibility of a significant lift in supply as international borders reopen – relieving skilled shortages as well as relief for hospitality and agriculture with foreign students and “back packers” returning.
When asked how he would react to 3%+ on underlying inflation but 2–2.5% on wages growth (implying negative productivity growth) he argued that such a configuration would question the sustainability of the lift in inflation and he would be inclined to “look through” the high inflation print.
This point emphasises the importance of the wages picture as the measure of sustainability.
Arguably, the risk in relying on the Wage Price Index with its inbuilt inertia is that it is sending a misleading signal about the likely build up in wage pressures. Most likely, in assessing the quality of the WPI signal the RBA should be weighing up other aspects of the labour market just as the FOMC uses a number of measures for “maximum employment.”
In the body of the speech the Governor pointed out that the markets expected peaks in the policy rates would be much lower than in previous cycles. So it was with great interest that he speculated that the Australian peak might be around 3.5% – a positive 1% real neutral rate. He noted the zero productivity growth implication behind a peak rate of 2.5% (zero real).
He argued that he expected that savers would not be satisfied with another era of negative real rates but overlooked the implications of positive real rates for highly leveraged asset markets and the feedback effects of sharp falls in those markets on the economy.
He tantalised the audience with a commentary on the trajectory of inflation and wages. The policy response to a sharp trajectory would be different to a slow grind, presumably for the same absolute level of inflation or wages growth. For the market, which is expecting that first move around mid year the December and March quarter Wage Price Index prints will need to show that rapid upswing in the trajectory. And bear in mind that the nation and business in particular will be in tight election mode Businesses are not known for bold decisions like changing the approach to wage setting when faced with the uncertainty of an election.
He noted the key criteria for the decision at the February Board on the bond buying program. Last week Westpac forecast that the program would be cut from $4 billion to $2 billion per week with the program to expire at the May Board. While confirming that the actions of other central banks and the smooth functioning of the bond market would be considerations for the decision he emphasised that the Bank’s forecasts would be “as important as the actual data.” With the forecasts unlikely to change sufficiently to drop the program altogether we remain comfortable with or view.
He clarified the use of market pricing for the interest rate profile used for the forecasts that were released for the November Statement on Monetary Policy. While the Bank had a very different view to market pricing he argued that due to the lags in monetary policy the impact on the forecasts would not be significant until 2024 and 2025 – beyond the two year forecasting horizon.
Since the RBA adopted the policy of not acting until the conditions were actually achieved rather than being pre-emptive we have not heard much about lags in policy. This just emphasises the importance of the trajectory; achieving the objectives with a steep trajectory would trigger a very different response than a more gradual trajectory.
Finally, we came back to the decision on QE in February. The Governor argued that market stability had returned after the abandoning of YCT as measured by bid/offer spreads but market practitioners noted that the market still needed more liquidity. The Governor opined that the RBA’s holdings of bonds (around 36% of bonds on issue by February) may be a factor although the markets’ interest rate expectations were a more likely cause.
Conclusion
The rule I have learnt over decades of analysing policy is that if a central banker gives a clear indication of what he intends doing in the near term then listen.
That near term probably extends into the first half of 2022.
But after that it does become a forecasting game. We expect that, at 4.25%, the RBA is too cautious on the likely fall in the unemployment rate in 2022. We are forecasting 3.8% – lowest since the 70’s. That should raise concerns that the inertia in the WPI might be sending unreliable signals.
At 3.8% the unemployment rate would move the wages/ employment dynamic into unprecedented territory and we can see a trajectory on inflation and wages growth building in the second half of 2022 that would satisfy the Bank.
It would set the scene for the first hike in February 2023.
The attraction of returning in the new year with a fresh policy approach has played out on numerous occasions especially now that the Governor now gives a traditional speech at the National Press Club about the year ahead.
We do hear the arguments about the inertia of the Wage Price Index so the lift in the growth rate we are expecting to 2.75% which would be announced in the November 2022 print would seem to be sufficient to justify lift off if it has a clear upward trajectory; the inflation condition has been met for two quarters, and the unemployment rate is the lowest since the 1970’s.
As usual the Governor has given another masterful analysis of the big issues around inflation; wages; and employment.
We are all focussed on that timing of lift off. But perhaps the more important issue is his assessment of the likely peak in the cash rate in the cycle (3.5%).
That thinking which compares with other cycles looks to overlook the key feedback effect from over leverage; richly priced asset markets; and financial conditions which are likely to call a halt to that next cycle well before that 3.5%.
Perhaps financial markets are too exuberant about the early timing of the first move in this next cycle but equally they are much closer to the mark on the peak in the cycle than the Governor and other central bankers.
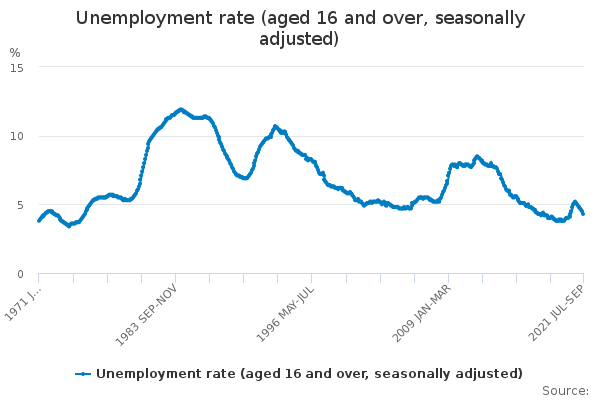
UK unemployment rate dropped to 4.3%, employment rate rose to 75.4%
UK unemployment rate dropped to 4.3% in the three months to September, down from 4.5%, better than expectation of 4.5%. Employment rate rose 0.4% to 75.4%, "driven by a record high net flow from unemployment to employment". Payrolled employment rose 160k.
Wage growth disappointed, however, with average earnings excluding bonus up 4.9% 3moy versus expectation of 6.0%. Average earnings including bonus rose 5.8% 3moy, versus expectation of 7.0%. in October, claimant count dropped -14.9k.
GBP/JPY Daily Outlook
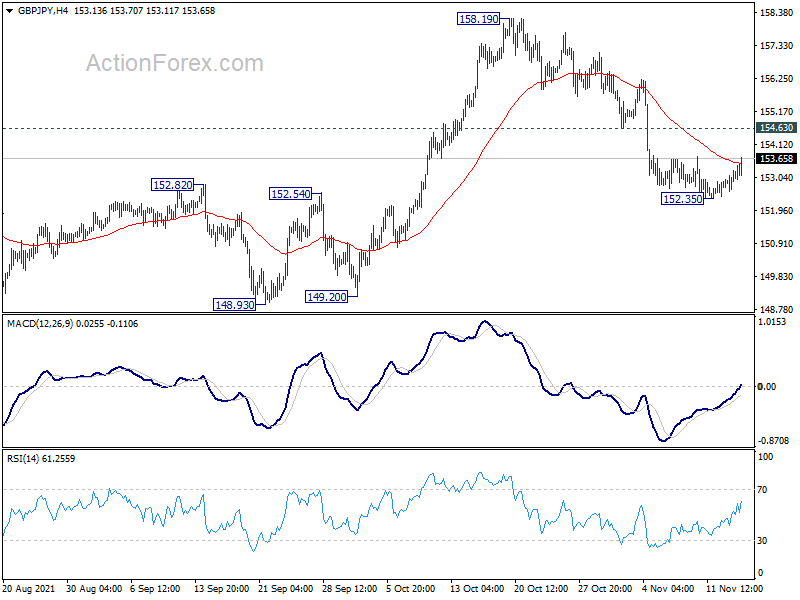
Daily Pivots: (S1) 152.49; (P) 152.71; (R1) 153.05; More...
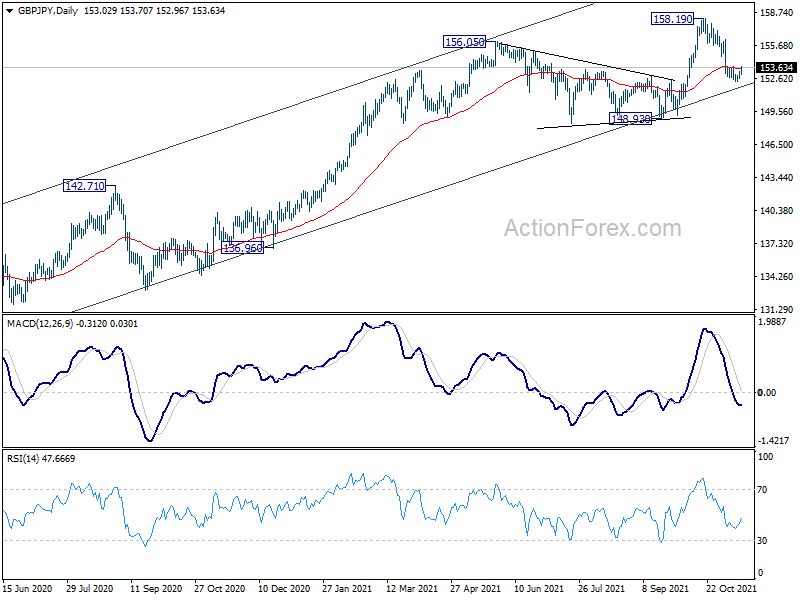
Intraday bias in GBP/JPY remains neutral as consolidation form 152.35 is extending. Further fall is expected as long as 154.63 resistance holds. On the downside, below 152.35 will resume the fall from 158.19 towards 148.93 key support next. On the upside, though, break of 154.63 minor resistance will turn bias back to the upside for retesting 158.19 high.
In the bigger picture, rise from 123.94 is seen as the third leg of the pattern from 122.75 (2016 low). The stay above 55 week EMA affirms medium term bullishness. Current rise should now target 61.8% retracement 195.86 (2015 high) to 122.75 at 167.93 next. In any case, outlook will remain bullish as long as 148.93 structural support hold, even in case of deep pull back.
Gold Price Soars As Investors Rush To Inflation Hedges
US stocks wavered on Monday as investors continued to worry about inflation and the potential for Fed tightening. The Dow Jones rose by 13 points while the S&P 500 and Nasdaq 100 indices declined slightly. Among the top movers were Royal Dutch Shell, Oatly, and Tesla. Shell shares rose after the company said that it will change its structure and move its tax base to the UK. Government officials in the Netherlands have launched a bid to keep the company in the country.
Oatly shares crashed by more than 22% after the company warned about growth. Tesla shares crashed by more than 4% as Elon Musk continued to offload his stake in the company. The other top stocks to watch this week will be retailers like Walmart, Target, and Costco that will publish their earnings. Nvidia, the biggest chip company in the world will also publish its results.
The US dollar strengthened in the overnight session as investors waited for the upcoming retail sales data. The numbers, which will come out in the afternoon session, are expected to show that the overall retail sales held steady in October even as prices surged. The headline sales are expected to have risen by 1.2% on a month-on-month basis. Core retail sales are expected to have risen by 1.0% in October. Other key American numbers that will come out are industrial and manufacturing production and export and import price index.
The economic calendar will have some key events today. In the UK, the Office of National Statistics (ONS) will publish the latest employment numbers. These numbers are expected to show that the country’s unemployment rate declined to 4.4% in September. Other important data will be the US GDP numbers. Based on the first GDP estimate, analysts expect that the economy expanded by 3.7% on a year-on-year basis. Christine Lagarde will also deliver a speech that could have an impact on the euro.
BTCUSD
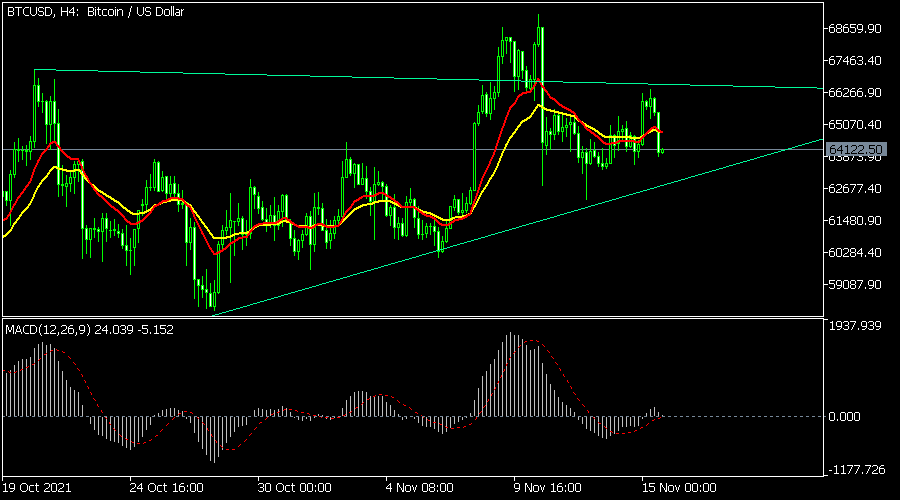
The BTCUSD pair retreated as investors sold the Taproot upgrade news. On the four-hour chart, the pair is still above the ascending trendline that is shown in green. It also seems it is forming a rising wedge, which is usually a bearish sign. The pair is also along with the 25-day moving average. In addition to the rising wedge, the pair has also formed a small head and shoulders pattern. Therefore, the pair will likely break out lower in the near term.
EURUSD
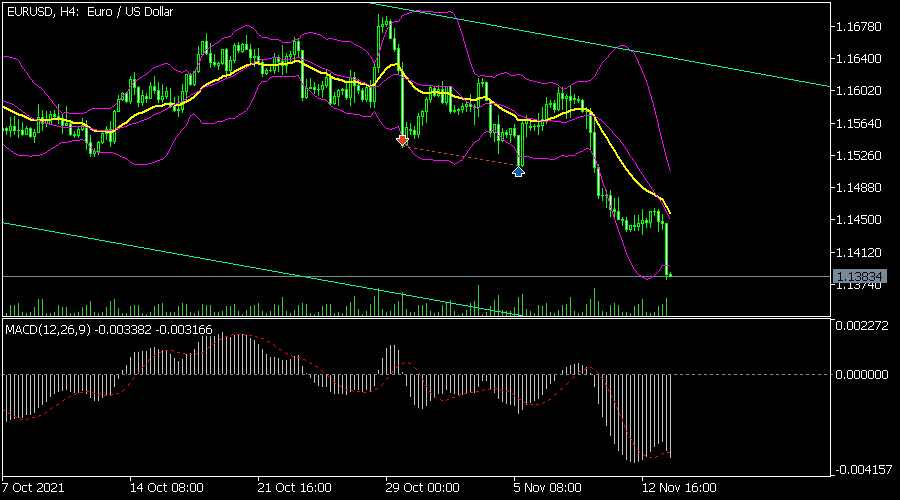
The EURUSD sell-off accelerated in the overnight session after Joe Biden signed the infrastructure package. The pair managed to move to a low of 1.1385. It also moved to the lower side of the Bollinger Bands. Also, it has dropped below the 25-day and 50-day moving averages while the MACD has continued falling. While the pair will likely keep falling, there is a possibility that it will have a relief rally in the near term.
XAUUSD
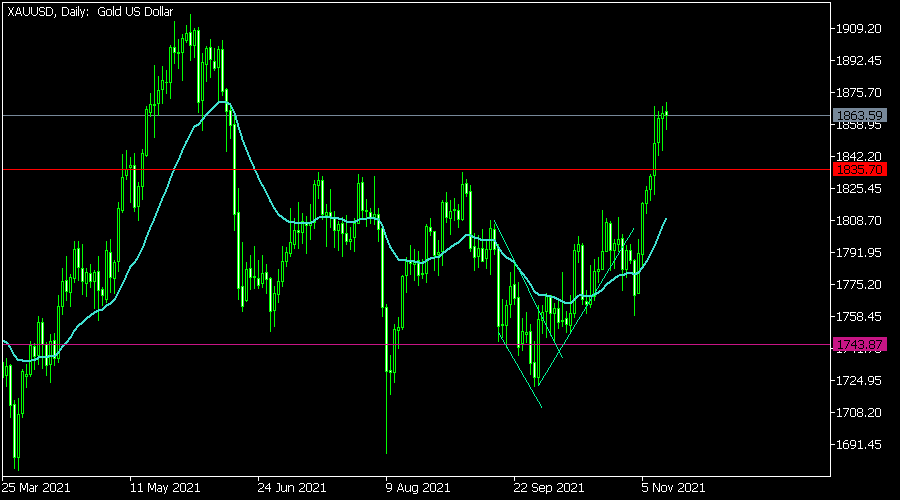
The XAUUSD pair rallied to the highest level since June as demand for gold rose. This action was mostly because of the rising demand for inflation hedges. On the daily chart, it has moved above the key resistance at 1,835. It is also above the 25-day moving average while the RSI has also risen. Therefore, the pair will likely keep rising as bulls target the resistance at 1.1900.
EUR/JPY Daily Outlook
Daily Pivots: (S1) 129.43; (P) 130.01; (R1) 130.35; More....
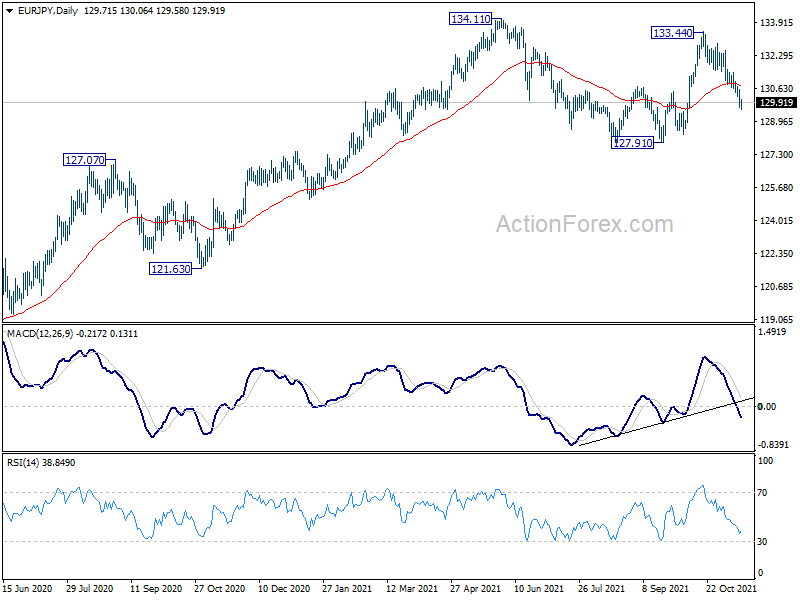
Intraday bias in EUR/JPY stays on the downside as fall from 133.44 is still in progress. Deeper decline would be seen for 127.91 key support. On the upside, however, break of 131.40 minor resistance will turn bias back to the upside for stronger rebound, probably back to retest 133.44 high.
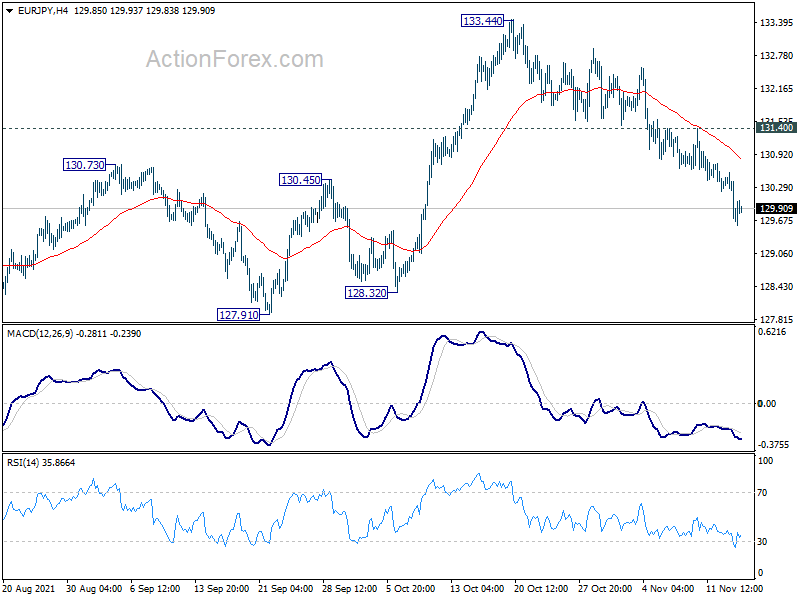
In the bigger picture, rise from 114.42 (2020 low) is still in progress and the strong support support from 55 week EMA affirms medium term bullishness. Further rise would be seen to retest 137.49 (2018 high). Decisive break there will resume the whole long term rise from 109.03 (2016 low). Next target will be 100% projection of 109.03 to 137.49 from 114.42 at 142.88. This will now remain the favored case as long as 127.91 support holds.