Sample Category Title
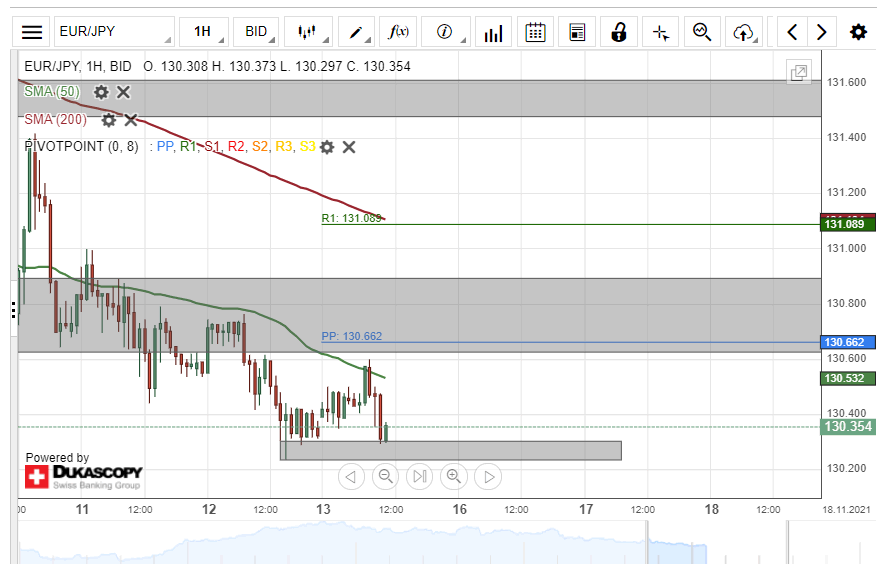
EUR/JPY Retraces Up To A Moving Average
On Friday, the EUR/JPY found support in the 130.20/130.30 range. The following recovery lasted into Monday's Asian trading hours, as the pair retraced up to the resistance of the 50-hour simple moving average. By the middle of the day, the SMA appeared to have stopped the pair's recovery.
In the case that the rate declines, it would first look for support at 130.20/130.30. Afterwards, the pair could look for support in the 130.00 mark, before reaching the weekly S1 simple pivot point at 129.90.
However, a potential surge of the pair could find resistance in the 50-hour simple moving average near 130.50. Above the 130.50 mark, a resistance zone is located from 130.60 up to 130.90. In addition, the weekly simple pivot point was located at 130.66.
Cautious Tone Ahead Of Risk Events, Dollar Softer
- Stocks are mixed, dollar eases ahead of Biden-Xi meeting, US data, Fed speakers
- Modest lift from upbeat Chinese data as worries about property sector linger
- Yield differentials in driving seat in FX market, gold holds near highs
Subdued start to week amid caution
It was a relatively subdued start to the week across financial markets on Monday as stocks, bonds and the dollar were still reeling from last week’s US CPI shock. The panic and fallout from the jump in US inflation to a three-decade high have subsided a little as the Fed is not seen to be changing course just yet. Comments over the weekend by Minneapolis Fed President Neel Kashkari that there was no need to “overreact to some of these temporary factors” soothed fears that the Fed might accelerate its tapering timetable.
With a raft of other Fed officials scheduled to speak this week, investors will be on the lookout for any shifts in the transitory narrative following the latest inflation scare.
Wall Street skidded, while Treasury yields shot up, propelling the greenback to 16-month highs, as US CPI hit 6.2%. The S&P 500 and Nasdaq Composite have since posted a decent rebound and bond yields appear to be retreating slightly, but there’s still the October retail sales report on Tuesday to get through.
After decelerating in Q3, the US economy is gaining momentum again, with a pickup in vaccination rates supporting the positive picture even as many other countries are seeing fresh spikes in virus cases. The Fed is less likely to remain patient should growth outperform expectations in the next few months.
Mood in equities may be brightening as Biden-Xi meeting eyed
US stock futures were last trading marginally higher and European shares also firmed after a wobbly start. Most Asian indices also managed to reverse earlier losses to end the session higher, with the exception of Chinese stocks.
China posted stronger-than-expected growth in industrial output and retail sales in October, which seem to have come as a relief as the data had been falling short of estimates in recent months. But although this lifted the mood slightly globally, concerns about China’s highly over-leveraged property sector are still weighing on domestic investors’ minds.
New home prices fell for the second straight month in October in data published earlier today, amid the downturn in the real estate industry as authorities try to rein in borrowing in the sector.
Meanwhile, tensions with the United States over Taiwan have resurfaced lately, adding to the importance of today’s virtual summit between President Joe Biden and President Xi Jinping. For the markets, however, the main focus will be on whether the two leaders can find enough common ground to pave the way for a reduction in some of the Trump-era tariffs.
With Biden under pressure to tackle the soaring cost of living in the US, some development on the tariff front cannot be ruled out. Though, the fact that he just signed into law fresh sanctions on China’s tech giants, Huawei and ZTE, doesn’t exactly send very positive signals.
Risky currencies extend rebound as dollar on the backfoot
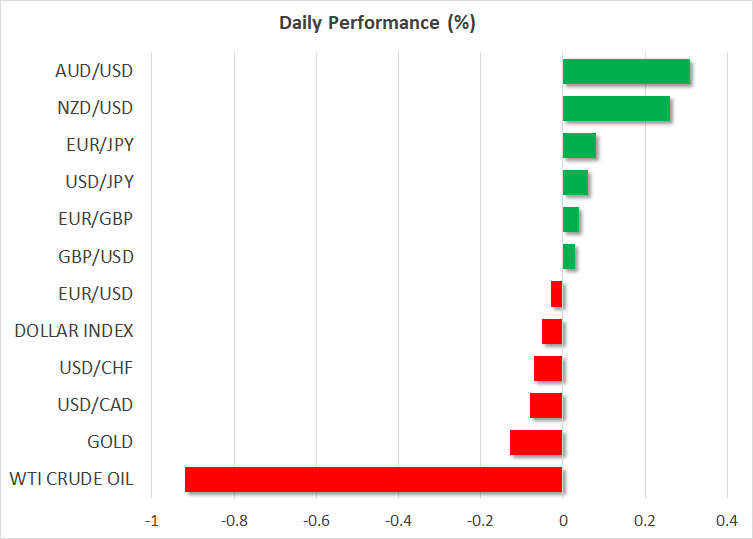
In the FX sphere, the dollar index eased back towards the 95 level but remained stable as the euro and pound struggled to regain positive traction after last week’s tumbles. Reports that the UK and EU may yet be able to work out a solution to the problematic Northern Ireland protocol have boosted sterling versus the euro, but against the greenback, it’s all about yield differentials. UK and Eurozone yields have fallen back quite substantially during November, though the same cannot be said for Canadian, Australian and New Zealand yields.
The aussie and kiwi are both extending their rebound versus their US counterpart, though the loonie lagged as oil prices slipped further on Monday.
The yen was under pressure after GDP data showed the Japanese economy shrunk more than expected in the third quarter.
Gold, meanwhile, held not too far from last week’s five-month highs as the precious metal continues to draw interest for its revived status as an inflation hedge.
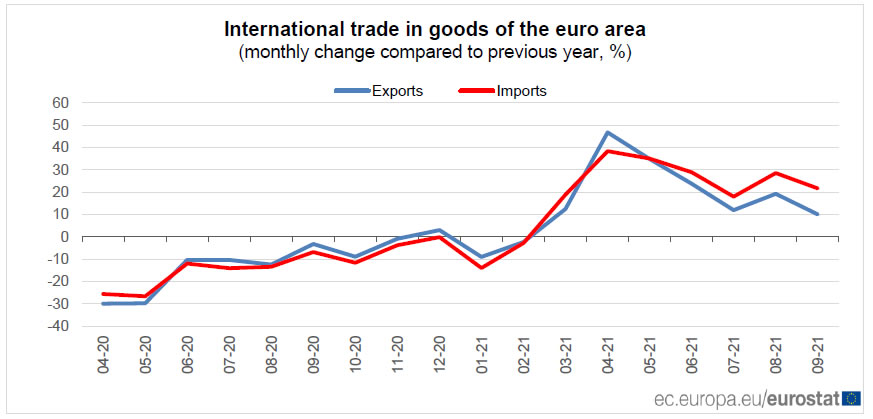
Eurozone exports rose 10.0% yoy in Sep, imports rose 21.6% yoy
Eurozone exports of goods to the rest of the world rose 10.0% yoy to EUR 209.3B in September. Imports rose 21.6% yoy to EUR 202.0B. As a result, Eurozone recorded a EUR 7.3B surplus. Intra-Eurozone trade rose 16.4% yoy to EUR 191.5B.
In seasonally adjusted term, Eurozone exports dropped -0.4% mom to EUR 201.4B. Imports rose 1.5% mom to EUR 195.3%. Trade surplus narrowed to EUR 6.1B. Intra-Eurozone trade rose EUR 0.8B to EUR 182.9B.
The Analytical Overview Of The Main Currency Pairs
The EUR/USD currency pair
Technical indicators of the currency pair:
Prev Open: 1.1451
Prev Close: 1.1443
% chg. over the last day: -0.07%
Inflationary pressures in Germany continue to update records. Wholesale prices in Germany increased to 15.2% in October, the highest level since March 1974. But hedge fund analysts believe inflation in the Eurozone will remain at the same level. The inflation data in Europe will be released Wednesday this week.
Trading recommendations
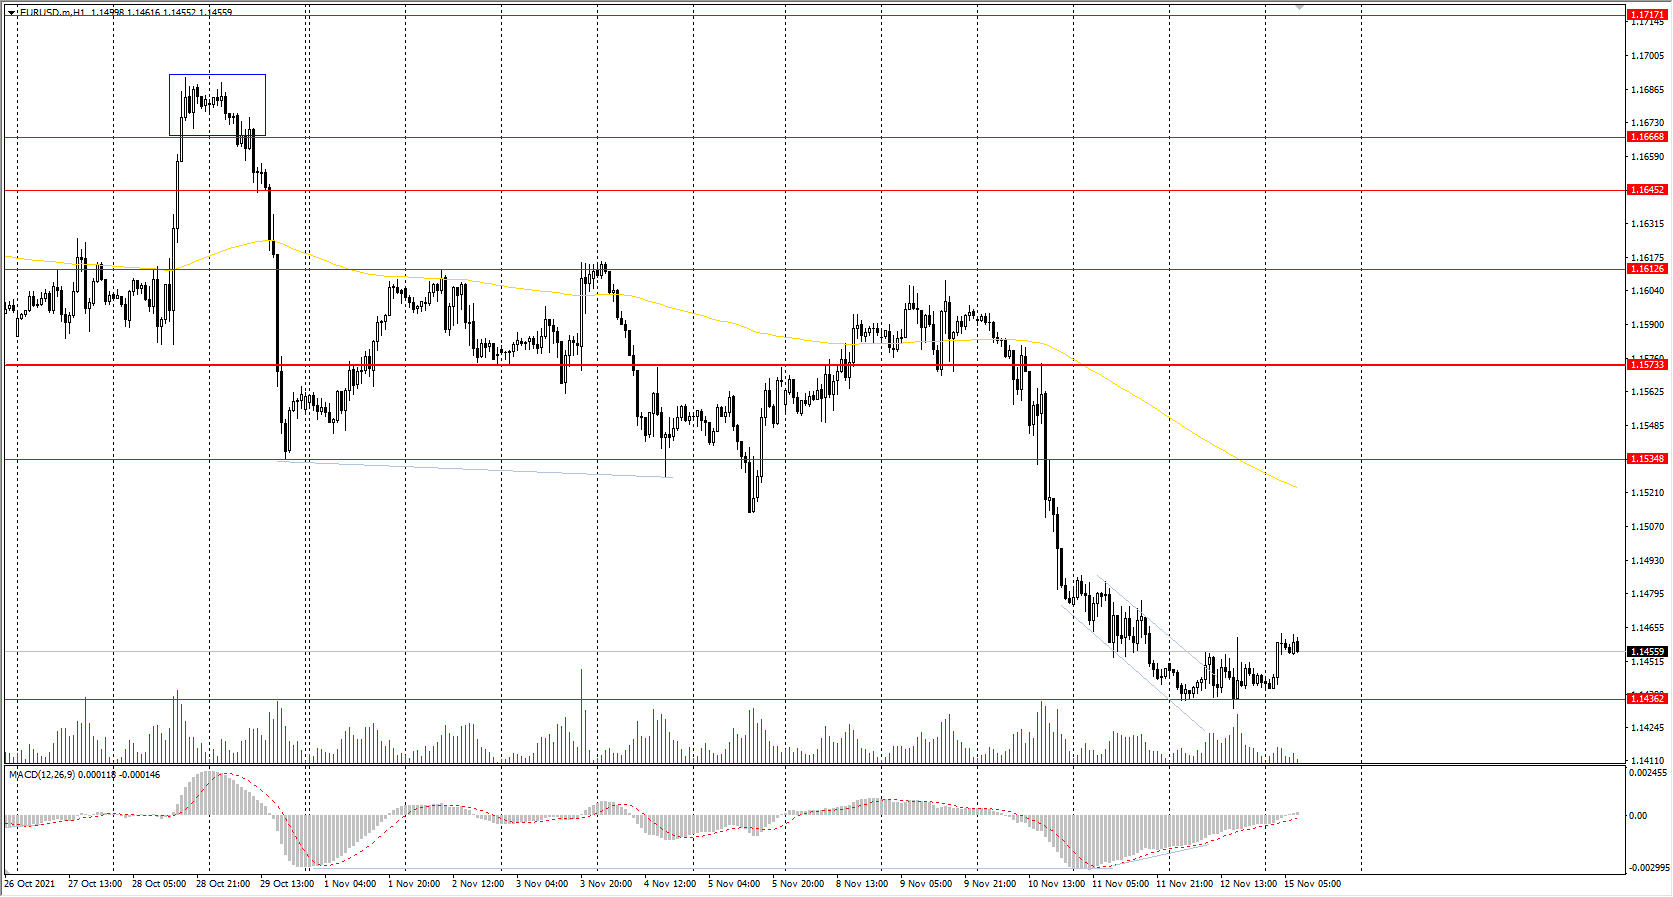
Support levels: 1.1436
Resistance levels: 1.1535, 1.1573, 1.1613, 1.1645, 1.1667, 1.1717, 1.1772
From the technical point of view, the EUR/USD on the hour time frame is bearish. The MACD indicator has become inactive, but traders should expect a technical rebound because of MACD divergence. Under such market conditions, traders should consider sell positions from the resistance levels near the moving average since the price has deviated strongly from the averages. Buy trades should be considered only from the support levels of the higher time frame, given the buyers’ initiative.
Alternative scenario: if the price breaks out through the 1.1573 resistance level and fixes above, the mid-term uptrend will likely resume.
The GBP/USD currency pair
Technical indicators of the currency pair:
Prev Open: 1.3365
Prev Close: 1.3412
% chg. over the last day: +0.35%
At the moment, investors prefer to buy US dollars as the Fed has already started cutting the QE program, while the Bank of England left the monetary policy unchanged at its last meeting. But the rhetoric of the Bank of England Governor changed dramatically last week, who promised that the central bank of England is already preparing to hike interest rates. Last week's UK GDP data was worse than expected, so if this week's inflation data is worse than expected, the British pound could rise sharply on expectations of a rate hike.
Trading recommendations
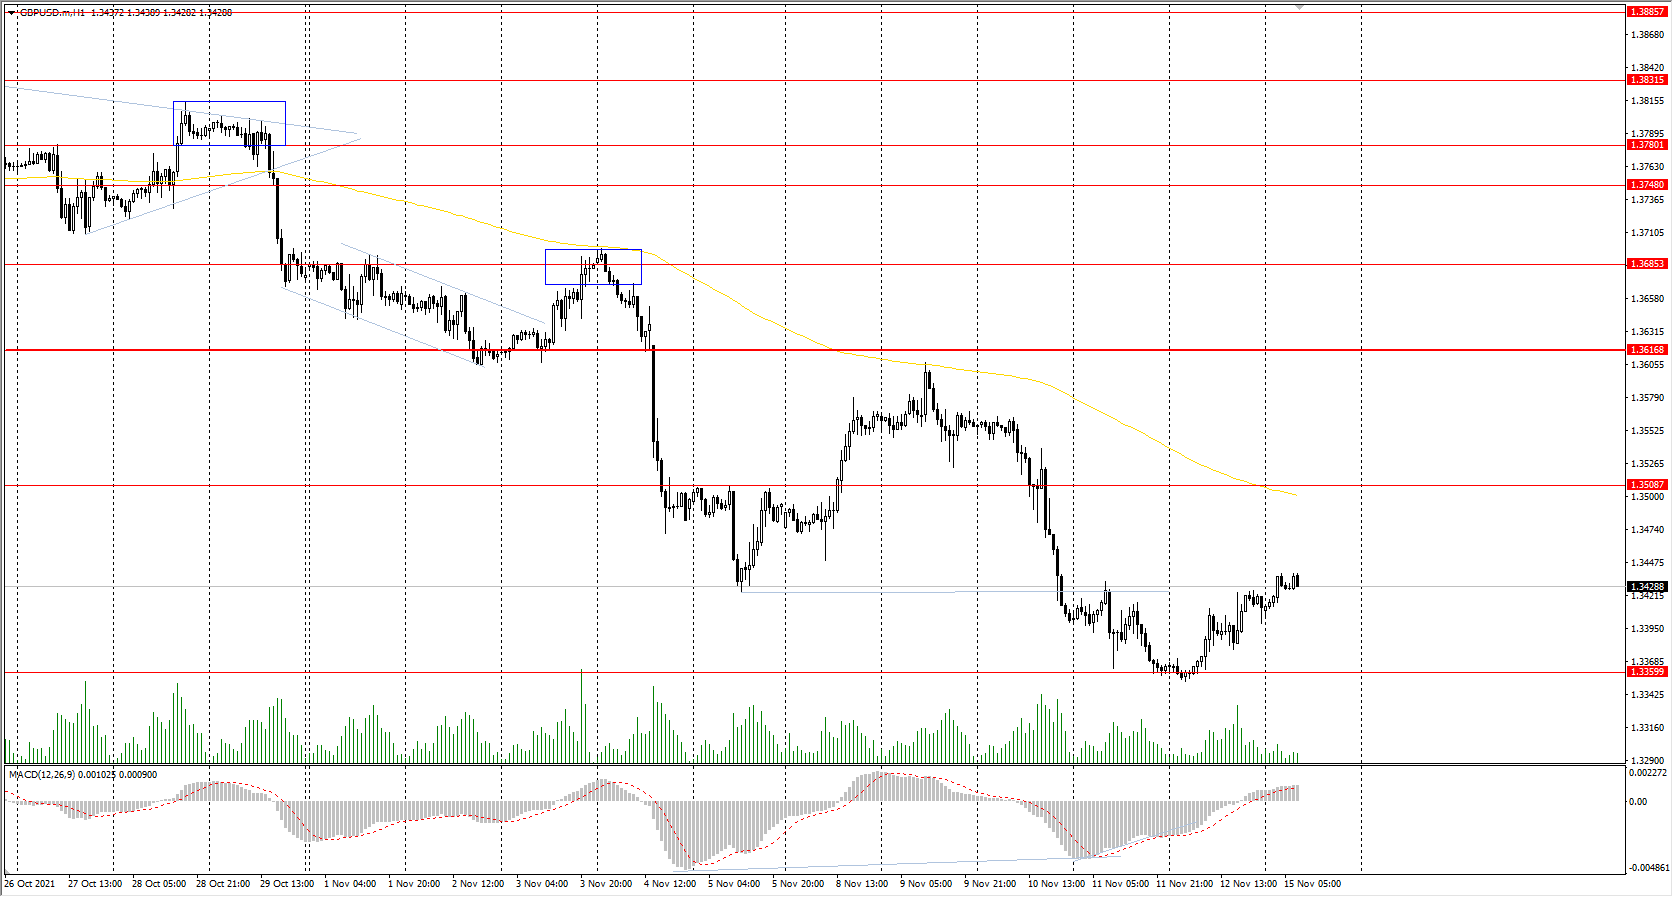
Support levels: 1.3360
Resistance levels: 1.3508, 1.3616, 1.3685, 1.3748, 1.3780, 1.3831, 1.3886
On the hourly time frame, the trend on GBP/USD is bearish. The MACD indicator has become inactive. Under such market conditions, traders should consider sell positions from the resistance levels near the moving average since the price has deviated strongly from the averages. Buy trades should be considered only from the support levels of the higher timeframe, given the buyers’ initiative.
Alternative scenario: if the price breaks out through the 1.3617 resistance level and consolidates above, the bullish scenario will likely resume.
The USD/JPY currency pair
Technical indicators of the currency pair:
Prev Open: 114.05
Prev Close: 113.91
% chg. over the last day: -0.12%
At the moment, there are no fundamental reasons for the USDJPY quotes to go down in the mid-term since the Bank of Japan has kept its monetary policy soft until the end of the year. At the same time, the Fed has been already cutting QE and is likely to accelerate cuts due to a sharp rise in inflation. This week, Japan will report on inflation, but analysts don’t expect any regional inflation rise, so USDJPY quotes are inclined to grow in the mid-term.
Trading recommendations
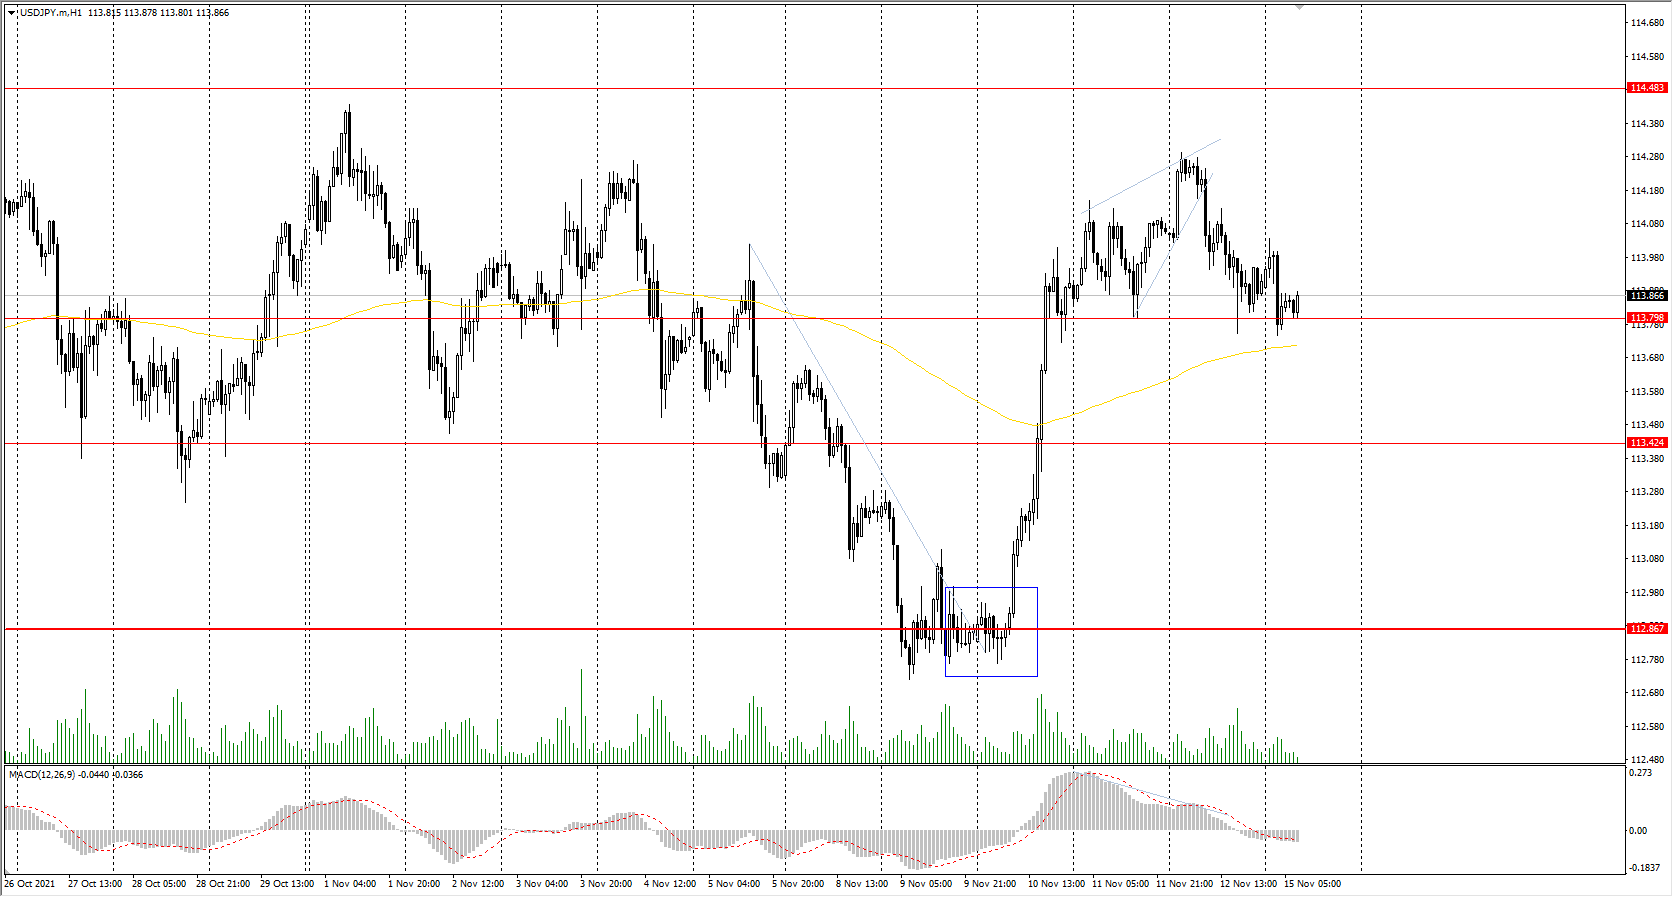
Support levels: 113.42, 112.95, 112.30, 111.53, 110.99, 110.65
Resistance levels: 114.48, 115.15
The global trend on the USD/JPY currency pair is bullish. On Friday, the quotes were slightly decreased because of MACD divergence. Under such market conditions, it’s better to look for buy positions from the buyers' initiative zone near the moving average. Sell positions should be considered from the resistance levels of higher time frames, given there is sellers' initiative, but only with short targets.
Alternative scenario: if the price falls below 112.87, the uptrend will likely be broken.
The USD/CAD currency pair
Technical indicators of the currency pair:
Prev Open: 1.2570
Prev Close: 1.2544
% chg. over the last day: -0.21%
The Canadian dollar is a commodity currency, so the USD/CAD currency pair highly depends on the dollar index dynamics and oil prices. On Friday, the dollar index was trading flat, while oil prices slightly increased, which led to the temporary strengthening of the Canadian dollar and a decrease of USD/CAD quotes. Fundamentally, both the dollar index and oil quotes have an upward trend now, so in the medium term USD/CAD will be trading flat.
Trading recommendations
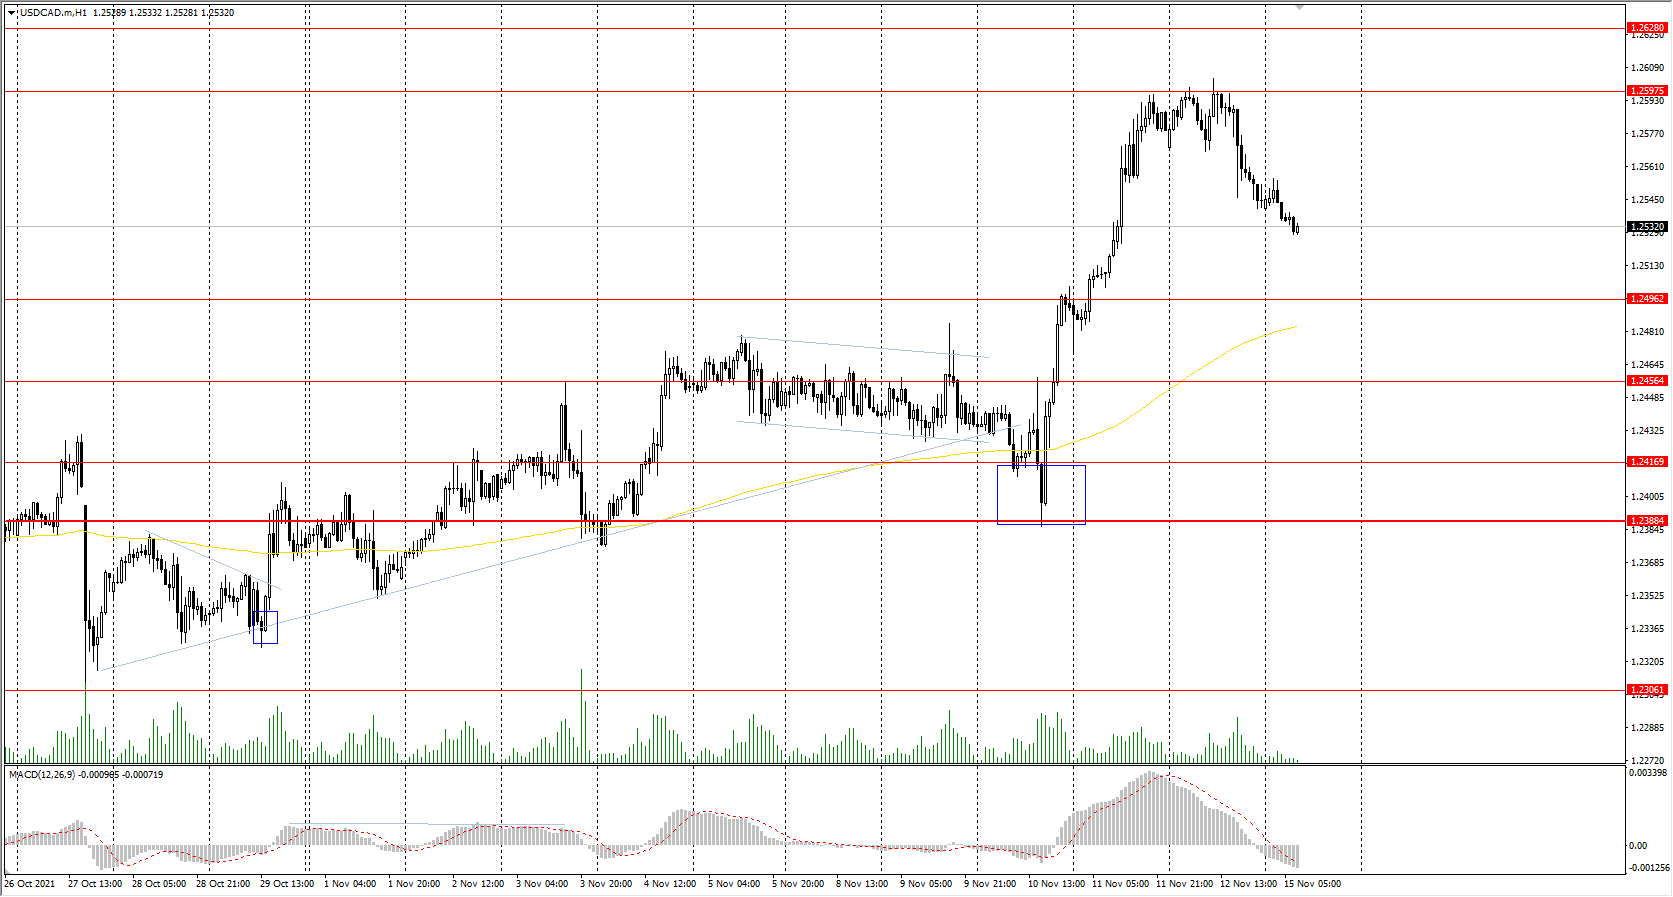
Support levels: 1.2496, 1.2456, 1.2417, 1.2388
Resistance levels: 1.2598, 1.2628, 1.2729, 1.2774
From a technical point of view, the trend of the USD/CAD currency is bullish. The MACD indicator has become inactive. Under such market conditions, it is better to look for buy trades from the support levels near the moving average since the price has strongly deviated from its averages. Sell deals should be considered from the resistance levels of the higher time frame.
Alternative scenario: if the price breaks down through the 1.2388 support level and fixes below, the downtrend will likely resume.
Europe Became The Epicenter Of Covid-19 Pandemic Again
The U.S. stock market ended Friday's trading with growth due to the strengthening of technology and industrial sectors. By the close of the stock market, Dow Jones added 0.50% (-0.87% for the week), S&P 500 increased by 0.72% (-0.40% for the week), technology index NASDAQ added 1.00% (+0.87% for the week). But despite a good growth rate on Friday, all three indices decreased by the end of the week.
The Fed's balance sheet hit a new high on Friday, $8.58 trillion, but is rising at a slower pace as the Fed began reducing its QE program. The Fed's balance sheet is now 37.4 % of US GDP.
On the other hand, large investors and hedge funds still expect the major indices to rise. According to preliminary data, global equity funds saw their largest inflows for the last 10 weeks. Investors bought $11.61 billion of stocks, their largest net purchase since Sept. 1. The US equity funds received $6.29 billion in inflows, European funds received $2.59 billion, while Asian funds received net inflows of $1.72 billion.
Treasury Secretary Janet Yellen said controlling the Covid-19 virus in the US is a key to lower inflation. Yellen expects inflation to fall by the second half of 2022.
The White House's top economic adviser said that President Joe Biden's $1.75 trillion economic bill, which is stuck in Congress, will counter inflation for Americans by reducing the cost of child care, health care, and housing.
European stock indexes traded mixed on Friday. British FTSE 100 index decreased by 0.49% (+0.60% for the week), German DAX added 0.07% (+0.33% for the week), Spanish IBEX 35 decreased by 0.13% (-0.56% for the week), Italian FTSE MIB added 0.36% (-0.15% for the week), and French CAC 40 increased by 0.45% and become a growth leader with +0.71% for the week. Inflationary pressures in Germany continue to update records. Wholesale prices in Germany increased to 15.2% in October, the highest level since March 1974. But hedge fund analysts believe inflation in the Eurozone will remain at the same level. The inflation data in Europe will be released Wednesday this week.
The WHO has called Europe the epicenter of Covid-19 infections one more time. In many countries, the statistics of sick people have increased ten times compared to summer and early fall figures. Most of the severely ill patients are unvaccinated. Starting from November 15, Austrian authorities will impose a 10-day lockdown for citizens who have not been vaccinated against coronavirus. The Danish government is also ready to introduce new restrictions. Denmark is one of the few European countries to cancel almost all Covid measures this September.
The number of new cases of Covid-19 infection in Germany has reached a record high: more than 50 thousand in the past 24 hours. Today, about 16 million people in Germany aged 12 years and above remain unvaccinated. The exception is Spain, which has the highest rate of fully vaccinated population in all of Europe, 89% (in Britain it is 74%), and the lowest rate of infection: 63 cases per 100,000 population.
At the commodities market, futures on orange juice (+9.25%), coffee (+8.97%), wheat (+6.59%), silver (+5.19%), platinum (+5.1%), corn (+4.43%), palladium (+4.31%), soybeans (+3.13%), gold (+2.8%), and copper (+2.54%) showed the biggest gains by the end of the week. Natural gas futures (-13.37%), lumber (-5.73%) and cotton (-1.6%) showed the biggest declines.
Rising oil and natural gas prices are boosting not only black gold but also shale oil production. The US shale oil production is expected to reach 8.68 million barrels per day in December, the highest since March 2020.
Asian stocks traded flat on Friday. Japan's Nikkei increased by 1.13% (-0.43% for the week), Australia's ASX 200 gained 0.83% on Friday (-0.19% for the week), China's benchmark CSI 300 index decreased by 0.31% (+0.98% for the week), while Hong Kong's Hang Seng added 0.32% (+2.36% for the week), the biggest gainer among Asian indices. Late last week, the Chinese real estate developer Evergrande was able to avoid defaulting at the very last moment, which made investors be optimistic. In addition, analysts at Goldman Sachs have also become more optimistic about Chinese stocks. Meanwhile, GDP growth in Hong Kong slowed to 5.4% in Q3.
The Japanese government is preparing a bill to expand funding for local semiconductor manufacturing for Japanese and foreign companies. The bill would allow the government to check the country of origin of any imported computer equipment and block the installation of Chinese-made computer devices for national security purposes.
The Turkish lira hit another anti-record against the dollar on Friday, staying around 10 lira per 1 US dollar, as Turkey's central bank reduced its interest rate again. The Turkish lira has been currently the world's worst-performing currency in 2021, with -25.6% since the beginning of the year.
Main market quotes:
- S&P 500 (F) 4,682.85 +33.58 (+0.72%)
- Dow Jones 36,100.31 +179.08 (+0.50%)
- DAX 16,094.07 +10.96 (+0.07%)
- FTSE 100 7,347.91 −36.27 (−0.49%)
- USD Index 95.12 +0.24 (+0.25%)
Important events for today:
- Japan GDP (q/q) at 01:50 (GMT+2);
- China Retail Sales (m/m) at 04:00 (GMT+2);
- China Industrial Production (m/m) at 04:00 (GMT+2);
- China Unemployment Rate (m/m) at 04:00 (GMT+2);
- Japan Industrial Production (m/m) at 06:30 (GMT+2).
Euro Pressured Amid Reported Covid-19 Wave In Europe
The euro remained close to its lowest level in July 2020 as the market continued to worry about the reportedly rising number of Covid cases in Europe. In the past few weeks, the number of Covid cases has risen in some key countries like Netherlands, Germany, and Austria. As a result, some of these countries have announced some restrictions to curb the spread. At the same time, analysts believe that the situation will worsen in the coming winter months. The currency is also dropping as Brexit continues being a thorn in the side for the region. The UK has threatened to invoke article 16 because of the Northern Ireland situation. That action will lead to more volatility in the region.
The euro and European futures are also struggling because of rising tensions in the region. Last week, the American government warned the European Union that Russia was planning another attack on Ukraine. The report cited the rising number of troops near the Russian and Ukrainian border. Russia has rejected the claim by the Americans. Still, the tensions between the two sides are real. For one, Russia has punished the EU by boosting the price of natural gas. The country is also supporting the Belarusian president in the ongoing migration crisis.
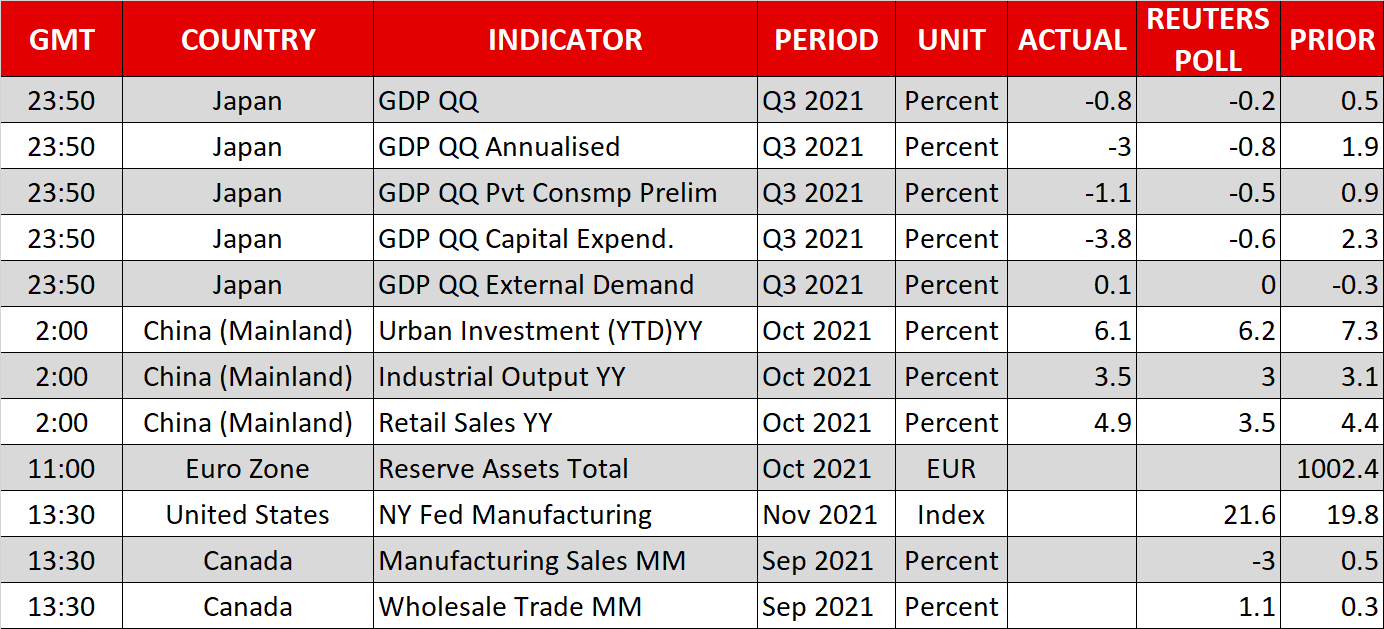
The economic calendar will be relatively muted today. The most important numbers came earlier during the Asian session. Data from Japan showed that the economy contracted by 3.0% in the third quarter. This decline happened as capital expenditure and consumer consumption worsened. Meanwhile, in China, data by the Bureau of Statistics also showed that the country’s industrial production rose by 3.5% in October after rising by 3.1% in September. Other key data to watch will be the Eurozone trade balance, Sweden’s consumer price index (CPI), and Canada’s auto sales.
EURUSD
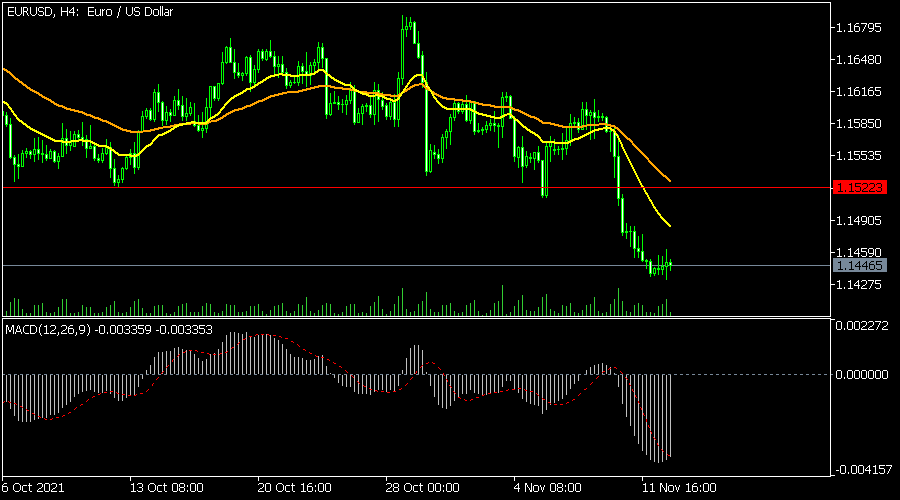
The EURUSD pair has been in a major sell-off in the past few weeks. The pair has managed to move below the key support level at 1.1522, which was the neckline of the head and shoulders pattern. It has also moved below the short and longer-term moving averages. The pair has also moved to the lower side of the Bollinger Bands while the MACD has continued falling. Therefore, the pair will likely have a brief rally this week.
GBPUSD
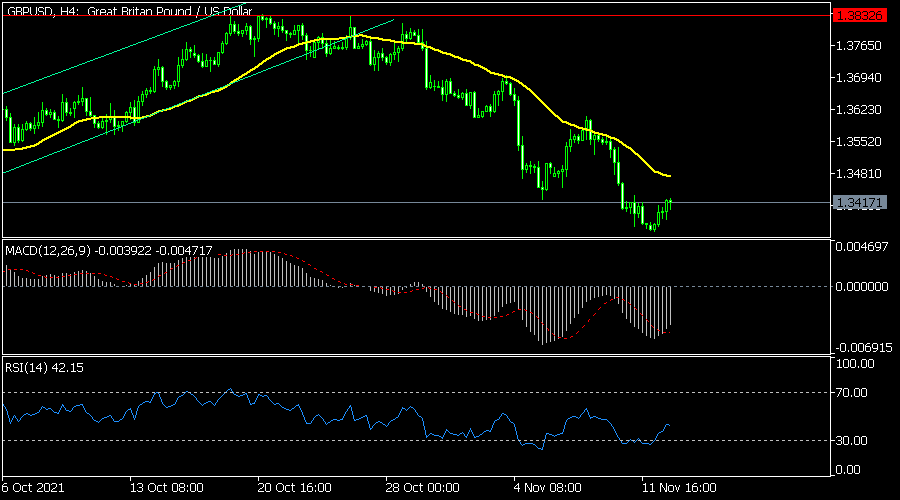
The GBPUSD pair had a difficult week last week. It declined to a multi-month low of 1.3350 as the US dollar strength remained. The pair has made a brief rebound even as the tensions over Brexit resume. It has moved to the middle line of the Bollinger Bands and dropped below the moving averages. The MACD has moved up slightly. Therefore, the pair will likely keep rising as bulls target the key resistance at 1.3400.
USDCAD
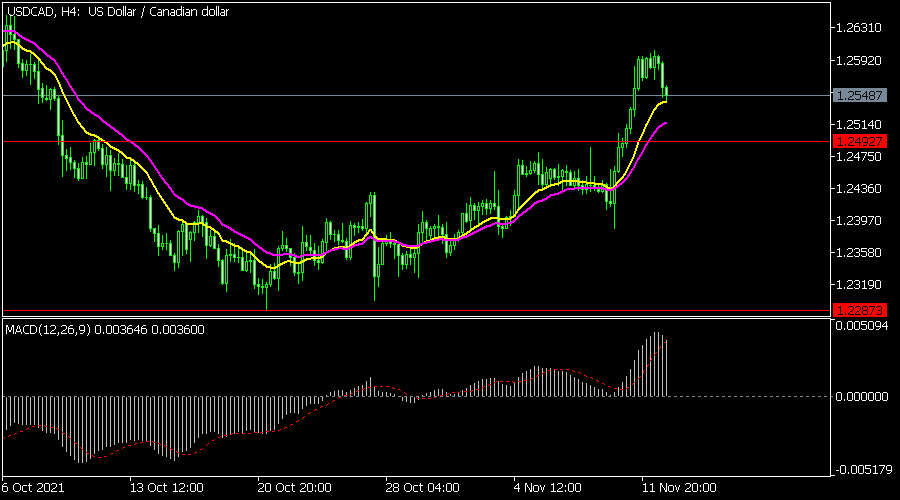
The USDCAD pair declined to a low of 1.2548, which was slightly below the key resistance level at 1.2602. On the four-hour chart, it is above the neckline of the inverted head and shoulders pattern. It is also attempting to move below the 25-day moving average. Therefore, the pair will likely keep falling as bears target the key support at 1.2492. This will be part of the break and retest pattern.
Gold Looks Vulnerable As Ascent Struggles Around 1,870
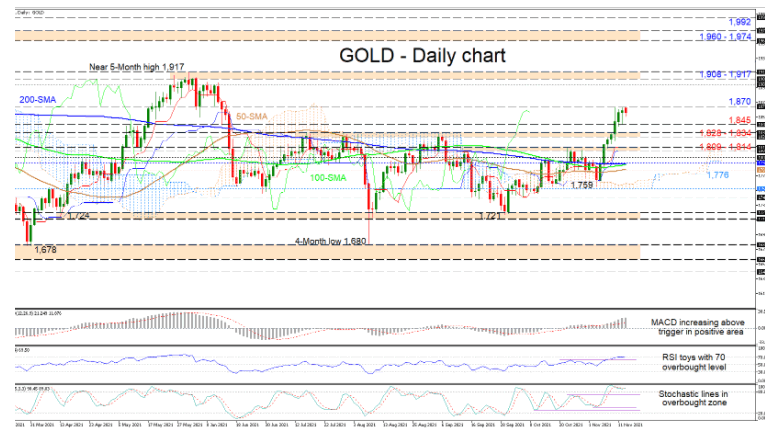
Gold is battling to extend its commanding rally, from the 1,759 low, past the obstacle at 1,870, which has managed to limit the upside trajectory. The converged simple moving averages (SMAs) are sponsoring a trendless market.
The Ichimoku lines are signalling that upside forces are taking a breather, while the short-term oscillators are leaning to the upside. The MACD, in the positive zone, is strengthening above its red trigger line, while the RSI is flirting with the 70 level. The stochastic lines are entangled in the overbought area, and the %K line has yet to suggest any waning in positive impetus.
In the positive scenario, the 1,870 level could continue to limit upside extensions. However, breaching it, the price may aim for the 1,900 handle and the adjoining highs, before challenging the resistance belt of 1,908-1,917, the latter being the near five-month peak. Overstepping this key barrier, the price could then propel for the resistance ceiling of 1,960-1,974, formed by the rally peaks from September and November 2020, as well as January 2021. Moving even higher, the bulls could then turn their focus to the 1,992 boundary.
If sellers manage to block the rally from evolving, preliminary support may commence at the 1,845 low before the bears test the border of 1,828-1,834, shaped by the inside swing highs from mid-July until early September. Slightly lower, the 1,809-1,814 obstacle, reinforced by the flattening Ichimoku lines, may try to counter negative tendencies. That said, should a deeper retracement unfold, sellers may meet the 1,800 barricade ahead of a support area between the 200-day SMA at 1,792 and the 50-day SMA at 1,783. Sinking further, the Ichimoku cloud around 1,776 could act as another upside defence ahead of the 1,759 trough.
Summarizing, gold is sustaining a bullish tone above the Ichimoku lines and the 1,759 low, and a push beyond the 1,870 level may revive upside momentum. Yet, a price pullback beneath the 1,828-1,834 border could start to feed negative pressures.
USDTRY Outlook: Hits New Record High On Break Above Psychological 10 Barrier
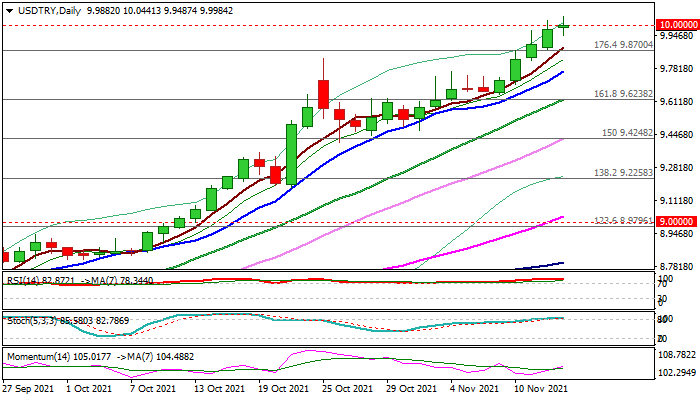
The USDTRY cracked psychological 10 barrier at hit new record high in early Monday, extending larger uptrend, as lira’s sentiment remains negative on CBRT’s rate cuts and rising oil prices.
Technical studies are firmly bullish on all larger timeframes, signaling that the uptrend could extend further.
However, overbought conditions on daily and weekly charts suggests bulls may consolidate before making a clear break above 10 level, with corrective dips expected to offer better levels to re-enter the uptrend
The price action is currently rising on the third wave of five-wave sequence from 6.8951 (2021 low), eyeing its FE100% at 10.1200, violation of which would open way for fresh acceleration higher.
Investors await CBRT’s policy meeting on Thursday, as the central bank is expected to cut rates again.
Expectations are for a 1% cut to 15%, though some economists think that the policymakers may push the rates to 14.5%.
Generally, the rate cut will be negative for lira, but current drop in energy prices was a good news for lira that may temporarily ease pressure.
Res: 10.0441, 10.1201, 10.2000, 10.2680.
Sup: 9.9487, 9.9000, 9.8700, 9.8314.
Are Stocks Still The Place To Be?
After breaking a five-week winning streak, the S&P 500 futures gained slightly in early Monday trading as investors continued to monitor economic data and hints from monetary policy officials.
The 0.31% decline in the S&P 500 last week came on the back of the latest US inflation reading, which jumped 6.2% last month in its largest annual increase in more than 30 years. The hot CPI figure pushed the dollar to the highest level in 16 months and sent US bond yields surging across the curve. However, the news was not enough to cause significant volatility across markets and major US indices remain near their record highs.
While hot inflation and rising bond yields are usually troubling for stocks, investors do not seem worried yet. When adjusting bond yields for inflation, you find out that real yields are deeply in negative territory and that continues to make stocks more appealing, despite overstretched valuations.
The US 10-year TIPS yield declined to a new record low of -1.24% last week before settling at -1.18%. The benchmark traded in negative territory throughout the pandemic and is expected to remain there for many months to come. As long as investing in risk-free assets is unprofitable, economic growth remains solid, and US corporates manage to pass on rising costs to consumers, equities will remain overweighted in portfolios and that’s likely to keep the bulls in control.
This week’s market test comes from US consumers. After the recent University of Michigan Consumer Sentiment Index tumbled to a 10-year low, will this trend translate into lower spending? According to the widely watched Michigan report, the considerable decline in consumers' confidence is due to an escalating inflation rate and reduction in living standards. However, this could be offset by solid savings during the pandemic and increased household wealth fueled by the rally in equities and real estate over the previous year.
Tuesday will reveal US retail sales for October and show us American’s willingness to spend ahead of the holiday season. If this remains robust, that will provide another reason why investors need to hold on to their equity holdings.
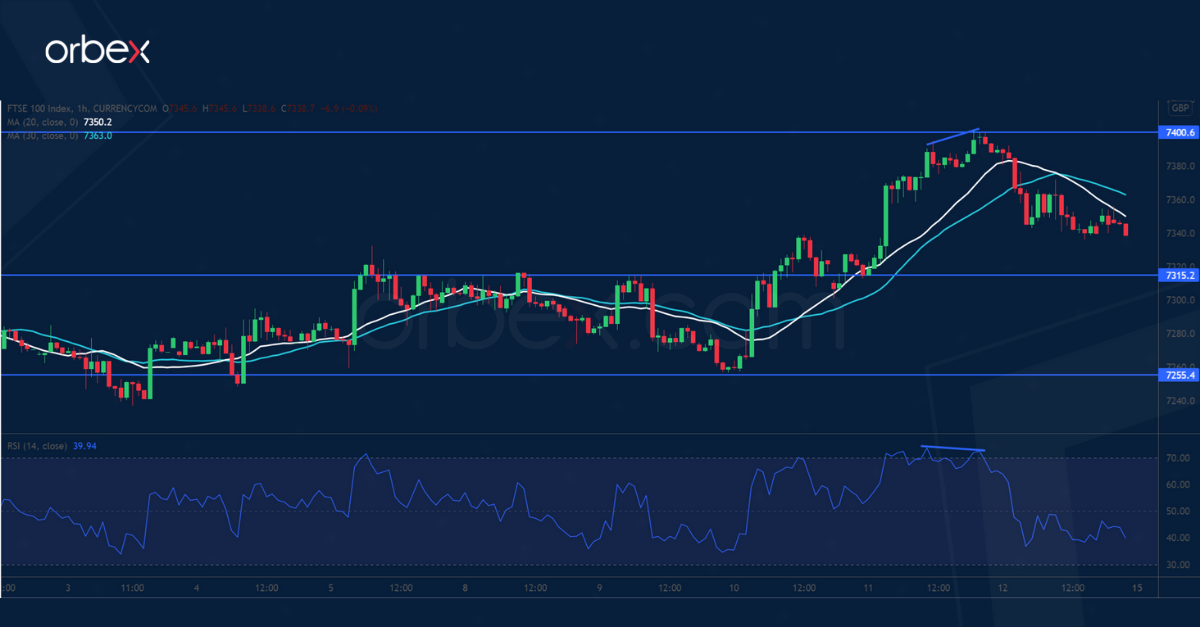
UK 100 Tests Support
The FTSE 100 edged lower after active job postings in the UK hit a record high.
The index came under pressure at the psychological level of 7400. A combination of an overbought RSI and its bearish divergence suggests that the rally was losing momentum. Sentiment remains upbeat and a pullback could be an opportunity to get filled at a better price.
Trend followers may be waiting to buy the dip near the first support at 7315. A deeper correction would send the price to 7255 along with the 30-day moving average.