Sample Category Title
Dollar Retreats Mildly in Asian Session, Yen Lower after GDP
Dollar retreats mildly in quiet Asian session today, but loss is limited. Some consolidations will likely be seen and further rally in the greenback is still likely to follow. Yen is also slightly softer after worse than expected GDP data. On the other hand, Swiss Franc and Euro are trading mildly higher while Aussie is also recovering. Overall, Asian stocks are treading water, WTI oil is defending 80 handle while Gold is in sideway consolidation.
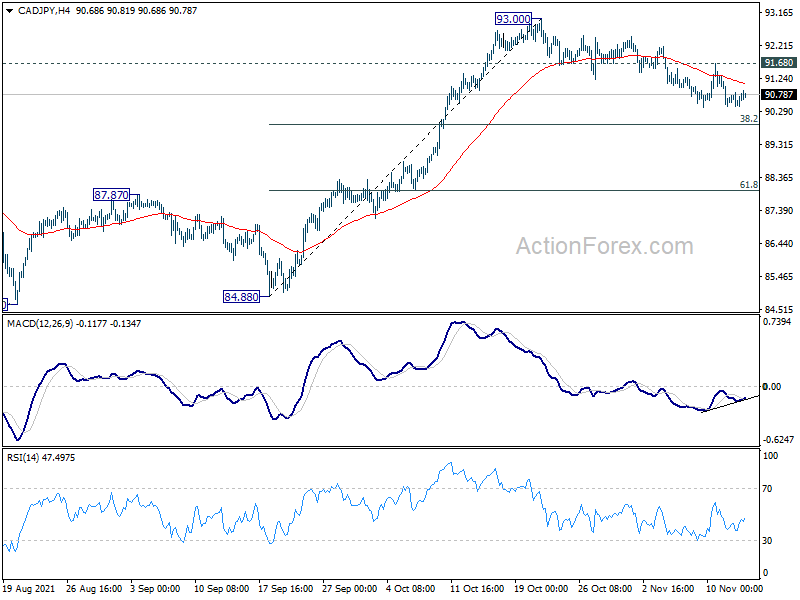
Technically, one focus for the week is whether commodity-yen crosses would finish near term corrective fall and stage rebounds this week. AUD/JPY is defending 55 day EMA and break of 84.16 minor resistance will likely bring stronger rise back to retest 86.24 high. Similarly, break of 91.68 minor resistance in CAD/JPY will suggest completion of pullback from 93.00, and bring retest of this high.
In Asia, at the time of writing, Nikkei is up 0.43%. Hong Kong HSI is down -0.08%. China Shanghai SSE is down -0.29%. Singapore Strait Times is up 0.20%. Japan 10-year JGB yield is down -0.0062 at 0.070.
Japan GDP contracted -0.8% qoq, -3.0% annualized in Q3
Japan GDP contracted -0.8% qoq in Q3, much worse than expectation of -0.2% qoq. In annualized term, GDP dropped -3.0% qoq, much worse than expectation of -0.8%.
Capital expenditure dropped -0.8% qoq, versus expectation of -0.6% qoq. External demand rose 0.1% qoq, versus expectation of 0.0% qoq. Private consumption dropped -1.1% qoq, versus expectation of -0.5% qoq. GDP price index dropped -1.1%, slightly better than expectation of -1.2%.
Economy minister Daishiro Yamagiwa said pace of pickup in the economy is weakening and policy support is needed. He also warned of downside risks from the global supply constraints. Prime Minister Fumio Kishida is expected to reveal a stimulus package "worth several tens of trillion yen" later this week on November 19.
BoJ Kuroda: Recovery mechanism maintained, inflation to hit 1% mid 2022
In a speech with business leaders, BoJ Governor Haruhiko Kuroda said that CPI is likely to "increase moderately in positive territory for the time being", reflecting rise in energy prices. Thereafter, "it is projected to increase gradually to about 1 percent as the output gap turns positive around the middle of next year."
He noted that economic recovery in Japan has been "somewhat slower than initially expected". Nevertheless "the mechanism for economic recovery has been maintained."
Real GDP is expected to recovery to pre-pandemic level in the first half of 2022. Thereafter, "as the resumption of economic activity progresses while public health is being protected, Japan's economy is expected to follow a growth path that outpaces its potential growth rate, supported by relatively high growth in overseas economies and accommodative financial conditions."
China industrial production rose 3.5% yoy in Oct, retail sales up 4.9% yoy
China industrial production rose 3.5% yoy in October, above expectation of 3.0% yoy. Retail sales rose 4.9% yoy, versus expectation of 3.8% yoy. Fixed asset investment rose 6.1% ytd yoy, versus expectation of 6.2%.
"The national economy was generally stable and maintained the trend of recovery," the NBS said in a statement. "However, we must be aware that the international environment is still complicated and severe with many unstable and uncertain factors."
Inflation and retail sales to highlight the week
Inflation data will catch most attention this week, with CPI from UK, Canada and Japan featured. UK, Germany and will New Zealand release PPI. Additionally, eyes will be on retail sales from US, UK and Canada. Other data to watch include a batch of data from China, regional Fed surveys and UK employment.
Here are some highlights for the week:
- Monday: Japan GDP; China retail sales, fixed asset investment, industrial production; Eurozone trade balance; Canada manufacturing sales, wholesale sales; US Empire State manufacturing index.
- Tuesday: RBA minutes; Japan tertiary industry index; UK employment; Eurozone GDP, employment; Canada housing starts; US retail sales, import prices, industrial production, business inventories, NAHB housing index.
- Wednesday: New Zealand PPI; Australia wage price index; Japan trade balance, machine orders; UK CPI, PPI; Eurozone CPI final; Canada CPI; US building permits and housing starts.
- Thursday: New Zealand inflation expectations; Swiss trade balance; US Philly Fed manufacturing index, jobless claims.
- Friday: Japan CPI; UK Gfk consumer sentiment, retail sales, public sector net borrowing; Germany PPI; Eurozone current account; Canada retail sales, new housing price index.
AUD/USD Daily Report
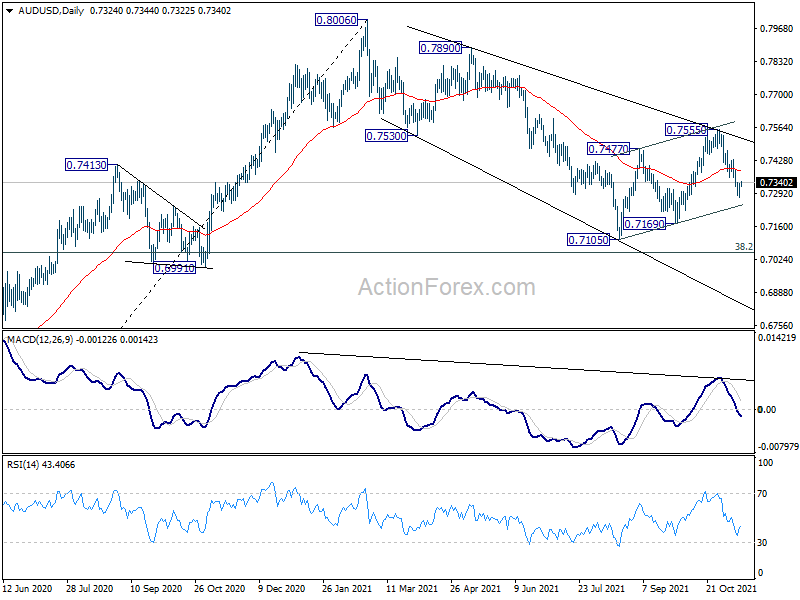
Daily Pivots: (S1) 0.7294; (P) 0.7314; (R1) 0.7352; More...
Intraday bias in AUD/USD remains neutral for the consolidation above 0.7275 temporary low. But further decline is in favor as long as 0.7431 minor resistance holds. Rebound from 0.7105 could be complete with three waves up to 0.7555, and fall from 0.8006 is still in progress. On the downside, below 0.7275 will target 0.7169 support first, and then 0.7105. However, break of 0.7431 resistance will turn bias back to the upside for retesting 0.7555.
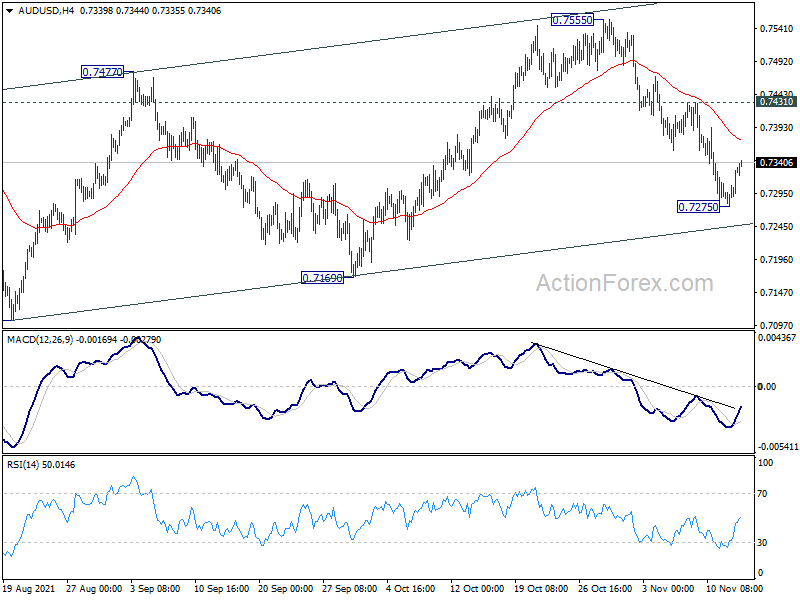
In the bigger picture, with 0.6991 cluster support (38.2% retracement of 0.5506 to 0.8006 at 0.7051) intact, we're seeing price action from 0.8006 as a correction only. That is, up trend from 0.5506 low would resume after the correction completes. In that case, main focus will be 0.8135 key resistance (2018 high). Sustained break there will carry larger bullish implications. However, sustained break of 0.6991 will argue that the whole medium term trend has indeed reversed.
Economic Indicators Update
| GMT | Ccy | Events | Actual | Forecast | Previous | Revised |
|---|---|---|---|---|---|---|
| 23:50 | JPY | GDP Q/Q Q3 P | -0.80% | -0.20% | 0.50% | |
| 23:50 | JPY | GDP Price Index Q3 P | -1.10% | -1.20% | -1.10% | |
| 00:01 | GBP | Rightmove House Price Index M/M Nov | -0.60% | 1.80% | ||
| 02:00 | CNY | Retail Sales Y/Y Oct | 4.90% | 3.80% | 4.40% | |
| 02:00 | CNY | Industrial Production Y/Y Oct | 3.50% | 3.00% | 3.10% | |
| 02:00 | CNY | Fixed Asset Investment YTD Y/Y Oct | 6.10% | 6.20% | 7.30% | |
| 04:30 | JPY | Industrial Production M/M Sep F | -5.40% | -5.40% | -5.40% | |
| 10:00 | EUR | Eurozone Trade Balance (EUR) Sep | 12.5B | 11.1B | ||
| 13:30 | CAD | Manufacturing Sales M/M Sep | -3.00% | 0.50% | ||
| 13:30 | CAD | Wholesale Sales M/M Sep | 1.10% | 0.30% | ||
| 13:30 | USD | Empire State Manufacturing Index Nov | 20.2 | 19.8 |
China industrial production rose 3.5% yoy in Oct, retail sales up 4.9% yoy
China industrial production rose 3.5% yoy in October, above expectation of 3.0% yoy. Retail sales rose 4.9% yoy, versus expectation of 3.8% yoy. Fixed asset investment rose 6.1% ytd yoy, versus expectation of 6.2%.
"The national economy was generally stable and maintained the trend of recovery," the NBS said in a statement. "However, we must be aware that the international environment is still complicated and severe with many unstable and uncertain factors."
BoJ Kuroda: Recovery mechanism maintained, inflation to hit 1% mid 2022
In a speech with business leaders, BoJ Governor Haruhiko Kuroda said that CPI is likely to "increase moderately in positive territory for the time being", reflecting rise in energy prices. Thereafter, "it is projected to increase gradually to about 1 percent as the output gap turns positive around the middle of next year."
He noted that economic recovery in Japan has been "somewhat slower than initially expected". Nevertheless "the mechanism for economic recovery has been maintained."
Real GDP is expected to recovery to pre-pandemic level in the first half of 2022. Thereafter, "as the resumption of economic activity progresses while public health is being protected, Japan's economy is expected to follow a growth path that outpaces its potential growth rate, supported by relatively high growth in overseas economies and accommodative financial conditions."
Japan GDP contracted -0.8% qoq, -3.0% annualized in Q3
Japan GDP contracted -0.8% qoq in Q3, much worse than expectation of -0.2% qoq. In annualized term, GDP dropped -3.0% qoq, much worse than expectation of -0.8%.
Capital expenditure dropped -0.8% qoq, versus expectation of -0.6% qoq. External demand rose 0.1% qoq, versus expectation of 0.0% qoq. Private consumption dropped -1.1% qoq, versus expectation of -0.5% qoq. GDP price index dropped -1.1%, slightly better than expectation of -1.2%.
Economy minister Daishiro Yamagiwa said pace of pickup in the economy is weakening and policy support is needed. He also warned of downside risks from the global supply constraints. Prime Minister Fumio Kishida is expected to reveal a stimulus package "worth several tens of trillion yen" later this week on November 19.
EUR/USD Turns Red Below 1.1520, Upsides Limited
Key Highlights
- EUR/USD extended decline below 1.1520 and 1.1500.
- A major bearish trend line is forming with resistance near 1.1525 on the 4-hours chart.
- GBP/USD also extended decline below the key 1.3500 support.
- Gold price rallied above the $1,835 and $1,850 resistance levels.
EUR/USD Technical Analysis
The Euro failed to stay above the key 1.1520 support level against the US Dollar. EUR/USD broke the 1.1500 support zone to enter the red zone.
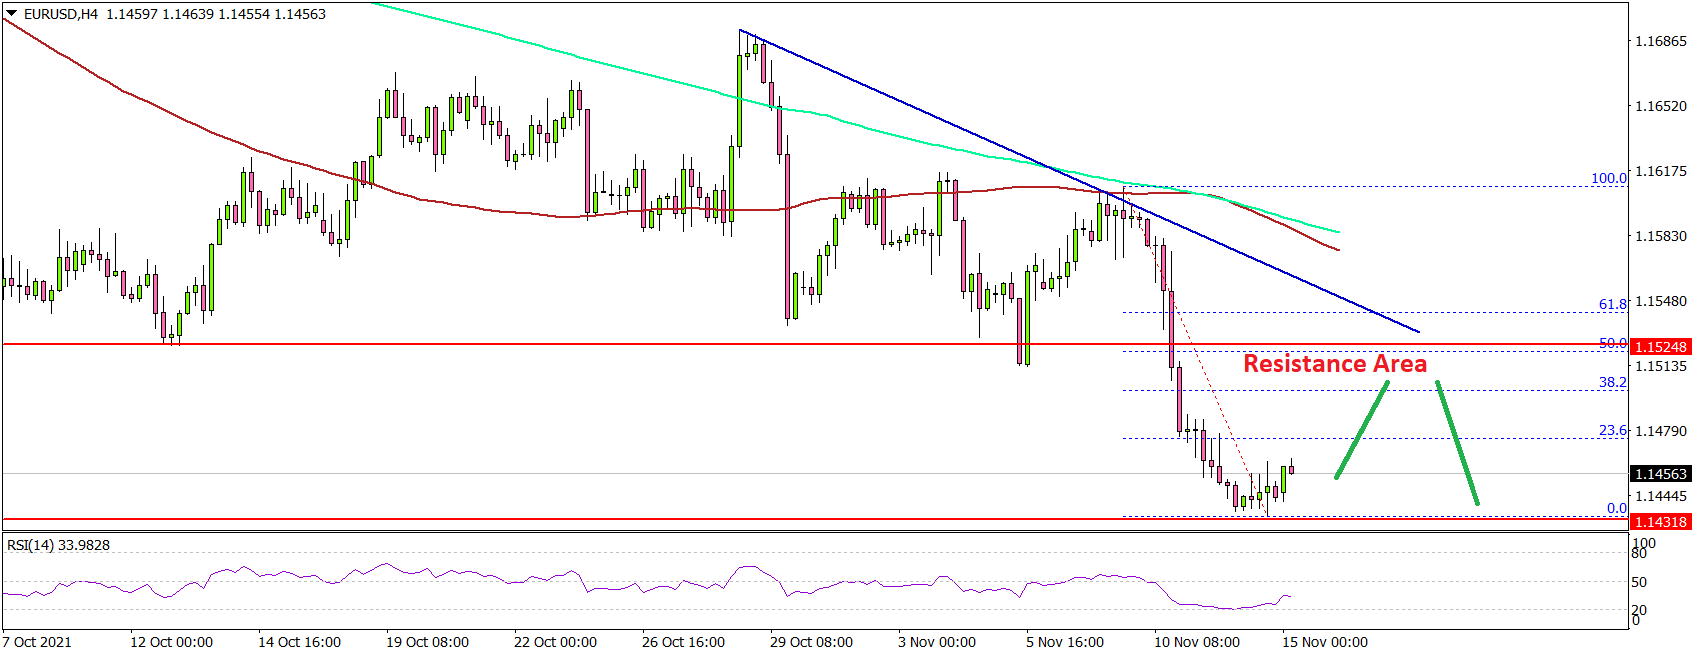
Looking at the 4-hours chart, the pair settled below the 1.1520 level, the 200 simple moving average (green, 4-hours), and the 100 simple moving average (red, 4-hours).
There was a clear break below the 1.1450 level and the pair traded as low as 1.1431. It is now consolidating losses above the 1.1440 level. An immediate resistance is near the 1.1480 level. It is near the 23.6% Fib retracement level of the recent decline from the 1.1605 swing high to 1.1431 low.
The next major resistance is near the 1.1510 level. The main resistance is forming near 1.1520 and a bearish trend line. It is close to the 50% Fib retracement level of the recent decline from the 1.1605 swing high to 1.1431 low.
A clear break above the 1.1510 and 1.1520 resistance levels could open the doors for a steady increase. The next key resistance could be 1.1565.
An immediate support is near the 1.1440 level. The main breakdown support is near the 1.1435 level, below which there is a risk of a sharp decline. The next major support is near the 1.1250 level.
Looking at GBP/USD, the pair extended decline and traded below the key 1.3500 support. On the other hand, USD/CAD and USD/JPY remained well bid for more upsides.
Economic Releases
- Euro Zone Trade Balance for Sep 2021 – Forecast €11.2B versus €11.1B previous.
Market Morning Briefing: Dollar-Yen Is Bullish Towards 115.50 Overall
STOCKS
Equities are still vulnerable.Dow Closed above 36000 on friday but danger of falling towards 35000 still remains.Dax can consolidate between 15900-16100 in the near term.Nikkei has risen above 29750,it needs to sustain above 29750 to rise towards 30000/31000.Shanghai has resistance at 3575 which needs to be broken to move up further.Nifty closed above 18000 on friday, a strong and sustained break above 18200 can take it towards 18400/500.Sensex can rise towards 61000, while above 60000.
Dow (36100.31, +179.08, +0.50%) closed above 36100 on Friday, but it is vulnerable to a fall towards 35000.
DAX (16094.07, +10.96, +0.068%) continues to trade within the mentioned range of 15900-16100.The 15900 support level can produce a bounce towards 16400 eventually on a break above 16100.
Nikkei (29754.61, +144.64, +0.49%) has risen above the resistance at 29750 mentioned on friday.The index needs to sustain above 29750 to be bullish towards 30000 and 31000 eventually.
Shanghai (3528.88, −10.22, -0.29%) has come down today.The view remains bullish above 3500 to see a rise towards 3600.A strong break below 3500 can take the index down towards 3400/3350.
Nifty (18140.95, +38.20, +0.21%) rose above 18000 and managed to close above 18100.The index needs to sustain above 18100 to see a rise towards 18200/500 in the coming week. If 18100 fails to sustain then a dip towards 17800 is possible.
Sensex (60837.40, +150.71, +0.25%) closed above 60000 on Friday. While above 60000,the view remains bullish to see a test of 61000/62000 on the upside
COMMODITIES
Commodities look weak. Brent and WTI have come down since Friday. We need to watch if a break below $81 is seen today. Gold can consolidate between 1840-1880 for some time while below 1880.Silver has room to fall down towards 24.50.A strong break above 25 is needed to be bullish towards 25.5/26.Copper has come down slightly after testing resistance at 4.45.A dip towards 4.35/30 is possible now.
Brent(81.380) and WTI(81.17) has come down since Friday as OPEC+ flatly rejected calls by the Biden’s administration to open its taps more quickly and stuck to an agreed plan to raise output by 400K barrels per day after concluding its November ministerial meeting. The move irked the White House, as the underwhelming increase in production will not be enough to offset the current deficit and will ensure oil prices to stay supported in the coming months, exacerbating energy-linked inflation. Need to watch for a break below $81 this week. The contracts have strong resistance at $83 and $85.
Gold (1859.13) has dipped again after testing a high of 1871.4 on friday.A consolidation between 1840-1880 is possible for some time before we see an eventual break on either side.
Silver (24.998) has come down today. A sustained break above 25 is needed for the view to be bullish towards 25.5/26. While below 25 a dip towards 24.50/24 can be seen.
Copper (4.4255) has come down slightly after testing the resistance at 4.459.A dip towards 4.35/30 is possible now.
FOREX
Interesting juncture in the currency markets. The Dollar Index can take a pause while the Aussie, Yuan and the Rupee have at least a marginal possibility of further strength.
Although we have called for 96 on Dollar Index (95.01), there is near-term Resistance just above Friday’s high of 95.27. While that holds, a bit of a pullback towards 94.25 should not surprise. This is straight reflected in the Euro (1.1457) as well, which has Support just below Friday’s low of 1.1433. A small rally to 1.1500 should not be grudged it.
While Dollar-Yen (113.84) is bullish towards 115.50 overall, a near-term dip towards trend Support at 113.25 is a possibility to consider. The Dollar-Yuan (6.3820) trades near the lower end of the overall 6.3750-6.43 sideways range. It will be very interesting if it happens to break to the downside.
Corresponding to the Euro Support below 1.1433, the Pound (1.3431) has medium-term Support at 1.3300. Immediate Resistance seen at 1.3450. The Aussie (0.7337) has managed to avert a fall to 0.7250-40 and might even have good Support at 0.73 on the Weekly Candles. Looks more bullish than the Euro.
Dollar-Rupee trades near 74.35/40 (Offshore) after closing at 74.44 on Friday. We continue to be inclined towards bearishness while below Resistance at 74.60-80. The Euro-Rupee (85.21) has crucial Support at 85.00 now. It will have to be seen if it is allowed to break below that to target 84.
INTEREST RATES
The US Treasury yields continue to stay higher at the far-end while the near-end yields have dipped slightly. The far-end yields can move up in the coming days within their expected broad range. The corrective rise in the German yields seems to be losing steam. It will have to be seen if they move up to test their resistance or fall back from here itself. The 10Yr and 5Yr GoI looks mixed. They have room to move up further in the near-term before reversing lower again. It’s a wait and watch situation now.
The US 2Yr (0.50%) and 5Yr (1.21%) Treasury yields have dipped slightly while the 10Yr (1.56%) remains stable and the 30Yr (1.93%) has inched up slightly. We retain our view of seeing 1.65% on the 10Yr and 2%-2.1% on the 30Yr while they remain above 1.5% and 1.9% respectively. Overall, we expect the yields to remain in a broad range of 1.35%-1.65% (10Yr) and 1.75%-2.1%/2.2% (30Yr).
The German 2Yr (-0.76%), 5Yr (-0.58%), 10Yr (-0.26%) and 30Yr (0.05%) yields dipped across tenors. The yields seem to be lacking strength to extend the corrective rise towards -0.2%/-0.1% (10Yr) and 0.1% (30Yr). We will have to wait and watch if the yields are turning down from here itself to resume their broader downtrend.
The India 10Yr GoI (6.3681%) hovers below an immediate resistance at 6.38% which if broken can take the yield up to 6.4%-6.45%. While 6.38% holds, a dip to 6.35%-6.30% is possible. It’s a wait and watch situation. Broadly, as mentioned on Friday and as seen from the weekly candles, 6.3%-6.45% looks to be a possible broad range of trade for some time.
The 5Yr GoI (5.7168%) has chances of a rise to 5.75%-5.76% while it remains above 5.7% and then fall-back to 5.7% and 5.66% again.
Eco Data 11/15/21
[php_everywhere instance="1"]
Forex and Cryptocurrencies Forecast
EUR/USD: Rising Inflation Equals to Rising USD
All US macroeconomic statistics turned out to be worse than forecast. But despite this, the American currency continues to grow. The DXY dollar index, which measures it against a basket of six other major currencies, hit 95.26 on Friday, November 12, gaining about 2% over the past two weeks. It would seem that everything should be the other way around. So, what is the reason for this strange situation? It turned out to be the rapid growth of inflation.
According to the Labor Department, the US CPI rose 6.2% in October, a record in more than 30 years. Inflation was higher only in November 1990. Compared to September, the price growth rate has accelerated by 0.8%, while core inflation (excluding energy and food prices) has accelerated to 4.6%, which is also the highest in three decades. And, apparently, this is not the limit. Inflation in the US is forecast to continue to rise in the coming months on the back of housing, utilities, energy and car prices. The CPI, which reflects the change in the cost of living in the country, has surpassed the 5% mark for the fifth month in a row. And this makes us doubt the assurances of Fed Chairman Jerome Powell that high inflation is temporary. However, not only investors are in doubt, but also the Fed itself.
According to classical economic theory, the dollar should have weakened significantly in such a situation. However, the COVID-19 pandemic has turned everything upside down, forcing regulators to implement monetary stimulus (QE) programs in the spring of 2020, flooding markets with cheap money and lowering interest rates.
Finally, the Fed reported that it is gradually beginning to curtail $120 billion of the asset purchase program starting this month. As for the rate hike, according to Jerome Powell, the time has not yet come for this, since the labor market has not fully recovered and, according to forecasts, this will happen by mid-2022. The Fed will be patient until then.
However, many investors felt that with such a galloping inflation, the Fed's patience could quickly run out and the regulator would be forced to raise rates before the summer of 2022.
An analysis of the Chicago Mercantile Exchange (CME) derivatives shows that there is a 64% chance that rates may rise even before June. Previously, the market was confident that the regulator would raise interest rates at least once next year. Now the likelihood that it will happen twice has increased from 63% to 80%, three times - from 29% to 49%. And some hotheads believe that the US Central Bank will take the first step in this direction this year.
All these expectations made the dollar continue to grow. It was further supported by the soaring yields on US government bonds. Growing inflation reduces the purchasing power of the coupons paid on them, and there are few people willing to invest in securities, the yield on which covers inflation by only a third.
As for the data on the US labor market published on November 9, the inflation-shocked market practically ignored them. But they also turned out to be much worse than forecasts. The number of repeated claims for unemployment benefits was expected to decrease by 50K, and it rose by 59K instead.
The growing dollar pushed the EUR/USD pair to the lows of July 2020. It dropped to 1.1432 on Friday, November 12 and ended the week at 1.1446. The American currency has gained almost 900 points against the euro since the beginning of this year. And if the situation continues to develop as it is now, it will not stop there.
Indicators on D1 confirm this forecast, pointing to the south. These are 100% among the trend indicators. The same can be said about oscillators, although a quarter of them are in the oversold zone.
In anticipation of a correction, 40% of experts vote for the growth of the pair. 60% vote for its further fall. The nearest support level is 1.1435, then 1.1350 and 1.1250. Resistance levels are 1.1525, 1.1575, 1.1615, 1.1665, 1.1715.
As for the upcoming release of macroeconomic statistics, there will be preliminary data on the Eurozone GDP for the Q3 on Tuesday, November 16. Data on retail sales in the United States will be released on the same day, they are very important for assessing the impact of inflation on the country's consumer market. The working week will end with a speech by ECB President Christine Lagarde on Friday, November 19.
GBP/USD: Another Victory for the Dollar
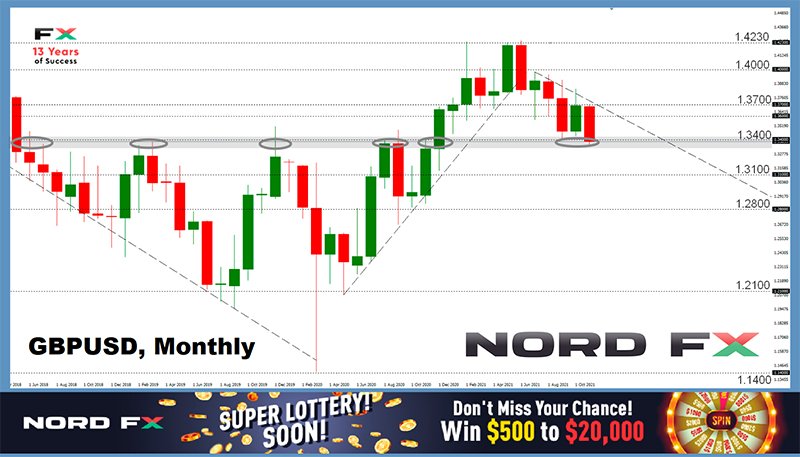
The dollar, pushed by inflation in the US, continues to put pressure on the British currency, as a result, the GBP/USD pair has been falling for the sixth month. It updated another low last week and settled in the zone of long-term support/resistance, where it has been periodically since 2016. The local minimum of the week was fixed at 1.3352 this time, and the last chord sounded at 1.3421.
The macro statistics released on Thursday; November 11 did not help the pound either. And it seems that GDP for the Q3 turned out to be higher than the forecast, but the growth rates of the UK economy slowed down by more than 3.5 times, from 23.6% to 6.6%, and the industrial production growth rate fell from 4.0% to 2.9% (against the forecast of 3.4% ). Such a sharp slowdown, especially noticeable against the background of smoother similar indicators of the Eurozone and the United States, disappointed greatly, and even scared investors.
The threats of recession and stagflation, combining weak GDP growth and high inflation, are very dangerous for the British economy, which is still under pressure from the Brexit effects. According to forecasts of experts from the Bank of England, the annual inflation rate will accelerate to about 5% by April 2022 and will decrease to the target level of 2% as late as by the end of 2022.
This is a very high rate, and shortly before the meeting of the Bank of England on November 4, its head Andrew Bailey said that with such indicators, it may be necessary to raise interest rates earlier than planned. The market reaction was similar to the one that strengthened the dollar last week. The markets believed that the regulator would raise the key rate in November, and... they were deceived. The Bank of England did not raise the rate, and the GBP/USD pair went further down.
UK unemployment data are due out on Tuesday November 16, followed by October CPI data the next day. Naturally, the state of the labor market and inflation will have an impact on market sentiment and the dynamics of the pound. In the meantime, analysts' opinions are almost equally divided: 35% of experts bet bears on the victory, 35% support the bulls, and the remaining 30% have taken a neutral position.
As for the oscillators on D1, 85% is colored red, 15% indicates that the pair is oversold. Trend indicators are 100% red. Support levels are 1.3350, 1.3200, the target of the bears is 1.3135. The resistance levels and targets of the bulls are 1.3510, 1.3570, 1.3610, 1.3735, 1.3835.
USD/JPY: Treasuries Strike
Giving a forecast for the previous week, most analysts expected the USD/JPY pair to return to the upper border of the 113.40-114.40 channel. At first, it seemed that this forecast would not come true: the pair continued its corrective movement to the south, reaching the level of 112.70. However, it then turned and soared to 114.30, confirming the expectations of experts. The week finished at 113.90.
The reason for this reversal was the "inflationary" strengthening of the dollar and, of course, a sharp increase in the yield of US Treasury bonds, with which the USD/JPY pair has a long-standing friendship. In other words, there is a direct correlation dependence.
Given the soft monetary policy of the Bank of Japan and the expansion of control over the yield curve, it is highly likely that the weakening of the yen and the growth of the pair will continue. Of course, the decisions of the US Federal Reserve regarding interest rates will also affect the dynamics.
A number of experts consider the rise of the USD/JPY pair to 114.00 as a return to the bullish trend that began back in January 2021. Although, the charts in the interval between March 10 and September 27 show that in the absence of strong drivers, the sideways movement can drag on for several months. Unlike the euro and the pound, the yen is a safe haven currency, and therefore is able to withstand storms in financial markets for a long time.
55% of analysts currently expect the pair to continue to rise, break through the upper boundary of the 114.40 channel, rise to a range of 115.00-116.00 and renew its multi-year highs. The opposite point of view is held by 35% of experts, and the remaining 10% expect the USD/JPY pair to stay in the 113.40-114.40 side channel for some time.
As for oscillators on D1, 80% face north, 10% face south, and 10% turn gray neutral. Among the trend indicators, 100% are on the green side. The resistance levels are 114.40, 114.70 and 115.50, the long-term target of the bulls is the December 2016 high of 118.65. The nearest support level is 113.80, then 113.40, 112.70, 112.00 and 111.65.
Monday, November 15, can be noted in the calendar for the coming week. Data on Japan's GDP for the Q3 will be published on this day, and, according to forecasts, this important indicator will decrease from + 0.5% to -0.2%.
CRYPTOCURRENCIES: Where Will Bitcoin Fall and Rise?
Bitcoin updated its all-time high, reaching $668,917 on Wednesday, November 10. Ethereum also set a record, climbing to $4,856. The total capitalization of the crypto market at the maximum reached $2.972 trillion.
The Crypto Fear & Greed Index climbed from 73 to 84, entering the Extreme Greed zone, indicating that the main cryptocurrency was heavily overbought, and a correction was needed. Which then followed: setting a record, the BTC/USD pair turned around and rolled back into the $63,000-64,000 zone.
With regard to bitcoin, the sentiment among retail investors is "extremely bullish". This is reported by the analytical resource Santiment with reference to the off-chain BTC indicators. But the situation is not so clear-cut among the "bitcoin whales". On the one hand, the total volume of coins on addresses with balances of 100-10,000 BTC has decreased by almost 60,000 BTC over the past 10 days. On the other hand, it has grown significantly on addresses with balances of more than 10,000 BTС. According to experts, this may indicate that large whales are buying coins from smaller ones, protecting bitcoin from a sharp drop.
The correction that took place on November 10 was only about 8.5%. "Only", because with the typical volatility of bitcoin, this is not much. The current situation can be defined as "irrational confidence" in this coin on the part of investors, which can lead to a much stronger price correction.
The specialists of the Kraken crypto exchange agree with this. The review they published notes that November has historically been volatile, resulting in the highest monthly returns. But if bitcoin's current rally stops at strong resistance around $70,000, a correction of up to 20% can be expected, meaning the BTC/USD pair could drop to $55,000.
The cryptocurrency analyst Altsoin Sherpa calls the same figure. "There is the possibility of a short-term hike to $ 55,000," he writes. "But I don't care about these minor movements. I continue to accumulate BTC, and when it starts to move up, it will be rapid."
Another well-known expert, Willie Woo, came to the conclusion that the zone from $50,000 to $60,000 is more than reliable as a support. Bitcoin has secured a capitalization of $1 trillion, and it is difficult to imagine that it will fall below this zone, he said, referring to data from the analytical company Glassnode.
Bitcoin is a hedge against inflation, and the US has currently seen a record rise in consumer prices, which is a strong argument in favor of the flagship cryptocurrency. Despite the curtailment of the QE program and the expectation of an increase in interest rates, signs of a possible sharp devaluation of the dollar frighten investors, forcing them to invest in alternative assets in the stock and cryptocurrency markets. As a result, both BTC and stock indices update their historical highs over and over again. And forecasts for bitcoin will be in the green zone until the US Federal Reserve moves on to a broader tightening of its monetary policy.
The top of bitcoin's current bull cycle may be the price of $96,000. This conclusion was reached by analysts of the Kraken crypto exchange. According to their research, the current Q4 has dynamics most similar to the Q4 of 2017 (correlation 0.88), which showed a yield of +220%. In general, cryptocurrency exchange experts predict that BTC will reach heights around $300,000.
A respected cryptanalyst known as PlanB said that bitcoin could rise by 700% in early 2022. "If you look at the signals along the chain right now, I dare say that the price will reach the top in almost 6 months, this will be the end of Q1 of next year. - he thinks. - I believe that we will have a BTC rate of $100,000 at the end of the year, and then, perhaps, the currency will continue to grow up to model X (S2FX) and reach the level of $288,000, and possibly more. I would not be surprised if I saw the price rise to $400,000 - 500,000 in Q1 and Q2 of next year."
Unlike many optimists, crypto strategists Benjamin Cowen, on the contrary, believes that bitcoin will not please its supporters with explosive growth. "We started with about $28,000 to $29,000 and this was the start of 2021," writes Cowen. "What have we seen so far? Not much, right? Will it be able to show more significant results by the end of the year? Maybe, but I'm not sure that 2021 will be the year of a parabolic rally for bitcoin."
While the distance between the low and high of the annual range may seem significant, Cowen noted that bitcoin holders are unlikely to be thrilled with such profits: "Look what happened to bitcoin in 2021: nothing special. The profitability was about 130%, and I am sure that most holders will not even get up from the couch for 130%." "We have returned to the top of the range, so there may be some euphoria, as it was from January to March 2021," the expert continues to reason. - There are chances of a sharp leap, but the data shows that the cycle should last at least through 2022. Looking back to 2021, I think it was, for the most part, a year of long-term re-accumulation."
Ethereum, the main competitor of bitcoin, showed significantly higher profitability, it grew 6.7 times in 2021. And the year is not over yet. Rahul Rai, the manager of the cryptocurrency fund BlockTower Capital, believes that the versatility of the ethereum blockchain will be the main factor that will attract both developers and investors. He is confident that if ethereum manages to restart the global financial system, its market will be much larger than that of bitcoin in the future. The crypto millionaire predicts that it may be as early as mid-2022. ETH will be the first cryptocurrency in terms of capitalization, which could reach several trillion dollars.
Analysts of the American investment bank JPMorgan made a similar statement in April. In their opinion, bitcoin is a consumer commodity. It can compete with precious metals and be seen as a store of value, but it will give way to ethereum in the long run, which is the pillar of the cryptocurrency economy.
And at the end of the review a warning from the billionaire, founder of Duquesne Capital and one of the most successful managers on Wall Street, Stanley Druckenmiller. The value of any asset can collapse at any moment, he warns. According to the financier, "cryptocurrencies, meme stocks, art, wine, securities ... There is a bubble in everything, in every asset on the planet." And bubbles, as you know, often burst.
"Every event in the world affects a certain amount of security," explains Druckenmiller. "I try to imagine the world as it is today, and then I try to see if there are any seismic changes and what the world might look like in 18 months. And if this is true, then what securities will be worth very differently than now? I think that many investors live only in the present. It might work in the short term, but it's a disaster in the long term."
EUR/USD Weekly Outlook
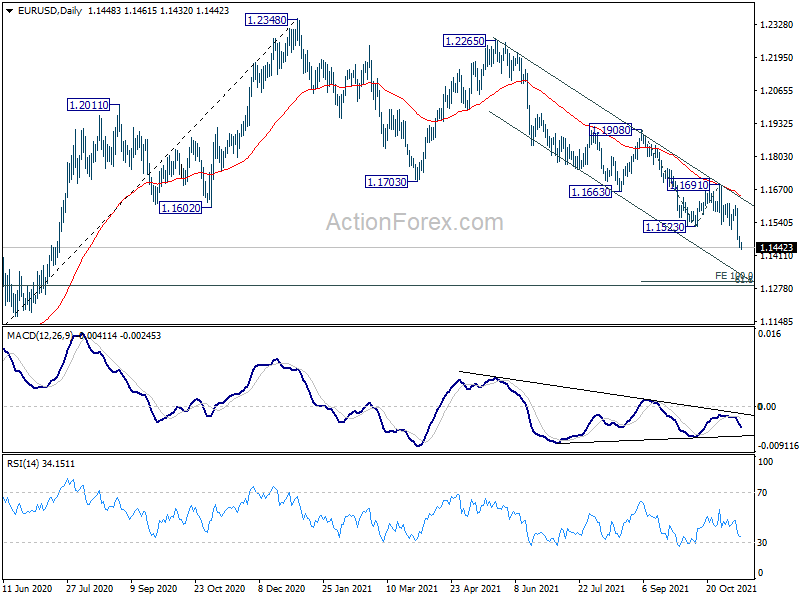
EUR/USD's down trend continued last week and hit as low as 1.1432. Initial bias remains on the downside this week for 100% projection 1.1908 to 1.1523 from 1.1691 at 1.1306, which is close to long term fibonacci level at 1.1289. We'd pay attention to bottoming signal there. On the upside, above 1.1512 minor resistance will turn intraday bias neutral first. But overall near term outlook will stay bearish as long as 1.1691 resistance holds, even in case of strong rebound.
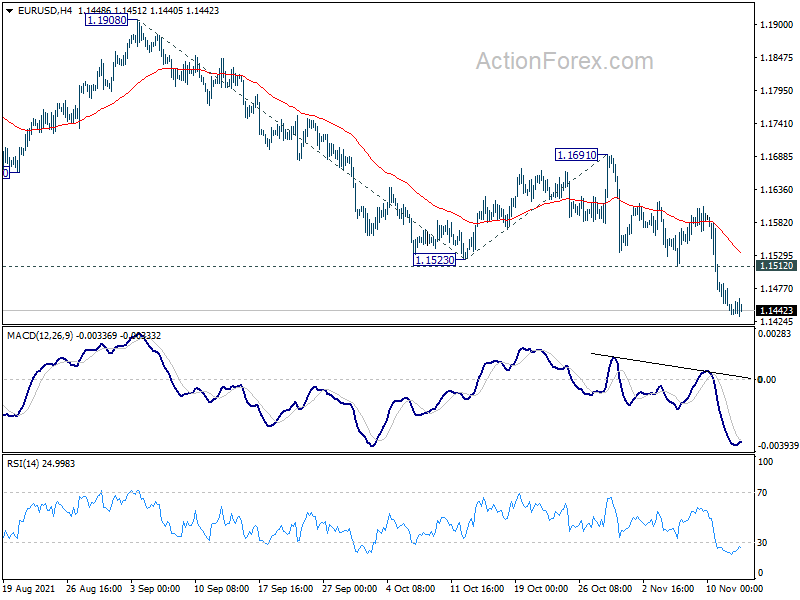
In the bigger picture, there are various ways of interpreting the fall from 1.2348 (2021 high). It could be a correction to rise from 1.0635 (2020 low), the fourth leg of a sideway pattern from 1.0339 (2017 low), or resuming long term down trend. In any case, outlook will now stay bearish as long as 1.1703 support turned resistance holds. Sustained break of 61.8% retracement of 1.0635 to 1.2348 at 1.1289 could pave the way back to 1.0635.
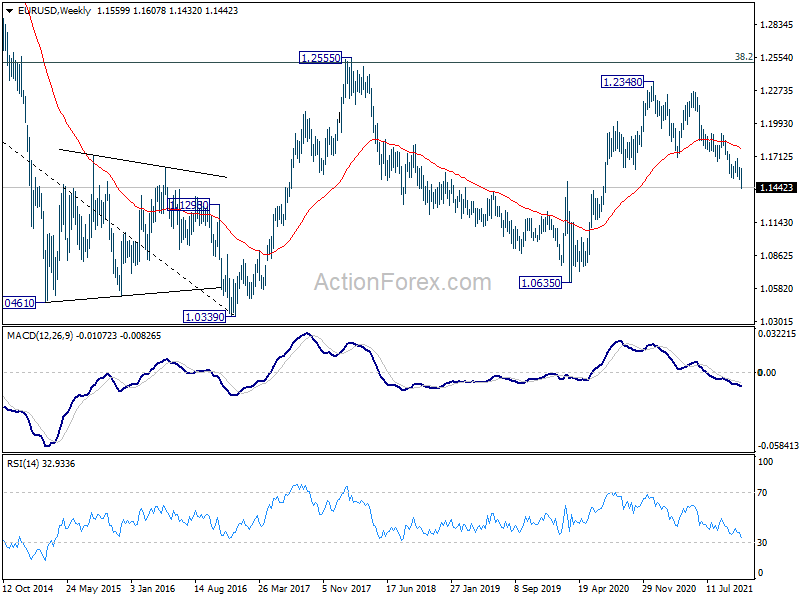
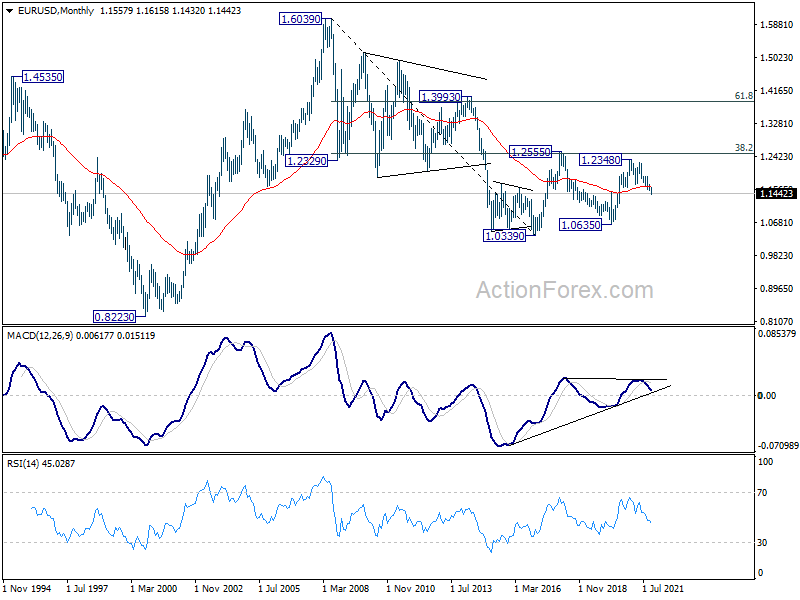
In the long term picture, EUR/USD has possibly failed 1.2555 cluster resistance (38.2% retracement of 1.6039 to 1.0339 at 1.2516) again. Long term outlook will remain neutral as sideway pattern from 1.0339 (2017 low) is extending with another medium term fall. For now, we'd hold back from assessing the chance of downside breakout, and monitor the momentum of the decline from 1.2348 first.
USD/JPY Weekly Outlook
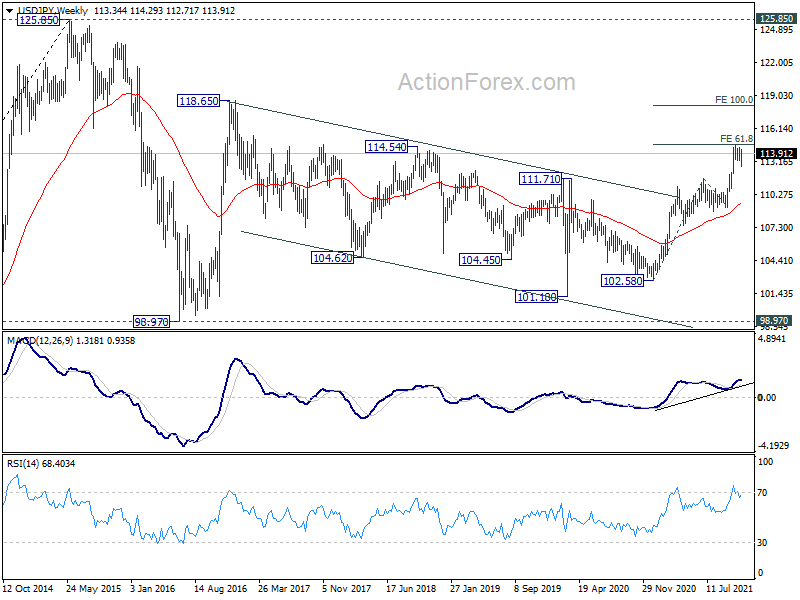
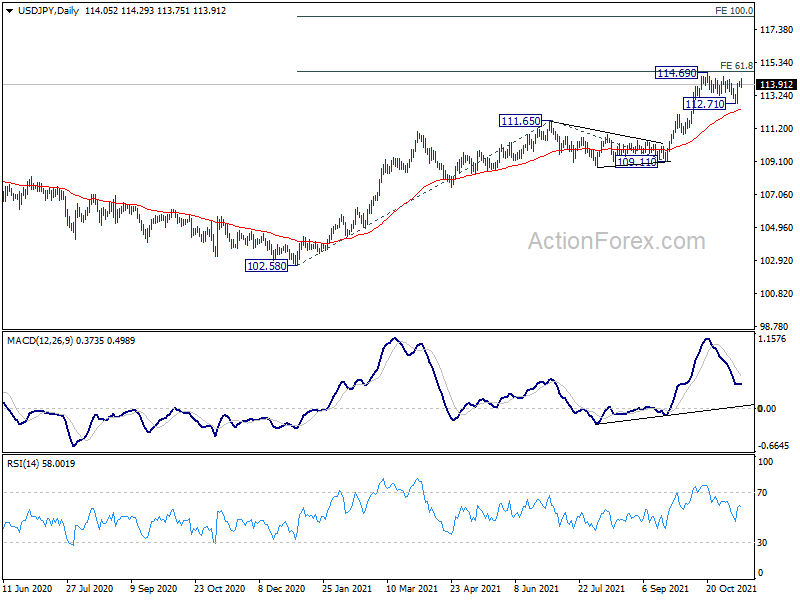
USD/JPY rebounded to 114.29 last week but failed to break through 114.69 resistance and retreated. Initial bias is neutral this week first. On the upside, sustained break of 114.69 will resume larger up trend for 100% projection of 102.58 to 111.65 from 109.11 at 118.18 next. In case the consolidation pattern from 114.69 extends with another fall, we'd continue to expect downside to be contained above 112.07 resistance turned support to bring rebound.
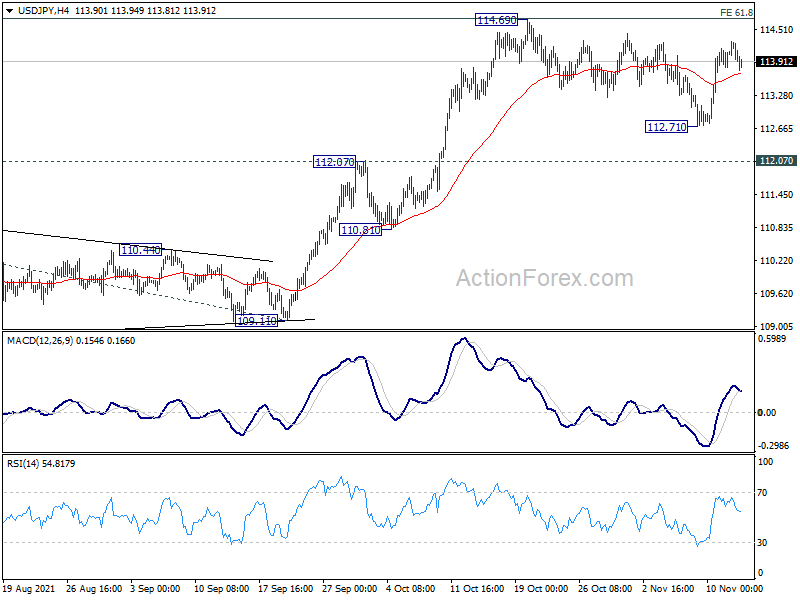
In the bigger picture, corrective decline from 118.65 (2016 high) should have completed at 101.18 already. Rise from the 102.58 is seen as the third leg of the up trend from 101.18. Next target is 114.54 resistance and then 118.65 high. This will now be the preferred case as long as 109.11 support hold, even in case of deep pull back.
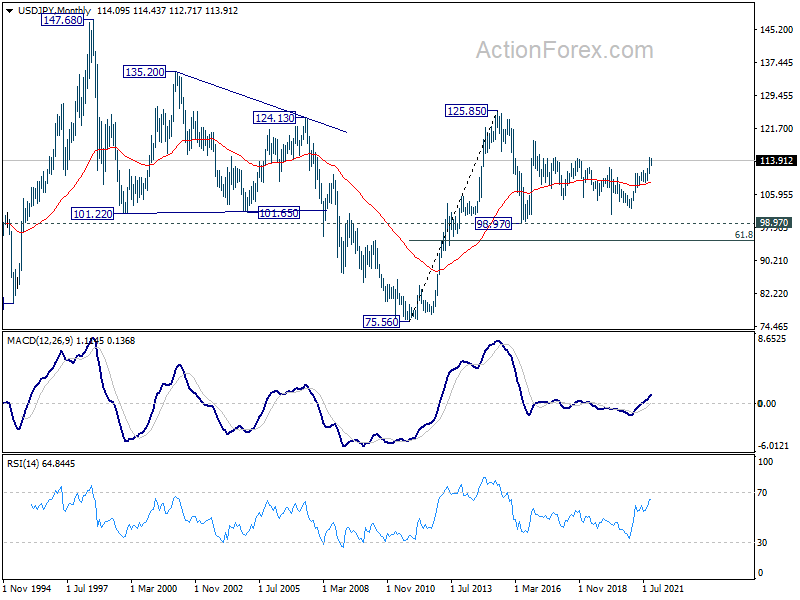
In the long term picture, the rise from 75.56 (2011 low) long term bottom to 125.85 (2015 high) is viewed as an impulsive move, no change in this view. Price actions from 125.85 are seen as a corrective pattern which could still extend. In case of deeper fall, downside should be contained by 61.8% retracement of 75.56 to 125.85 at 94.77. Up trend from 75.56 is expected to resume at a later stage for above 135.20/147.68 resistance zone.