Sample Category Title
GBP/USD Weekly Outlook
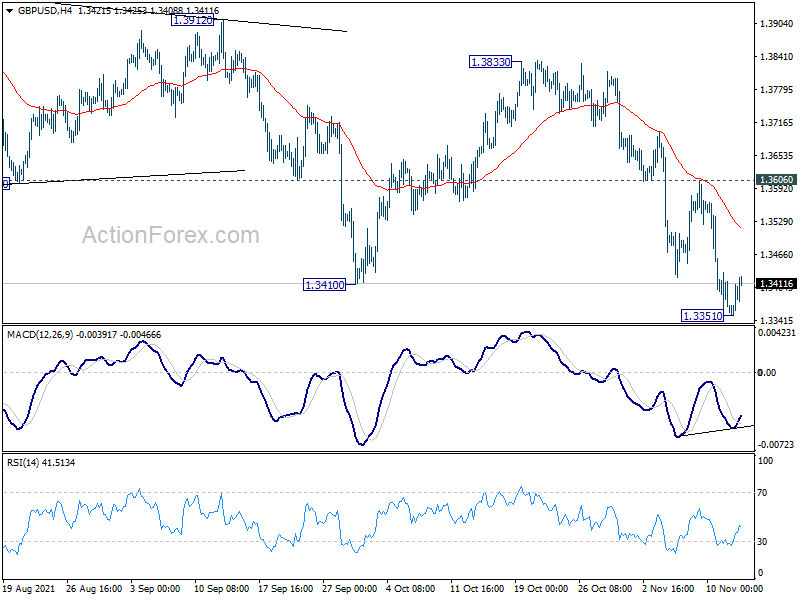
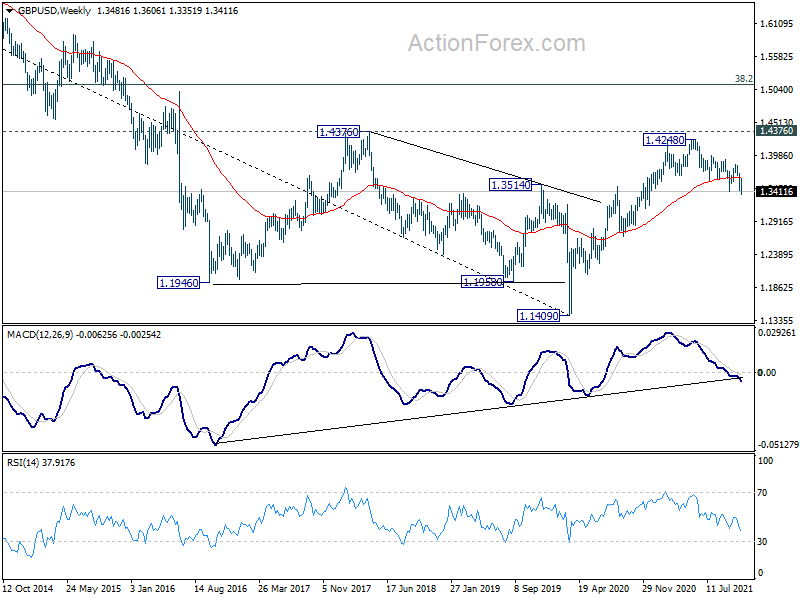
GBP/USD dropped to 1.3351 last week and break of 1.3410 low confirmed resumption of whole fall from 1.4248. But as a temporary low was formed, initial bias is neutral this week first. Upside of recovery should be limited below 1.3606 resistance to bring another fall. Break of 1.3351 will turn bias back to the downside for 1.3164 fibonacci level.
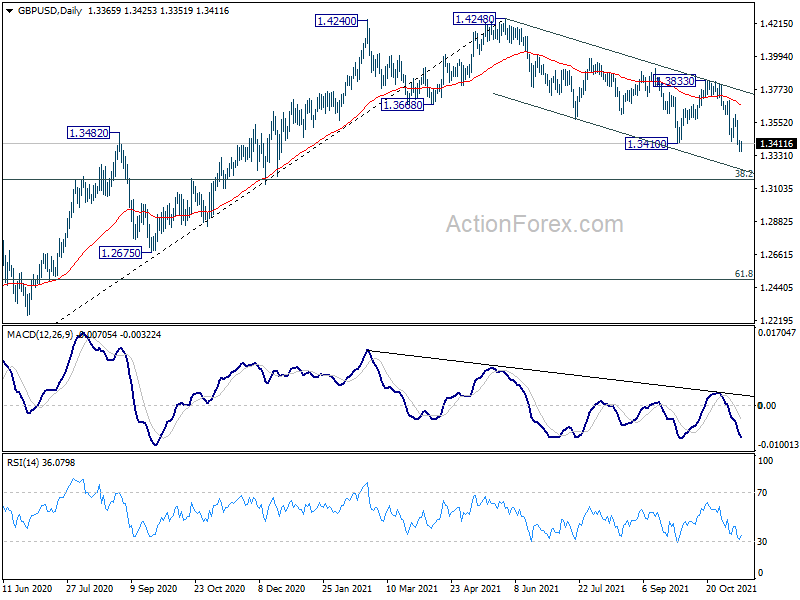
In the bigger picture, the structure of the fall from 1.4248 suggests that it's a correction to the up trend from 1.1409 (2020 low) only. While deeper fall cannot be ruled out yet, downside should be contained by 38.2% retracement of 1.1409 to 1.4248 at 1.3164, at least on first attempt, to bring rebound. On the upside, firm break of 1.4376 key resistance (2018 high) will add to the case of long term bullish reversal. However, sustained trading below 1.3164 will revive some medium term bearishness and target 61.8% retracement at 1.2493.
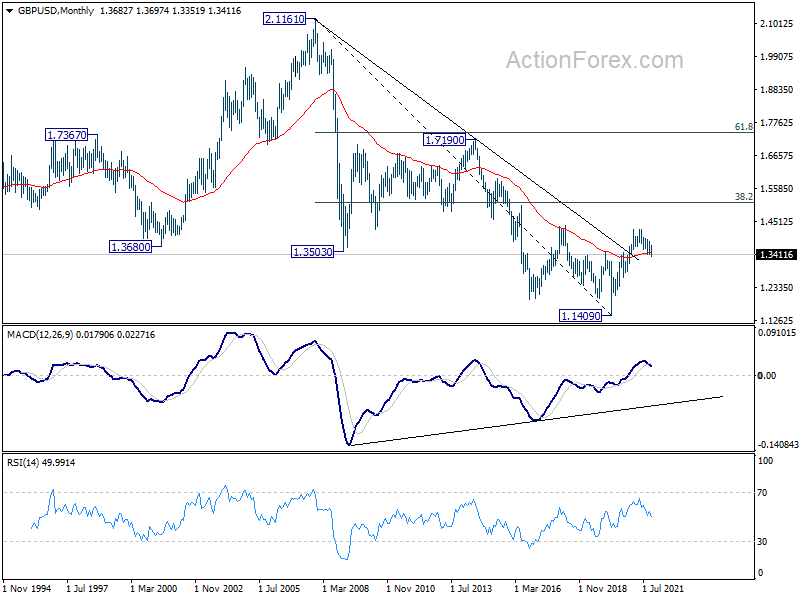
In the longer term picture, a long term bottom should be in place at 1.1409, on bullish convergence condition in monthly MACD. Rise from there would target 38.2% retracement of 2.1161 to 1.1409 at 1.5134. Reaction from there would reveal whether rise from 1.1409 is just a correction, or developing into a long term up trend.
USD/CHF Weekly Outlook
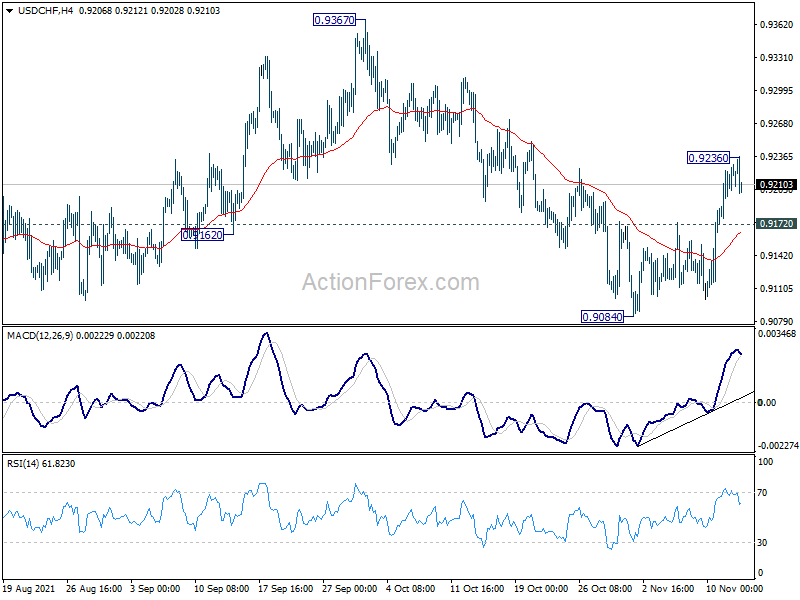
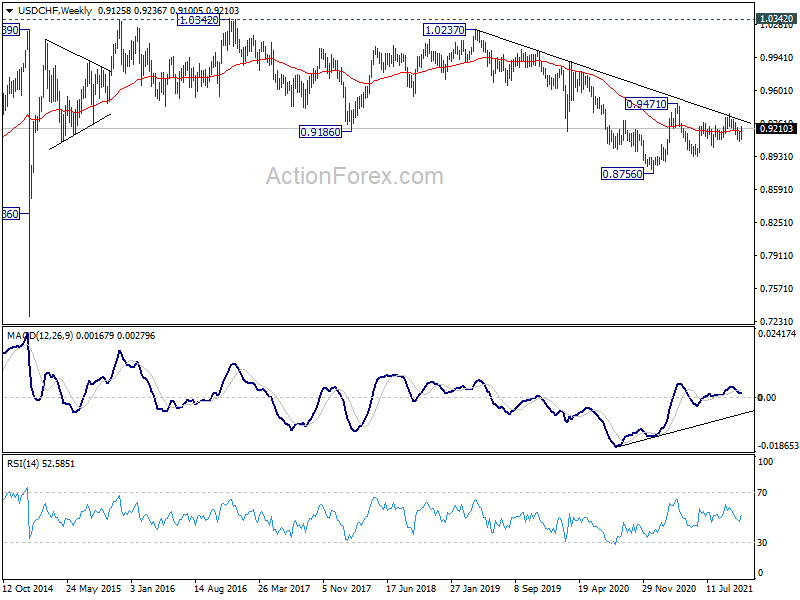
USD/CHF rebounded further to 0.9236 last week. But as a temporary top was formed at 0.9236, initial bias is neutral this week first. On the upside, break of 0.9236 will resume the rise from 0.9084 to 0.9367 resistance. On the downside, below 0.9172 minor support will turn intraday bias back to the downside for 0.9084 instead.
In the bigger picture, the corrective structure of the rebound from 0.8925 argues that fall from 0.9471 is not complete yet. It could either be the second leg of pattern from 0.8756 (2021 low), or resuming larger down trend from 1.0237 (2018 high). We'd pay attention to the downside momentum and assess the odds later. But for now, medium term outlook will be neutral at best as long as 0.9471 resistance holds.
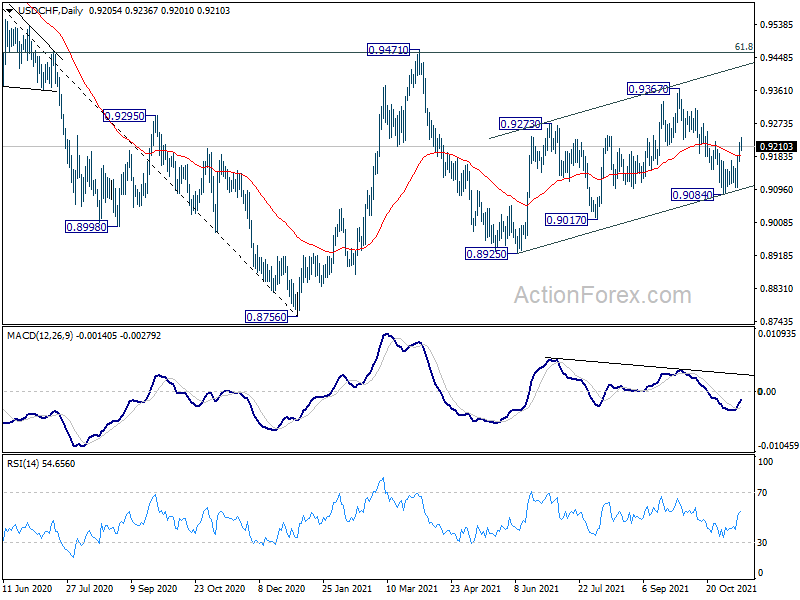
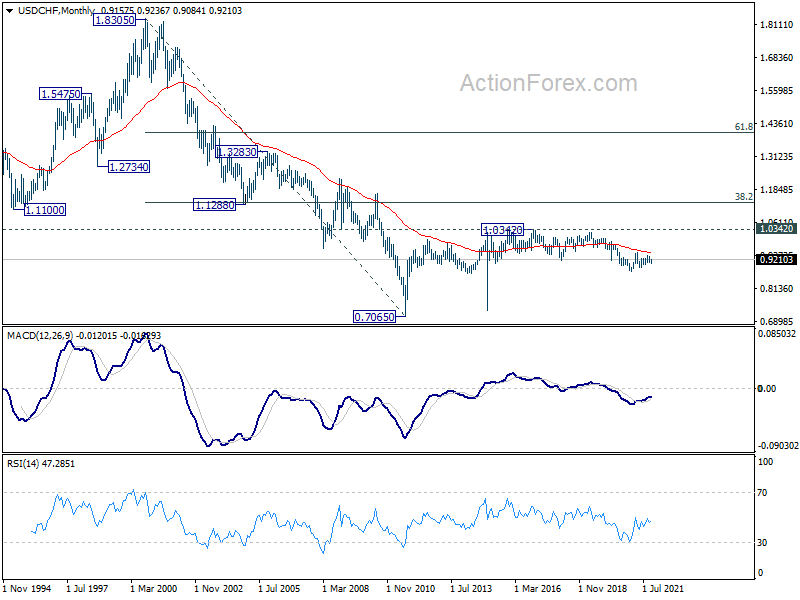
In the long term picture, price actions from 0.7065 (2011 low) are currently seen as developing into a long term corrective pattern, at least until a firm break of 1.0342 resistance.
AUD/USD Weekly Outlook
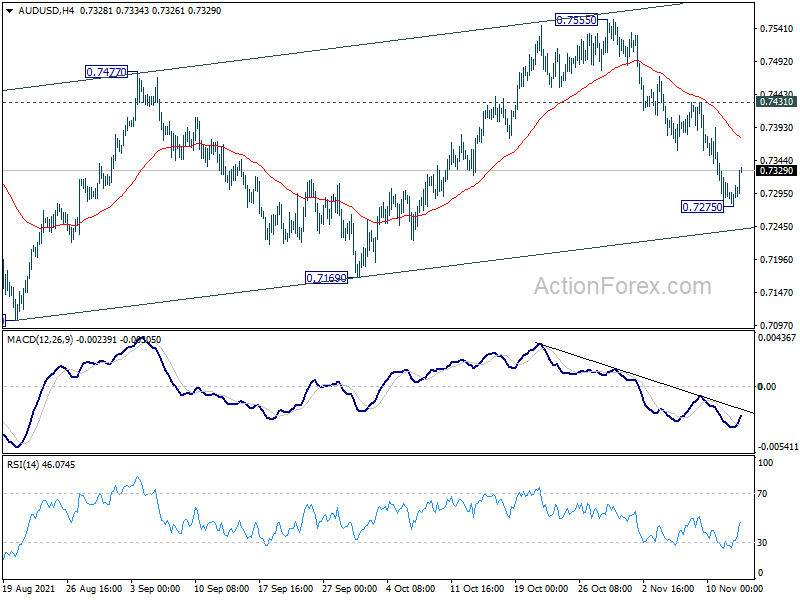
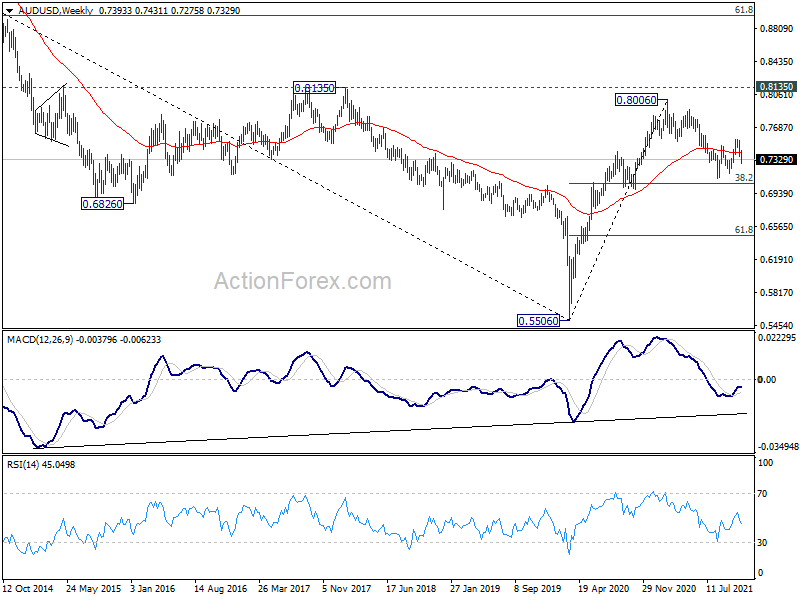
AUD/USD's fall from 0.7555 extended to as low as 0.7275 last week. The development suggests that rebound from 0.7105 is complete with three waves up to 0.7555, and fall from 0.8006 has still in progress. But as a temporary low was formed at 0.7275, initial bias is neutral this week first. On the downside, below 0.7275 will target 0.7169 support first, and then 0.7105. However, break of 0.7431 resistance will turn bias back to the upside for retesting 0.7555.
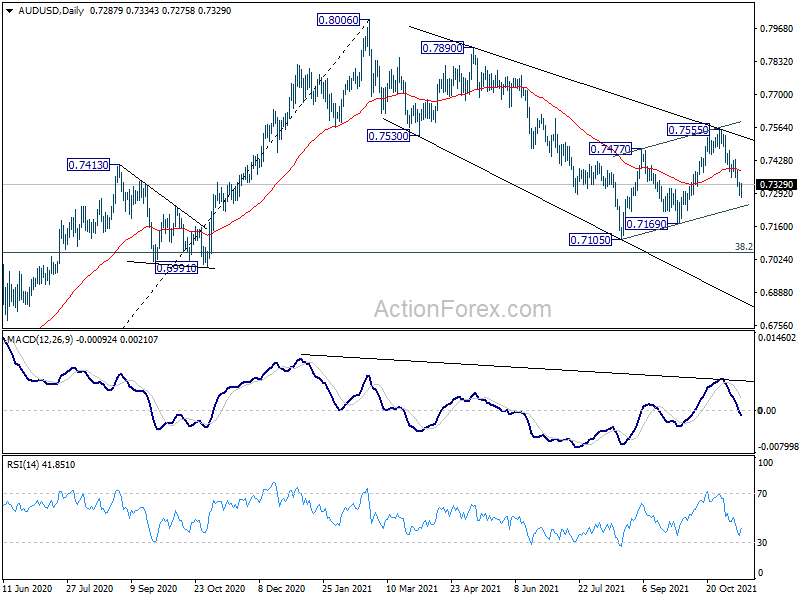
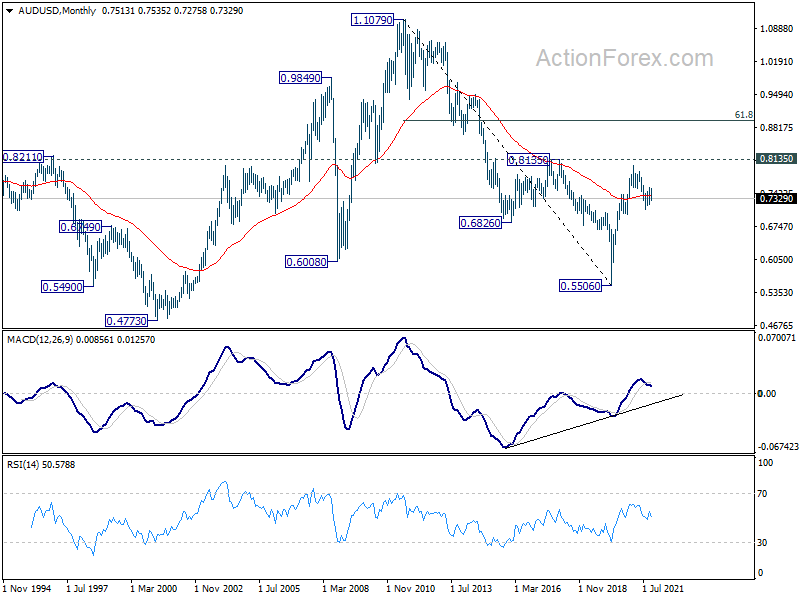
In the bigger picture, with 0.6991 cluster support (38.2% retracement of 0.5506 to 0.8006 at 0.7051) intact, we're seeing price action from 0.8006 as a correction only. That is, up trend from 0.5506 low would resume after the correction completes. In that case, main focus will be 0.8135 key resistance (2018 high). Sustained break there will carry larger bullish implications. However, sustained break of 0.6991 will argue that the whole medium term trend has indeed reversed.
In the longer term picture, focus remains on 0.8135 structural resistance. Decisive break there will argue that rise from 0.5506 is developing into a long term up trend that reverses whole down trend from 1.1079 (2011 high). In that case, further rally would be seen to 61.8% retracement of 1.1079 to 0.5506 at 0.8950 and possibly above. Rejection by 0.8135 will keep long term outlook neutral at best.
USD/CAD Weekly Outlook
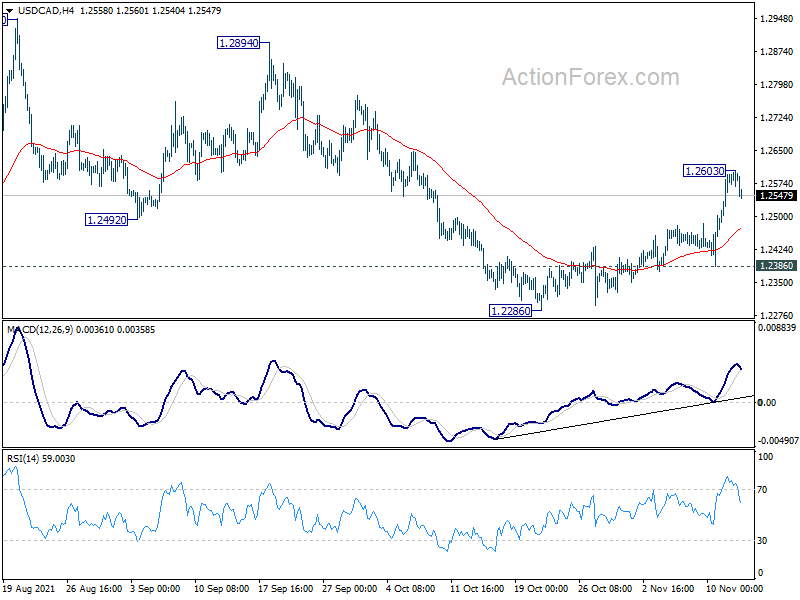
USD/CAD's rise from 1.2286 accelerated to 1.2603 last week. The development argues that fall from 1.2947 has completed with three waves to 1.2286. But as a temporary top was formed, initial bias is neutral this week first. On the upside, break of 1.2603 will resume the rally to 1.2894/2947 resistance zone. However, break of 1.2386 will revive near term bearishness and bring retest of 1.2886 low.
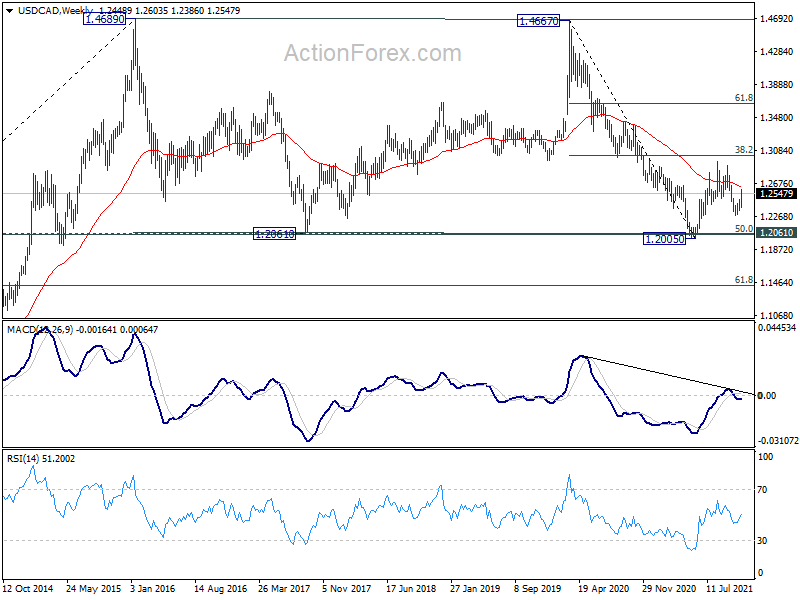
In the bigger picture, medium term outlook is neutral for now. The pair drew support from 1.2061 cluster and rebounded. Yet, upside was limited below 38.2% retracement of 1.4667 to 1.2005 at 1.3022. On the upside, firm break of 1.3022 should affirm the case of medium term bullish reversal. However, break of 1.2286 will turn focus back to 1.2005 low again.
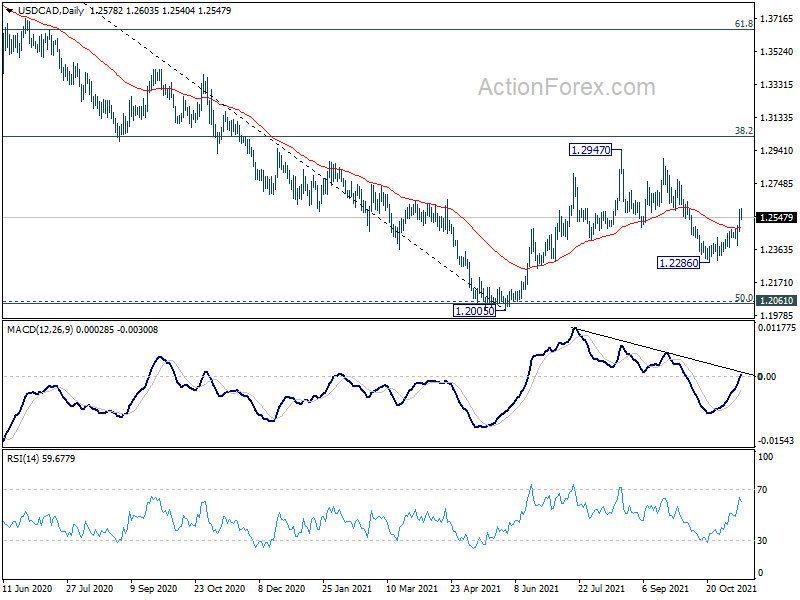
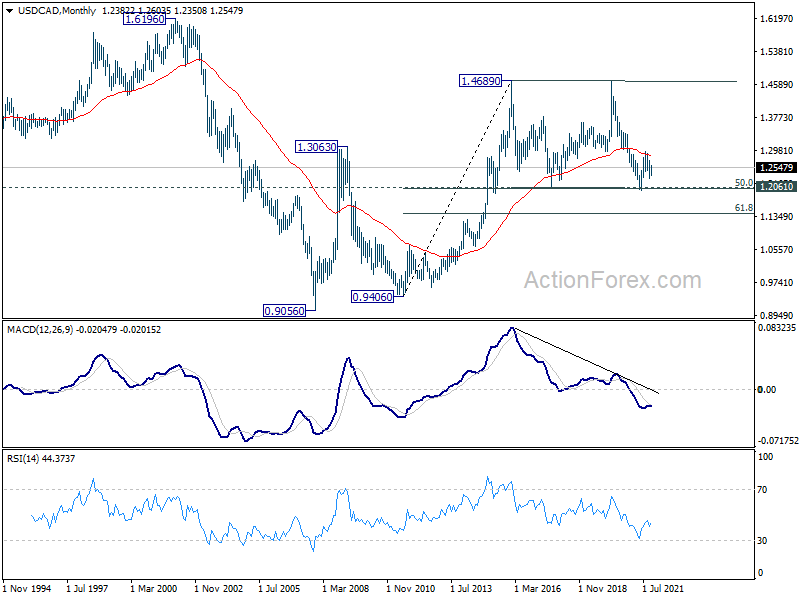
In the longer term picture, we're viewing price actions from 1.4689 as a consolidation pattern. Thus, up trend from 0.9506 (2007 low) is still expected to resume at a later stage. This will remain the favored case as long as 1.2061 support holds, which is close to 50% retracement of 0.9406 to 1.4689 at 1.2048. However, rejection by 55 month EMA, follow by firm break of 1.2061 support, will argue that USD/CAD has already started a long term down trend. Next target is 61.8% retracement of 0.9406 to 1.4689 at 1.1424.
GBP/JPY Weekly Outlook
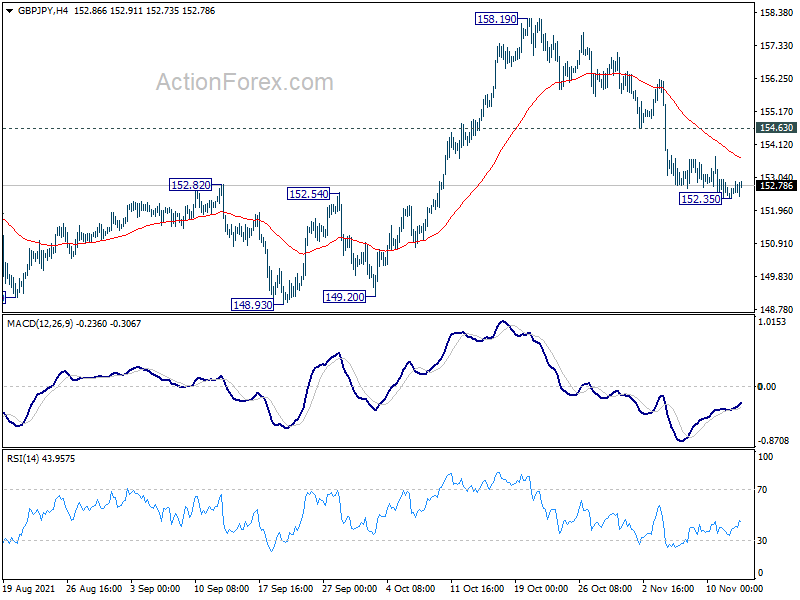
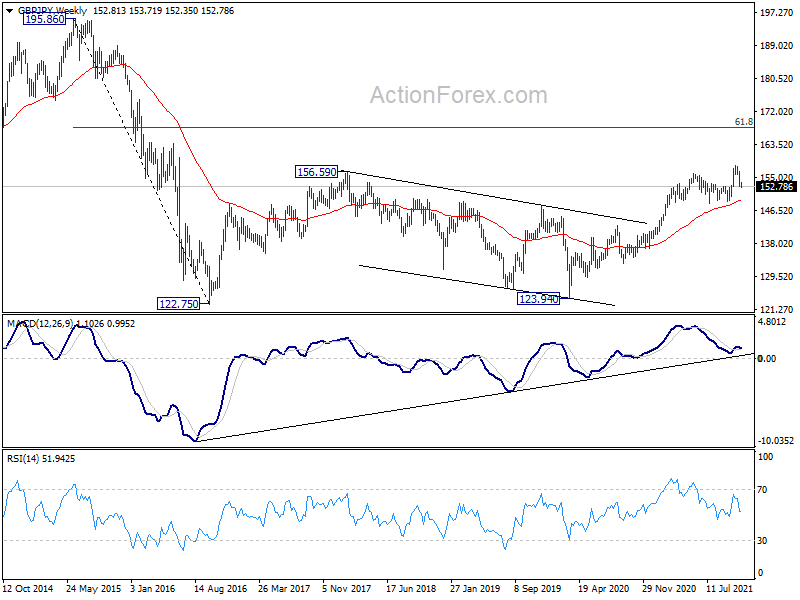
GBP/JPY edged lower to 152.35 last week but formed a temporary bottom there on loss of momentum. Initial bias is neutral this week first. On the downside, break of 152.35 will resume the fall from 158.19 towards 148.93 key support next. On the upside, though, break of 154.63 minor resistance will turn bias back to the upside for retesting 158.19 high.
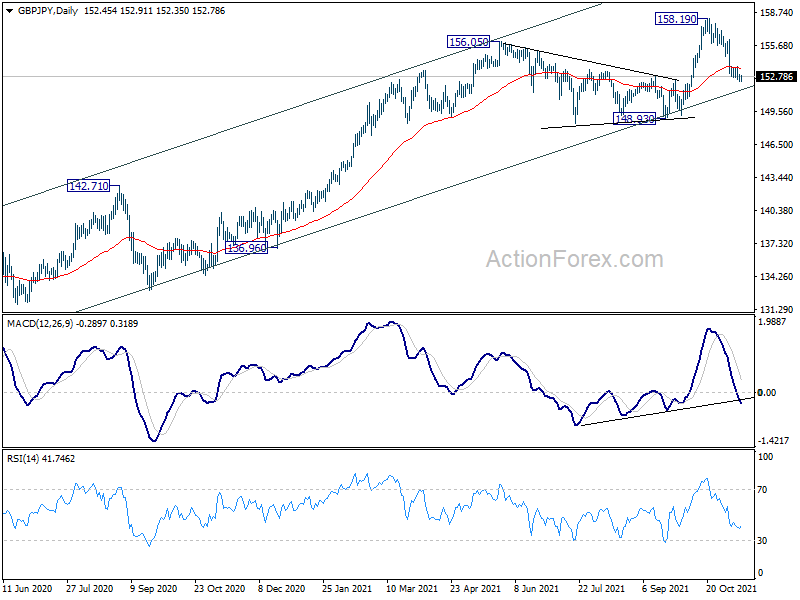
In the bigger picture, rise from 123.94 is seen as the third leg of the pattern from 122.75 (2016 low). The stay above 55 week EMA affirms medium term bullishness. Current rise should now target 61.8% retracement 195.86 (2015 high) to 122.75 at 167.93 next. In any case, outlook will remain bullish as long as 148.93 structural support hold, even in case of deep pull back.
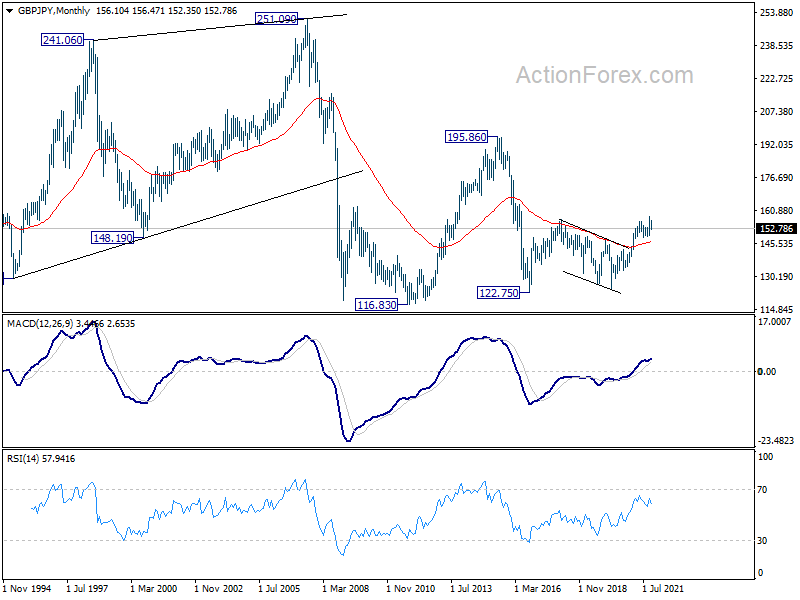
In the longer term picture, GBP/JPY could have set up a long term up trend already with break of 156.69 resistance, and the stay above 55 month EMA. Current rise from 122.75 could target a test on 195.86 (2015 high).
EUR/JPY Weekly Outlook
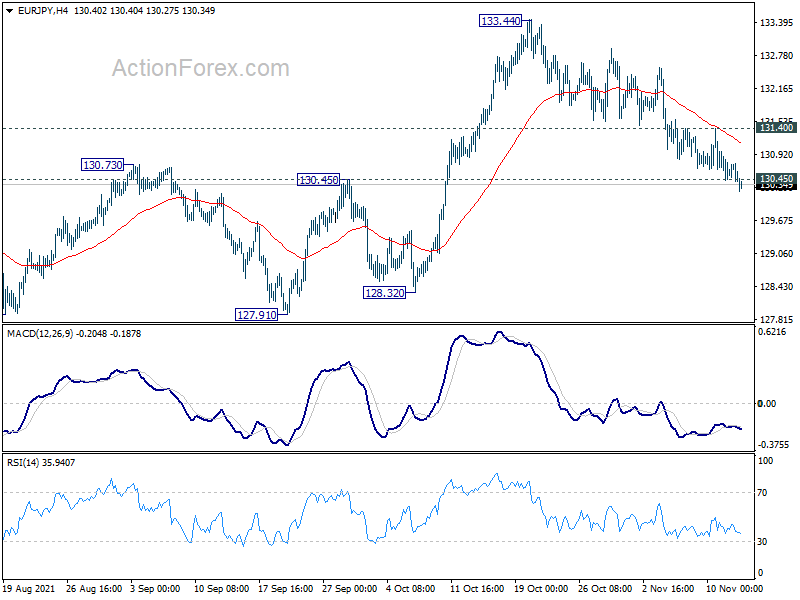
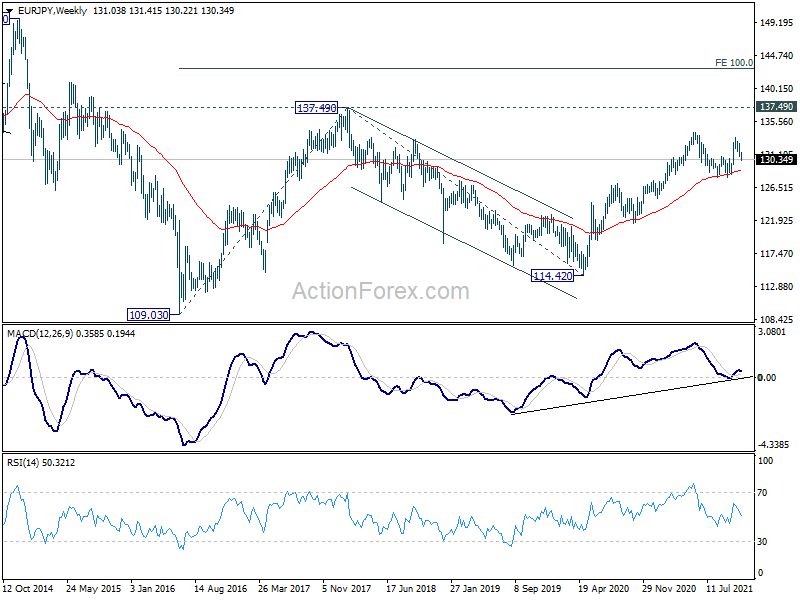
EUR/JPY's fall from 133.44 extended lower to 130.22 last week. The break of 130.45 resistance turned support dampened our original bullish view, and suggest that rise from 127.91 has completed. Initial bias is back on the downside this week for 127.91 key support. On the upside, however, break of 131.40 minor resistance will turn bias back to the upside for stronger rebound.
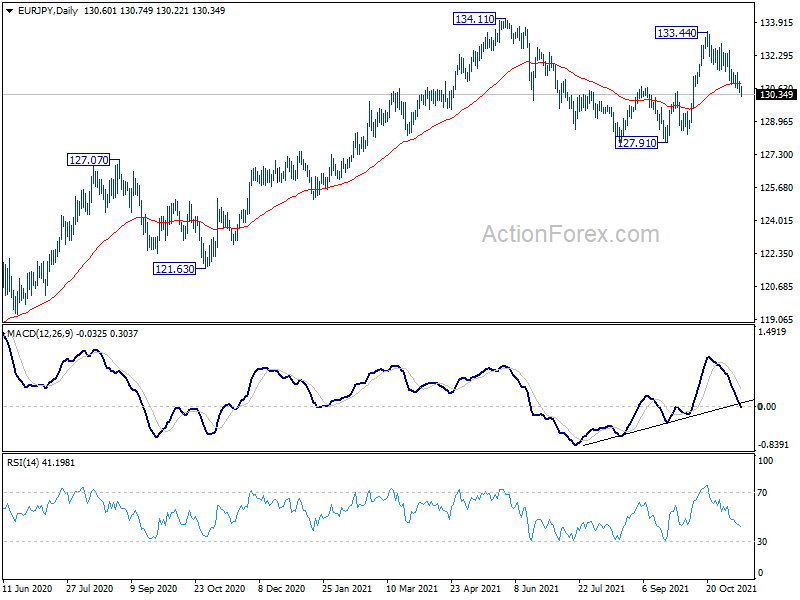
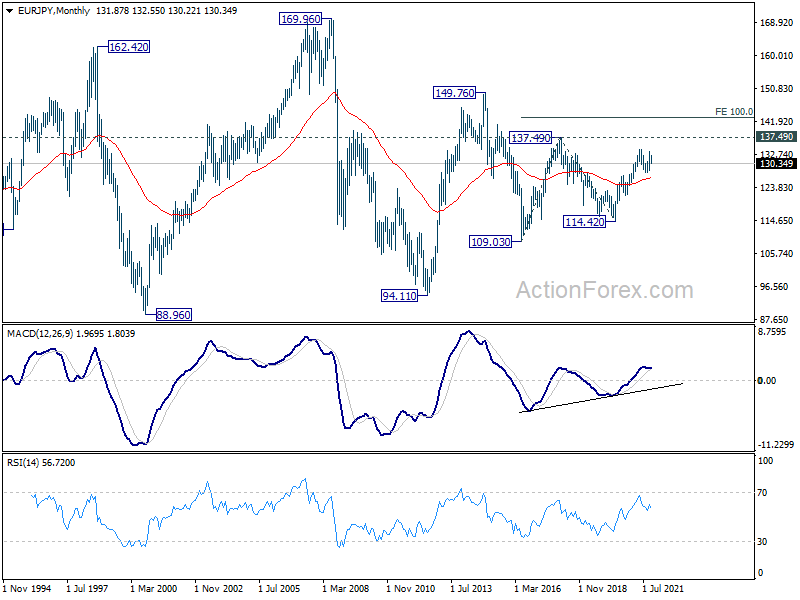
In the bigger picture, rise from 114.42 (2020 low) is still in progress and the strong support support from 55 week EMA affirms medium term bullishness. Further rise would be seen to retest 137.49 (2018 high). Decisive break there will resume the whole long term rise from 109.03 (2016 low). Next target will be 100% projection of 109.03 to 137.49 from 114.42 at 142.88. This will now remain the favored case as long as 127.91 support holds.
In the long term picture, EUR/JPY is staying in long term sideway pattern, established since 2000. Another rising leg in progress for 137.49 resistance and above.
EUR/GBP Weekly Outlook
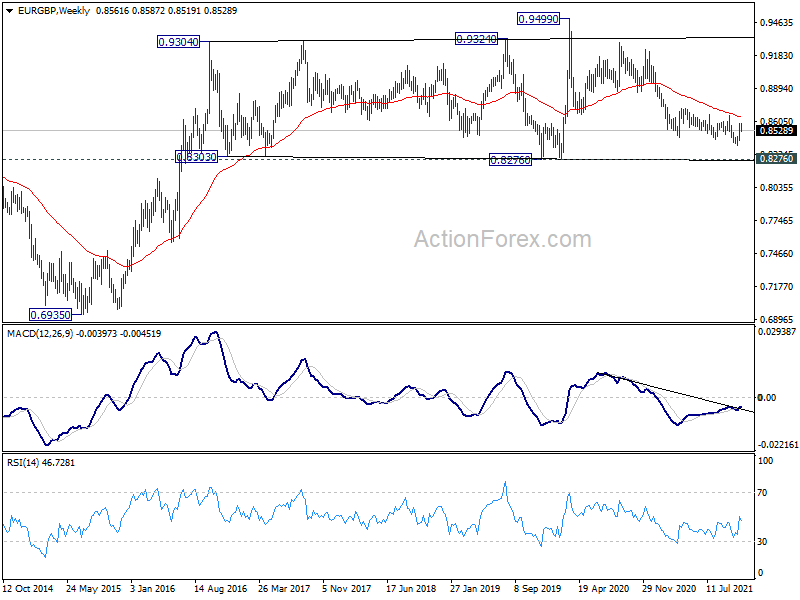
EUR/GBP stayed in consolidation below 0.8593 temporary top last week. Outlook is unchanged and initial bias is neutral this week first. Above 0.8593 will resume the rise from 0.8401 short term bottom to 0.8656 key resistance. Firm break there will argue that whole down trend from 0.9499 has completed. On the downside, however, break of 0.8459 minor support will bring retest of 0.8401 low instead.
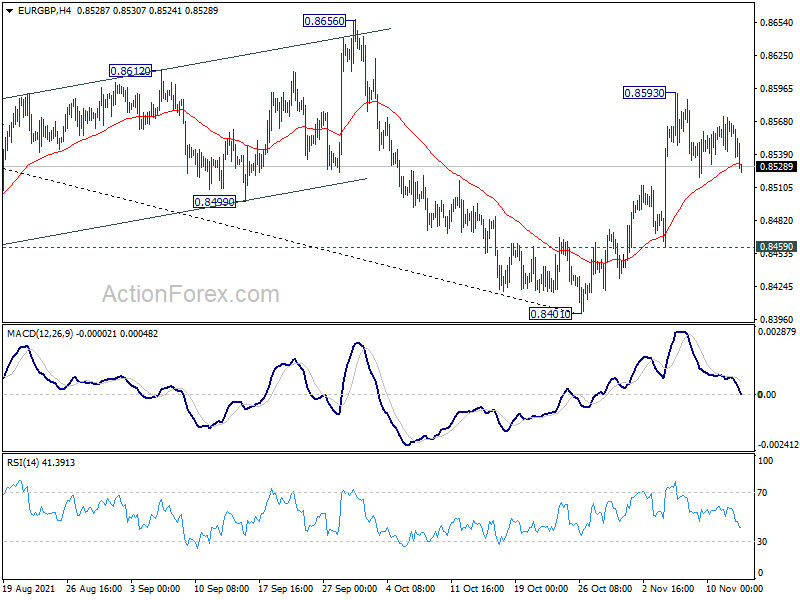
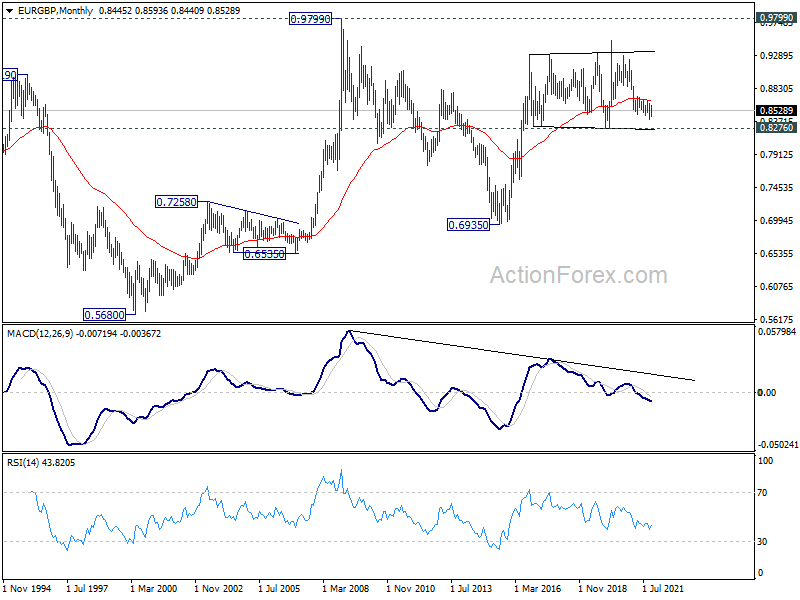
In the bigger picture, price actions from 0.9499 (2020 high) are still seen as developing into a corrective pattern. Deeper fall could be seen as long as 0.8656 resistance holds, towards long term support at 0.8276. However, firm break of 0.8656 resistance would argue that a medium term bottom was already formed. Stronger rise would be seen to 0.8861 support turned resistance to confirm completion of the corrective pattern.
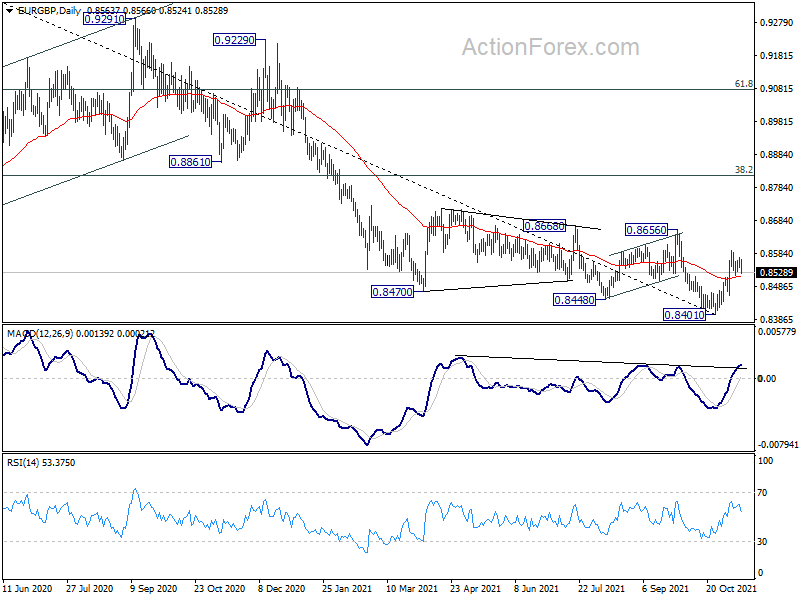
In the long term picture, outlook will stay bullish as long as 0.8276 support holds. Break of 0.9499 is in favor at a later stage, to resume the up trend from 0.6935 (2015 low).
EUR/AUD Weekly Outlook
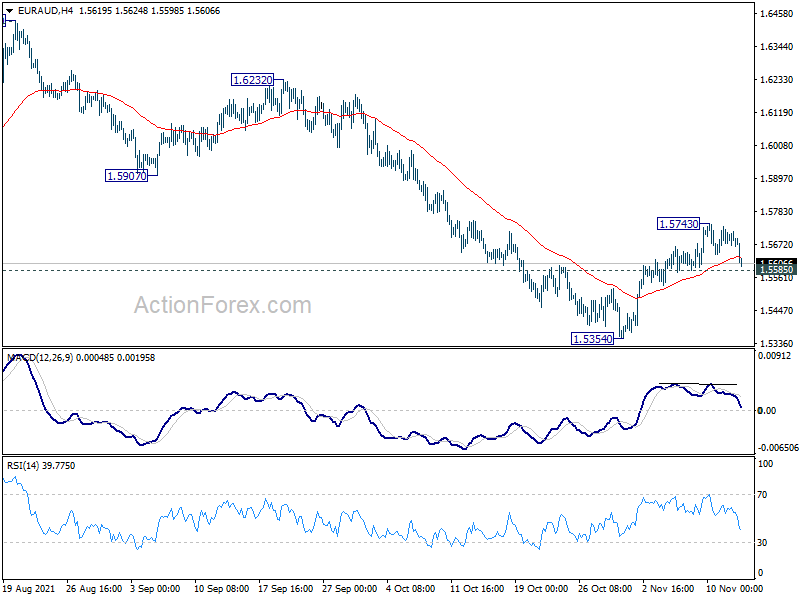
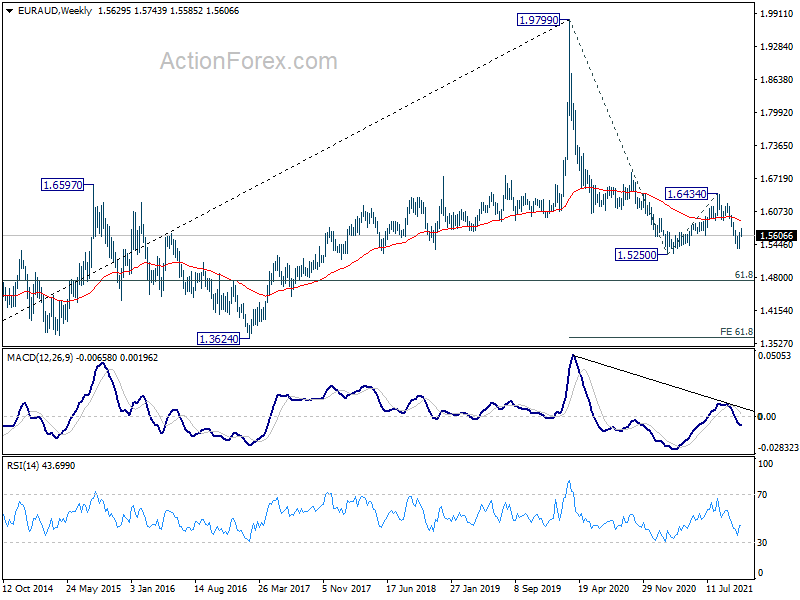
EUR/AUD edged higher to 1.5743 last week but lost momentum since then. Initial bias is neutral this week. ON the downside, break of 1.5585 minor support should confirm rejection by 55 day EMA (now at 1.5755). Intraday bias will be turned back to the downside to extend the fall from 1.6434 through 1.5354. On upside, however, sustained break of 55 day EMA will argue that whole fall from 1.6434 has completed and bring stronger rally.
In the bigger picture, the down trend from 1.9799 (2020 high) is in progress. Firm break of 1.5250 low will confirm resumption and target 61.8% retracement of 1.1602 (2012 low) to 1.9799 at 1.4733. Sustained break there could bring more downside acceleration to 61.8% projection of 1.9799 to 1.5250 from 1.6434 at 1.3623. In any case, break of 1.6434 resistance is needed to signal medium term bottoming, or outlook will stay bearish.
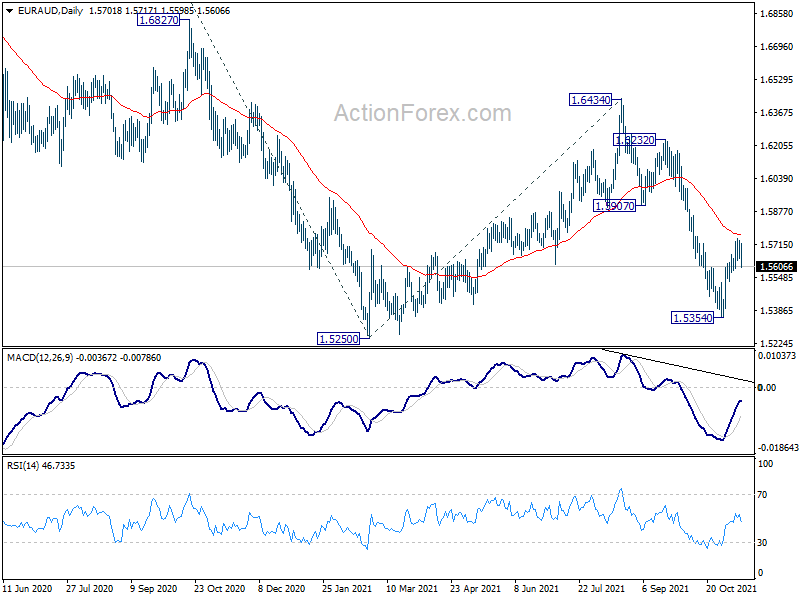
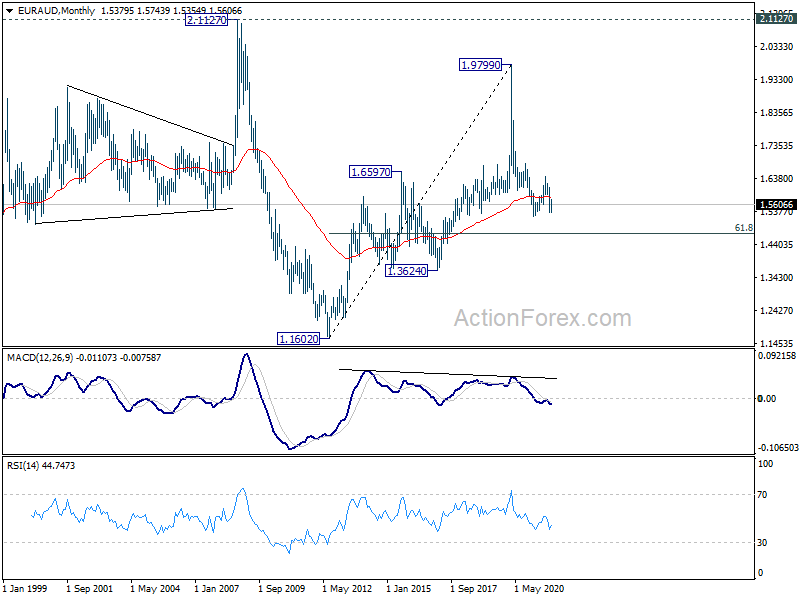
In the longer term picture, fall from 1.9799 (2020 high) is seen as a long term down trend. Sustained break of 61.8 retracement of 1.1602 to 1.9799 at 1.4733 will extend the decline to 1.3624 long term support and possibly below.
EUR/CHF Weekly Outlook
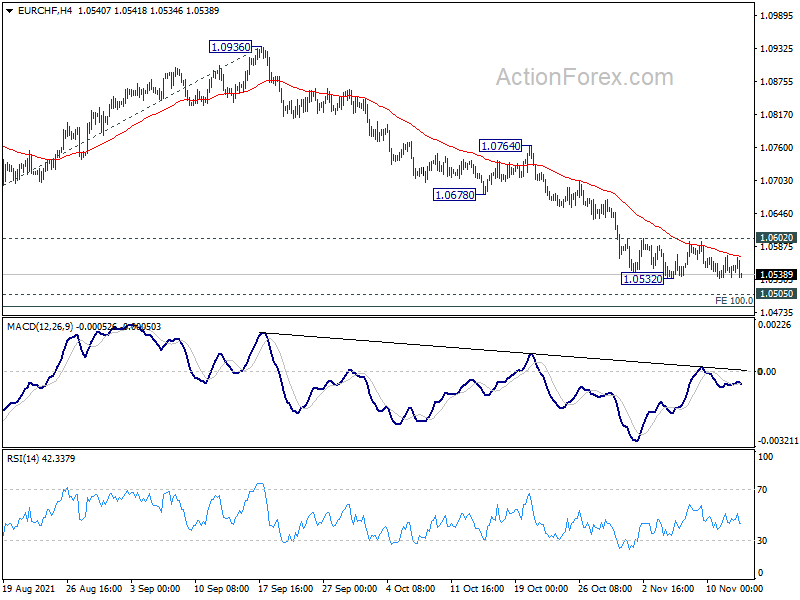
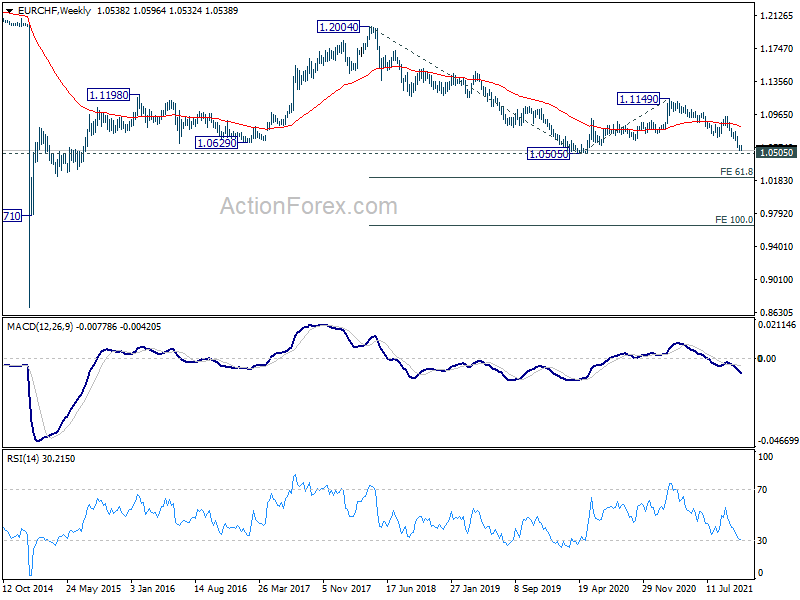
EUR/CHF turned into sideway trading last week but recovery was limited by 1.0602 minor resistance. Initial bias remains neutral this week first and further fall is expected. Break of 1.0532 will resume down trend from 1.1149 to 100% projection of 1.1149 to 1.0694 from 1.0936 at 1.0481. On the upside, however, break of 1.0602 will turn bias to the upside for stronger rebound back towards 1.0678 support turned resistance.
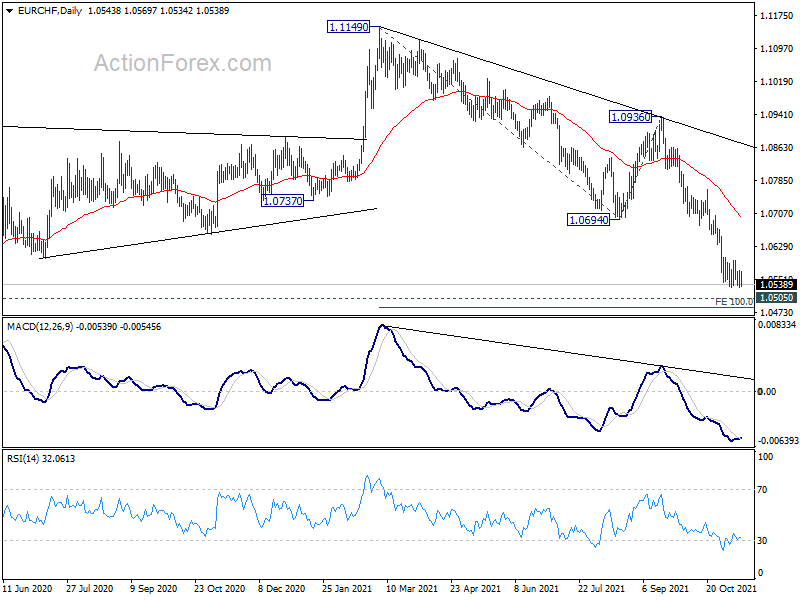
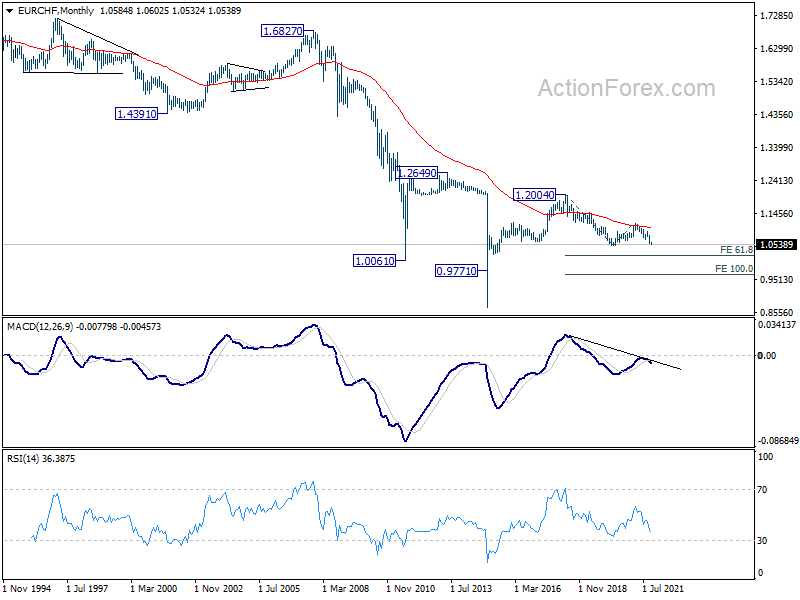
In the bigger picture, current downside momentum argues that fall from 1.1149 is probably resuming the down trend from 1.2004 (2018 high). Next focus is 1.0505 (2020 low). Decisive break there will confirm this bearish case and target 61.8% projection of 1.2004 to 1.0505 to 1.1149 at 1.0223 next. Strong support from 1.0505 will bring rebound first. But outlook will stay bearish as long as 1.0936 resistance holds.
In the long term picture, rejection by 55 month EMA (now at 1.1015) maintains long term bearishness. Break of 1.0505 low will resume the down trend from 1.2004 to 61.8% projection of 1.2004 to 1.0505 to 1.1149 at 1.0223. Firm break there will target 100% projection at 0.9650.
Dollar Surges as Markets Added to Bets on June Fed Hike
Traders added to the bet of a June rate hike by Fed after stronger consumer inflation reading. Dollar surged across the board with Dollar index taking out an important fibonacci level. Benchmark currency yields staged a strong rebound. But stocks were very resilient despite intensify speculation of an early Fed hike and rising yields. Gold also delivered a long-waited upside breakout in spite of Dollar strength.
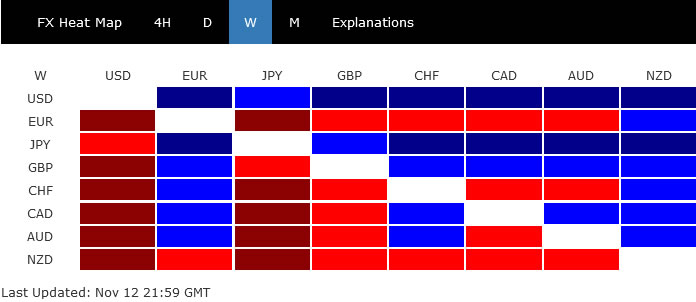
Back in the currency markets, Yen was surprisingly the second strongest one but momentum has diminished towards the end of the week. Other currencies were mixed with Kiwi ended as the worst performing, followed by Euro and Swiss Franc. Inflation data will remain the focuses this week with CPI from UK, Canada and Japan featured. Also, eyes will be on how FOMC members would react to the current "transitory" surge in inflation.
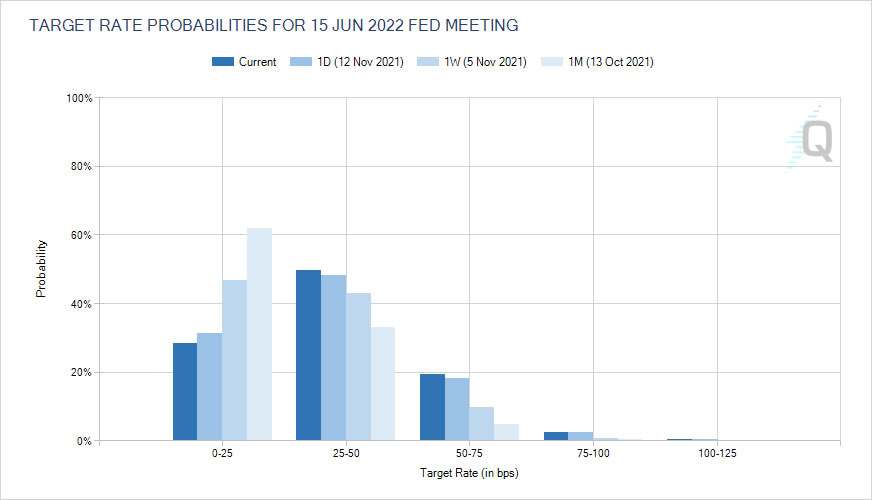
Markets pricing in 72% chance of Fed hike by June
US consumer inflation was the biggest, and lasting, market driver last week, as CPI surged to 6.2% yoy in October. That's the highest level in over three decades, and the fifth straight month of reading above 5%. The speculation of an earlier rate hike by Fed reignited after the data. Fed funds futures are now pricing in 72% chance of one 25bps rate hike by Fed or more by June next year. That's sharply higher than 53.3% a week ago and nearly double of 38.2% a month ago.
Dollar index broke key fibonacci resistance finally
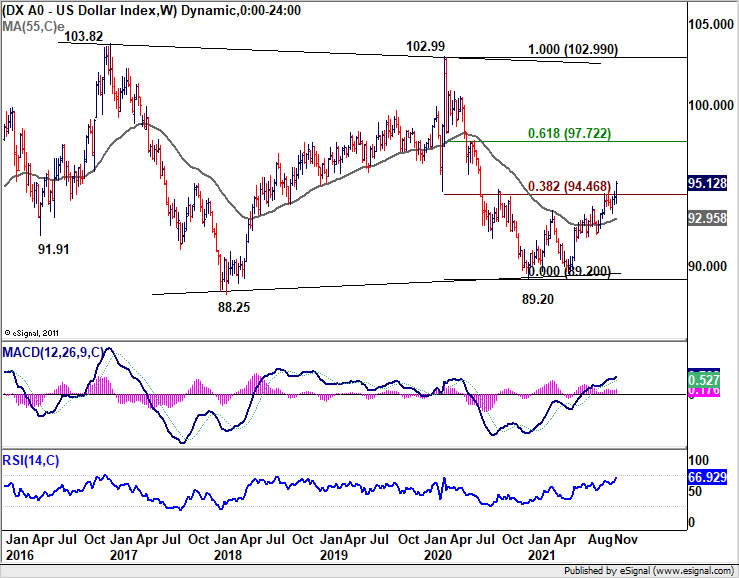
Dollar index surged to close at 95.12, resuming whole rise from 89.20. More importantly, 38.2% retracement of 102.99 to 94.46 has finally been taken out decisively. Near term outlook will now stay bullish as long as 93.27 support holds, for further rise to 61.8% retracement at 97.72.
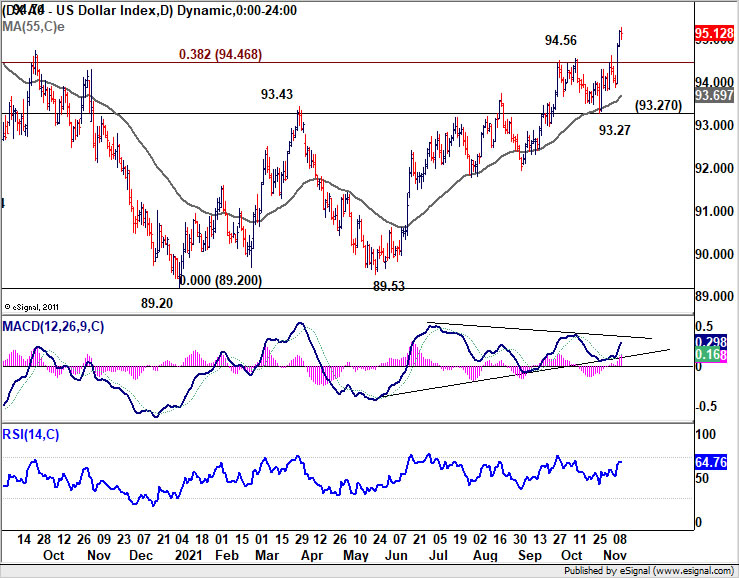
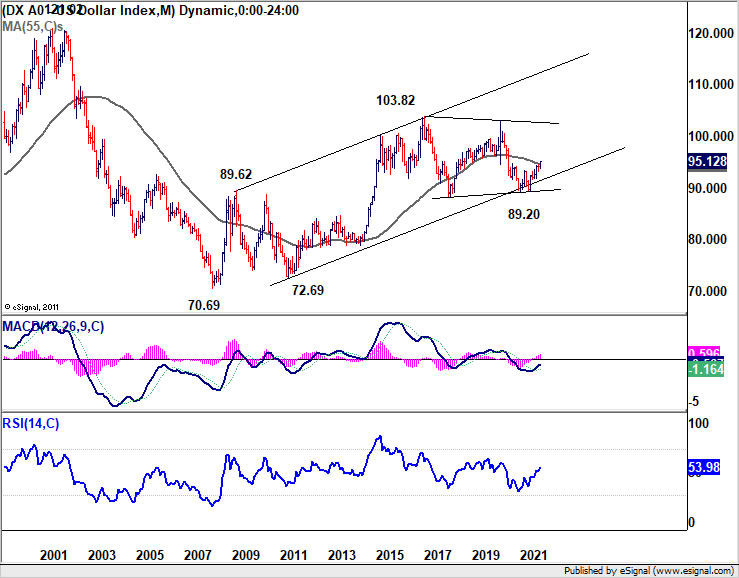
The question now is whether the corrective pattern from 103.82 (2017 high) is complete with three waves to 89.20. Or, it's a triangle pattern in it's fourth leg. The medium term momentum above 97.72 fibonacci level will reveal some hints on which case it is. For now, we'll just keep monitoring the development first.
10-year yield rebounded but no upside breakout
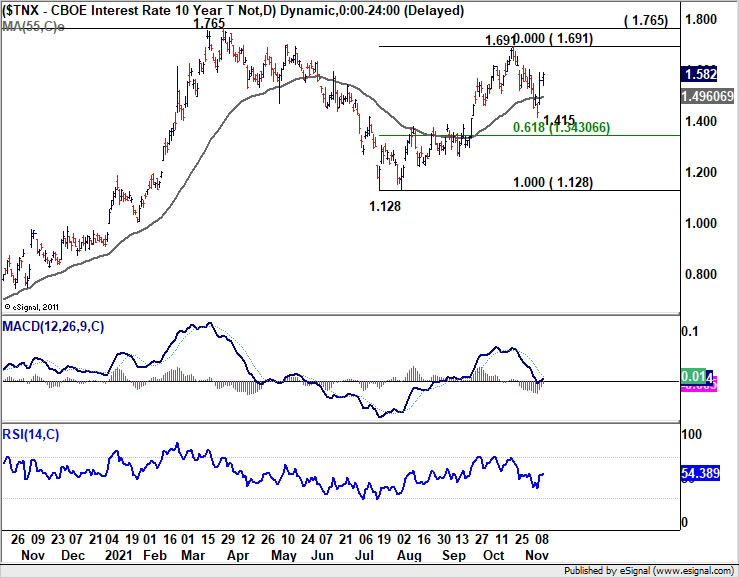
10-year yield staged a very strong rebound from 1.415 last, closing at 1.582. Yet there is no clear sign that consolidation from 1.691 is finished. Even so, there is an important resistance level ahead at 1.765. For now, while 1.415 should be a floor at least for the near term, outlook is neutral first and more range trading could be seen. Such development could cap USD/JPY's rally attempts.
S&P 500 stays on bullish course after brief pull back
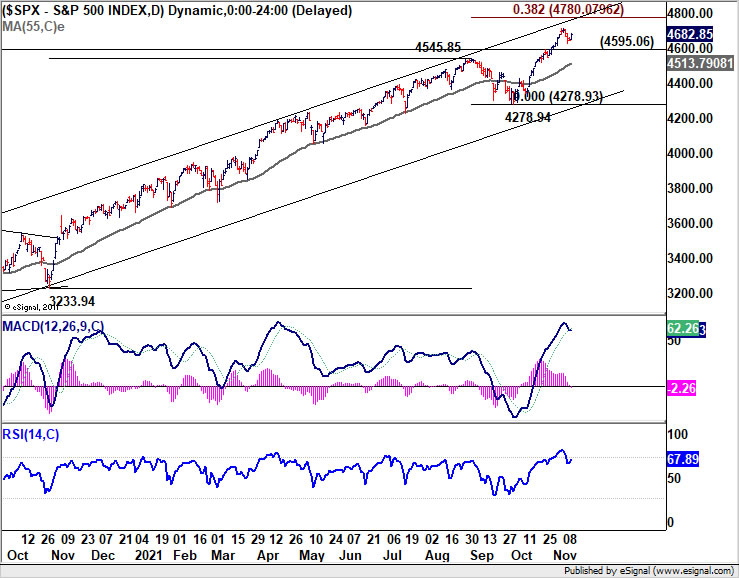
The intra-week pull back in US stocks was relatively shallow and brief. S&P 500 was held well above 4595.06 support and rebounded to close the week. Near term outlook stays bullish for next target of 38.2% projection of 3233.94 to 4545.85 from 4278.94 at 4780.07. However, daily MACD is already dipping down while SPX will approaches medium term channel resistance on next rise. Upside 4780.07 could provide some significant resistance to limit upside for the first attempt and bring a lengthier consolidation.
Gold to target 1909 after upside breakout
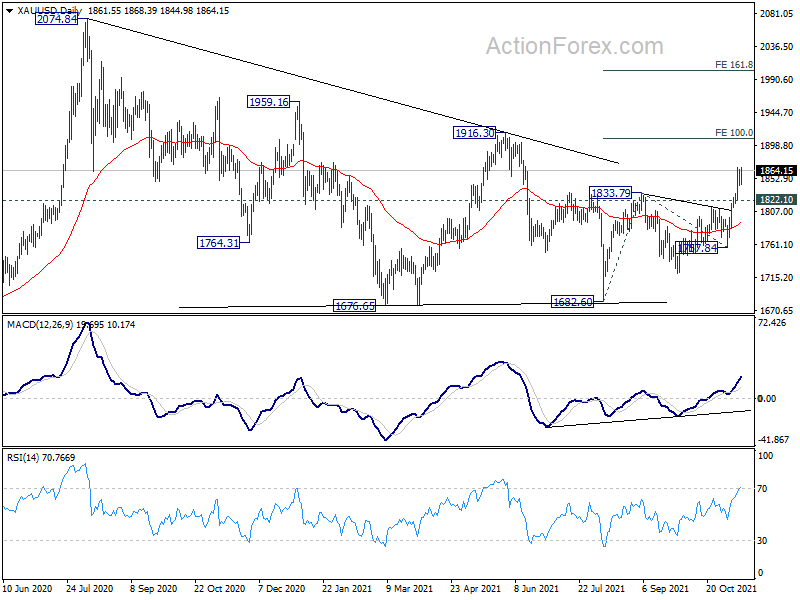
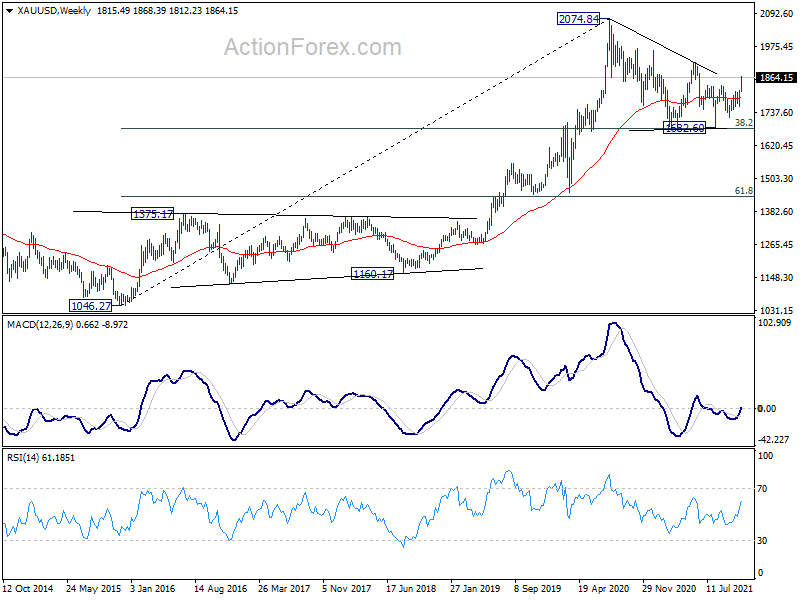
In other markets, Gold also rebounded fiercely to US inflation data and broke through 1833.79 resistance firmly. The development firstly confirms resumption of whole rise from 1682.60. More importantly, it reaffirms the case that corrective pattern from 2074.84 is completed. Near term outlook will stay bullish as long as 1822.10 support holds. Next target is 100% projection of 1682.60 to 1833.79 from 1757.84 at 1909.30, which is close to 1916.30 resistance. Sustained break above this level will further affirm medium term bullish and target 161.8% projection at 2002.46 next.
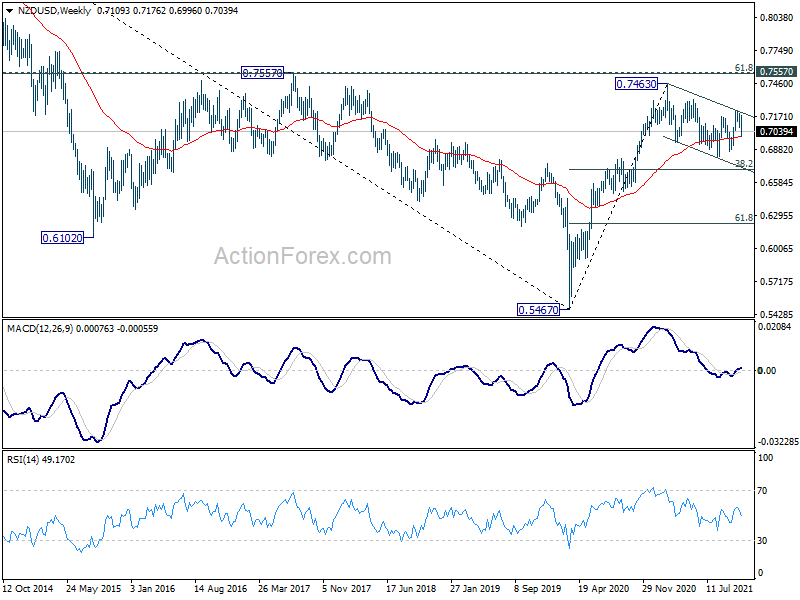
NZD/USD to extend medium term correction from 0.7463
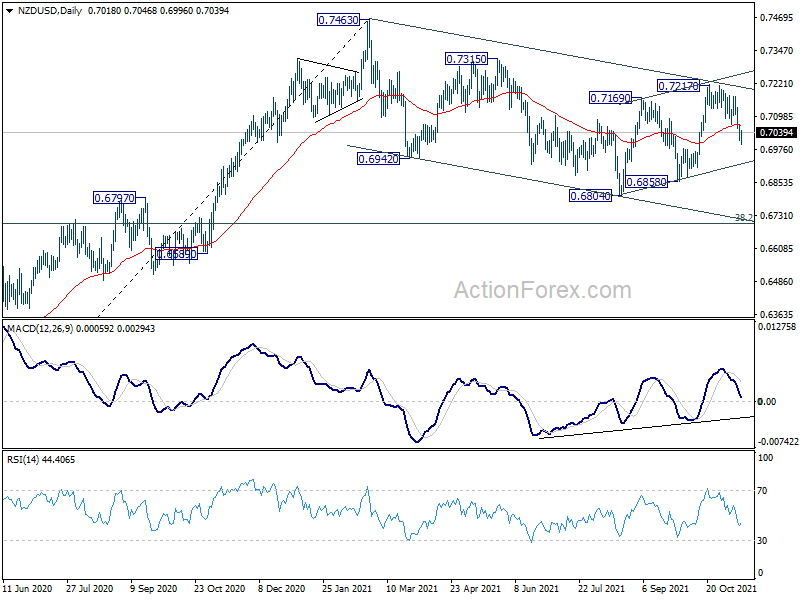
NZD/USD was the biggest mover last week, losing -1.12%. The development suggests that corrective pattern from 0.6804 is complete with three waves up to 0.7217. More importantly, the rejection by medium term channel resistance argues that correction from 0.7463 is still in progress.
Break of 0.6858 support will firm this bearish case and should bring deeper fall through 0.6804 to 38.2% retracement of 0.5467 (2020 low) to 0.7463 (2021 high) at 0.6701. Also, for now, risk will stay on the downside as long as 0.7217 resistance holds, even in case of strong recovery.
EUR/USD Weekly Outlook
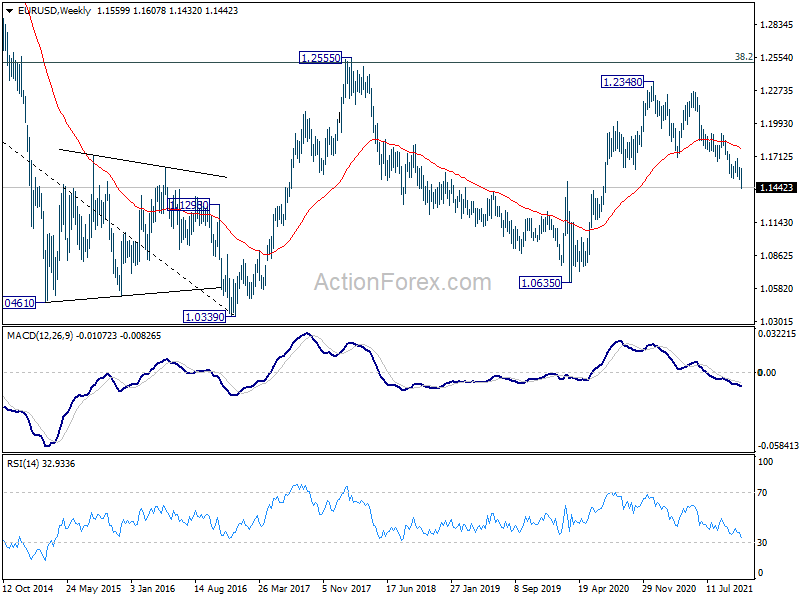
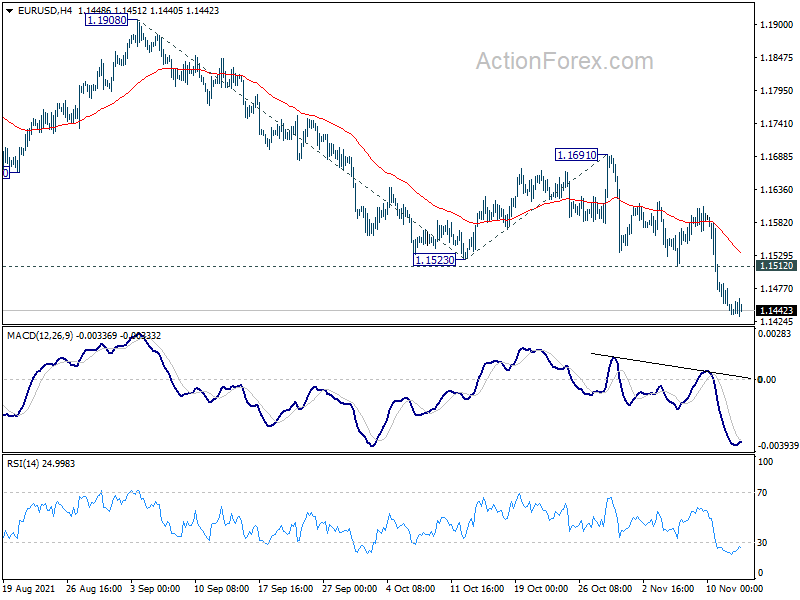
EUR/USD's down trend continued last week and hit as low as 1.1432. Initial bias remains on the downside this week for 100% projection 1.1908 to 1.1523 from 1.1691 at 1.1453 at 1.1306, which is close to long term fibonacci level at 1.1289. We'd pay attention to bottoming signal there. On the upside, above 1.1512 minor resistance will turn intraday bias neutral first. But overall near term outlook will stay bearish as long as 1.1691 resistance holds, even in case of strong rebound.
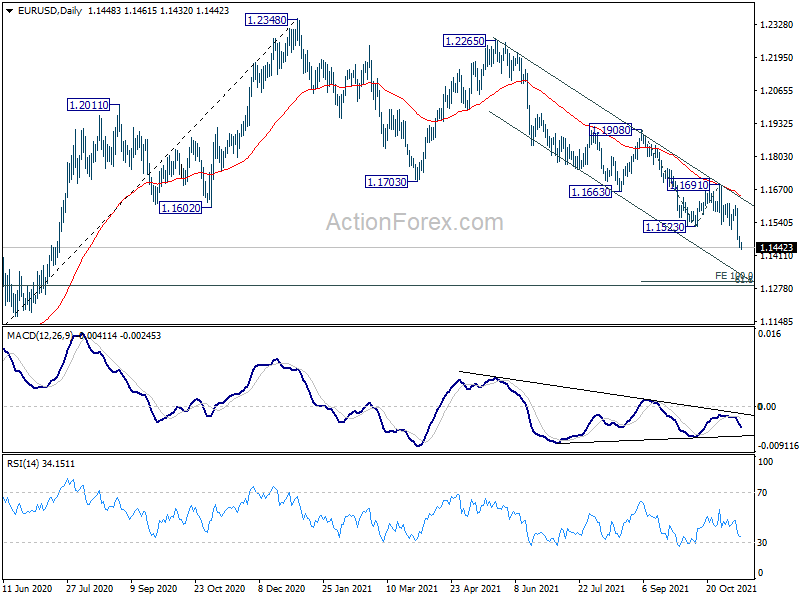
In the bigger picture, there are various ways of interpreting the fall from 1.2348 (2021 high). It could be a correction to rise from 1.0635 (2020 low), the fourth leg of a sideway pattern from 1.0339 (2017 low), or resuming long term down trend. In any case, outlook will now stay bearish as long as 1.1703 support turned resistance holds. Sustained break of 61.8% retracement of 1.0635 to 1.2348 at 1.1289 could pave the way back to 1.0635.
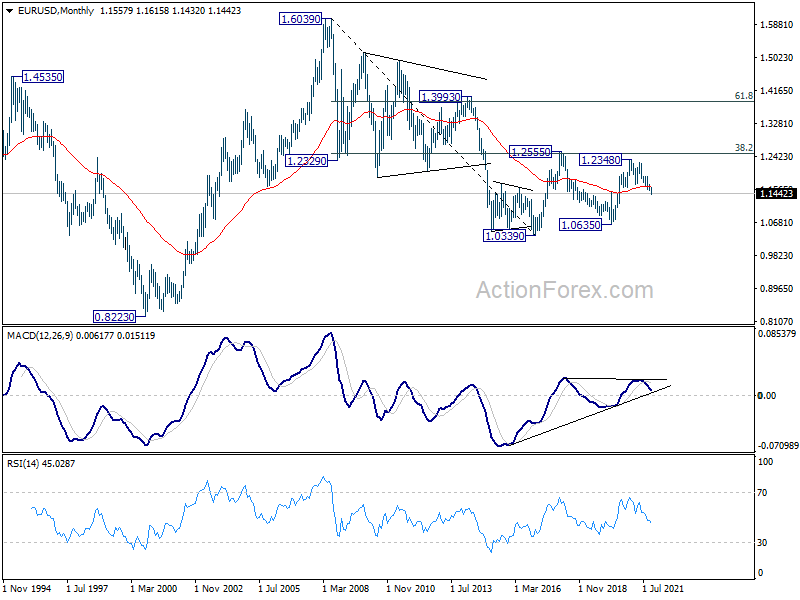
In the long term picture, EUR/USD has possibly failed 1.2555 cluster resistance (38.2% retracement of 1.6039 to 1.0339 at 1.2516) again. Long term outlook will remain neutral as sideway pattern from 1.0339 (2017 low) is extending with another medium term fall. For now, we'd hold back from assessing the chance of downside breakout, and monitor the momentum of the decline from 1.2348 first.