Sample Category Title
Asian Equities Dip On China Nerves
China PPI and property sector nerves send equities lower
An elevated PPI print from China this morning and China property sector nerves have seen Asian stock markets fall mostly into the red today after Wall Street finally saw a modest correction low after a multi-day rally. China’s PPI release reached a record high of 13.50% YoY for October, with officials blaming weather, material and energy costs. That overshadowed the Inflation data, released at the same time, which came in elevated, but on target at 1.50% YoY for October. The PPI should retreat into the end of the year, thanks to falling iron ore prices, now at one-year lows, and coal prices. Still, Asia is on inflation alert, fearing future costs of inputs from goods sourced from China.
Overnight, the S&P 500 fell by 0.35%, the Nasdaq lost 0.60% and the Dow Jones eased by 0.31% after multi-year highs in US PPI spurred profit-taking. In Asia, futures on all three indexes have lost another 0.40%, deepening the negative sentiment in regional markets.
The Nikkei 225 is 0.70% lower, while South Korea’s Kospi has dropped by 0.90%. China equity markets are being hit hard with the Shanghai Composite retreating 1.20% with the narrower Shanghai 50 now 1.80% lower. The CSI 300 has fallen by 0.75%, while the Hang Seng has retreated by 1.30%.
In regional markets, Singapore is 0.55% lower and Kuala Lumpur has fallen by 0.35%. Taipei is outperforming relatively, unchanged on the day. Jakarta is 0.20% lower with Bangkok and Manila down 0.45%. Australian markets are slightly lower as well, the ASX 200 falling 0.33% and the All Ordinaries easing by 0.20%.
The broad weakness that has flowed from Wall Street into Asia today is likely to lead to a lower opening for European stocks. It seems that investors are keen to lower exposure into the US CPI data tonight. If that passes without incident, though, it would not surprise me in the least to see the equity rally resume.
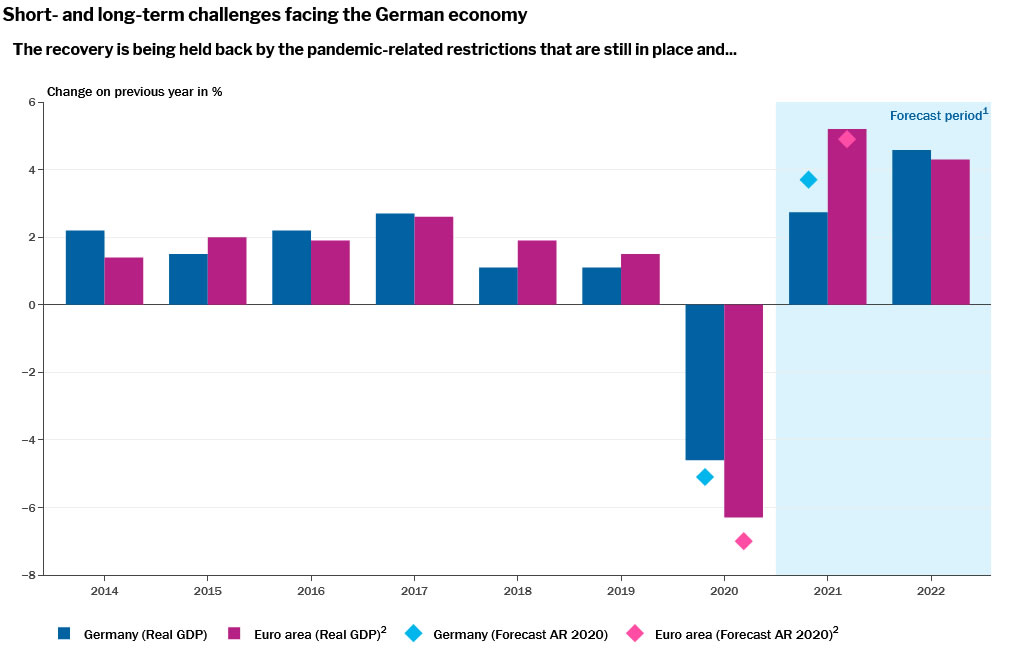
GCEE projects German economy to grow 2.7% this year and 4.6% next
In the latest annual report, the German Council of Economic Experts said, "a variety of bottlenecks on the supply side are disrupting global value chains and, combined with the pandemic-related restrictions that are still in place, are holding back growth."
It forecasts Germany GDP to grow 2.7% in 2021 and 4.6% in 2022. And that subject to "significant risks" including "return of extensive measures to stop the spread of the coronavirus or persistent supply and capacity bottleneck".
The GCEE projections an inflation rate for Germany of 3.1% in 2021 and then 2.6% in 2022. "Longer-lasting supply-side bottlenecks, higher wage settlements, and rising energy prices pose a risk, however, that what are in fact temporary drivers of prices could lead to persistently higher inflation rates," it said.
"Fiscal policy needs to normalise following the crisis. Public finances have to be made more sustainable and crisis-resilient again," says Volker Wieland, member of the GCEE. "The best way for monetary policy to contribute to sustainable economic growth is by maintaining price stability. A normalisation strategy should be published for this purpose."
US Inflation Under The Microscope
- All eyes on US inflation today, dollar’s fortunes hang in the balance
- Stocks pull back after massive rally, bond market in gloomy mood
- Oil prices jump, iron ore slumps, gold rallies but not impressively
Another inflation shock?
The spotlight today will fall on the latest US inflation report, which could unleash turmoil in the markets if there are any meaningful surprises. The annual CPI rate is expected to have soared to 5.8% in October, a pace not seen in three decades.
If anything, the risk might be for a positive surprise considering the signals from various business surveys. Companies raised their selling prices “at the fastest pace on record” during the month according to the Markit PMIs, while both the ISM surveys showed a sharp increase in prices paid by firms for supplies.
As for the dollar, it will likely move in the same direction as any inflation surprise. Whether inflationary pressures are broadening out into different sectors such as rents will also be crucial as investors try to decipher how many times the Fed will push the rate hike button next year.
Markets are pricing in two Fed rate increases for next year, which allows scope for a hawkish repricing towards three if inflation keeps firing up. In contrast, market pricing for rate hikes next year in the UK, Australia, and Eurozone seems too aggressive and allows scope for disappointment. Hence, those currencies may be vulnerable against the dollar, which also offers protection against stock market drawdowns.
Stocks retreat, bonds worry
Wall Street snapped its incredible winning streak yesterday, with a 12% loss in Tesla dragging the overall market down, but only slightly. There’s also a sense of technical exhaustion as momentum indicators were stretched in overbought territory. This market lives off momentum, with options flows running the show lately.
But the real puzzle is the bond market, which is transmitting some alarming signals as inflation-protected Treasury yields have fallen back near record lows. There are multiple ways to read this. Normally it would suggest investors expect slower growth, but in this environment, traders could be piling into these bonds to hedge their inflation exposure.
Either way, the signal is worrisome for the longer-term fortunes of the economy. It suggests low growth potential but high inflation prospects, playing right into the ‘stagflation’ narrative. On the bright side, record low real yields are usually a blessing for assets like growth stocks and gold.
A glance at commodities
Gold should be absolutely thriving with real yields getting blasted, so even though the yellow metal has enjoyed some solid gains lately, the magnitude of the rally has been quite disappointing. The $1835 region has been an impenetrable fortress in recent months, therefore, a powerful breach is required for buying interest to intensify.
Meanwhile, oil prices came back swinging yesterday after the Energy Information Administration reaffirmed its forecasts that the market will swing into a supply surplus next year. This would typically be a negative sign for oil prices, but the market saw it as diminishing the chances that the White House releases the Strategic Petroleum Reserves to counter high prices.
Finally, iron ore prices are in freefall thanks to slowing demand from China and growing inventories. While the Australian dollar has been rather resilient so far, the risks keep accumulating with a tsunami of credit downgrades in China that has sent junk bond yields through the roof and the RBA unlikely to live up to the market’s rate hike expectations.
AUDUSD Crosses Below Its 200-SMA, Bearish Bias Arises
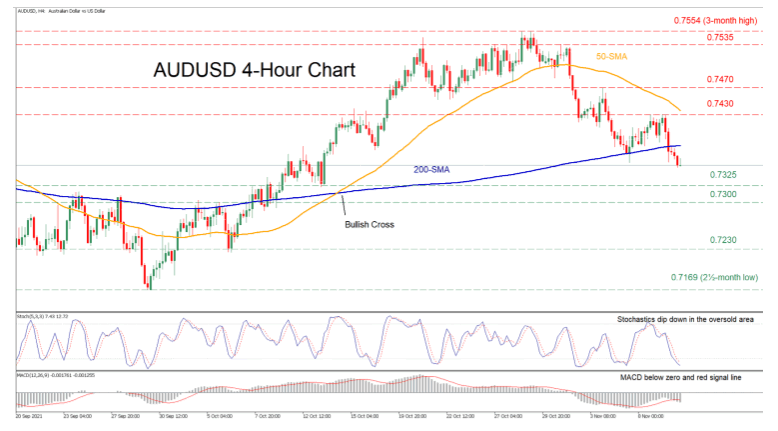
AUDUSD has been trending upwards over the past month after it managed to get strong support at the September low of 0.7169. However, the short-term picture has started to deteriorate as the pair’s rally halted at the 3-month high of 0.7554. Since then, the price has been dipping down, crossing below both its 50- and 200-period simple moving averages (SMAs).
The negative short-term trend is likely to strengthen, as the momentum indicators suggest an imminent bearish bias. Specifically, the stochastic oscillator is pointing down in the oversold area, while the MACD is in negative territory, with the histogram crossing below the red signal line.
Should the selling pressure intensify, the 0.7325 level might act as immediate support. A drop below this level would open the way towards the 0.7300 key psychological region, which has provided both support and resistance several times in the past. If sellers overcome this obstacle, 0.7230 could prove a strong support barrier for the price before the bears target the September low of 0.7169.
Alternatively, if buyers manage to retake control and the price ascents, the first resistance point might be found at the recent high of 0.7430. Overcoming this level, the next hurdle for the pair might be met at 0.7470 or even higher at the 0.7535 region. Clearing these barricades would signify the resumption of the medium-term uptrend, setting the stage for the 3-month high of 0.7554.
Overall, AUDUSD seems to have lost steam in the last few sessions. A break above the 50-SMA would help erase the negative bias, while surpassing the 0.7535 mark would restore the medium-term positive outlook.
China PPI And Property Test Asia Nerves
Asian equity markets are on the back foot today after China’s PPI release printed at a record high of 13.50% YoY for October, with officials blaming weather, material and energy costs. That overshadowed the Inflation data, released at the same time, which came in elevated, but on target at 1.50% YoY for October. The PPI should retreat into the end of the year, thanks to falling iron ore prices, now at one-year lows, and coal prices. Still, Asia is on inflation alert, fearing future costs of inputs from goods sourced from the mainland.
To be sure, some risks remain regarding China itself. Its Covid-zero policy means that if cases in the current outbreak spread, to say port cities, mass closures could result if its previous go-to strategy is anything to go by. That would have a knock-on disruption that would be felt across the globe. The state grid operator has already said electricity supply and demand are finely balanced into the winter months recently, and a colder than usual winter will definitely bring those stresses to the front of investor thinking again. Oil prices continued climbing last night, and despite their success in crushing the coal price rally, natural gas prices have remained robust.
Perhaps the main driver weighing on Asian sentiment today is China’s property sector. Evergrande faces a final deadline today for around USD 148.0 million in offshore coupon payments. It raised a similar amount by selling a stake in another business earlier this week, but whether that cash makes its way offshore is yet to be confirmed. It is not alone though, Fantasia stock returned from suspension today and promptly fell by 50% in Hong Kong. Kaisa faces offshore payments this week, as do other developers. The silence from the Chinese government on how it will manage this situation, exacerbated by the Communist Party Plenum in progress at the moment, continues to be deafening. Fears of defaults and disorderly collapses within the China property sector, and potential financial contagion, continue to stalk Asian investor sentiment.
US PPI within expectations
In the US overnight, PPI and Core PPI rose to 8.60% and 6.60% respectively YoY for October. Eyewatering, but right on market expectations. Combined with some hawkish Fed-speak, it was enough to prompt a modest correction lower in equity markets, after a long winning streak. Notably, the US dollar and US yields ticked lower as well, reinforcing to me, that sentiment and positioning in individual asset classes is what is driving price action in markets now. Given how wed US markets are to the post-taper lower-for-longer-rates story, US core and headline inflation data tonight would need to print well above 5.0% and 6.0% YoY respectively, to cause an inflation stampede for the door.
Elsewhere in Asia, Japan’s Reuters Tankan eased slightly to 13 on fears over rising energy and material costs, etc, while South Korean Unemployment edged slightly higher to 3.20%. That shouldn’t be enough to distract the Bank of Korea from hiking rates into the year-end. Australian Westpac Consumer Confidence climbed to 105.3 for November, reflecting an easing of restrictions in Victoria and New South Wales.
German and Norwegian inflation will show elevated readings but are unlikely to be market-moving. Markets seem to be showing herd immunity to uncomfortable inflation prints, and who can blame them? Central banks continue to fence sit and, in some cases, quantitatively ease into those inflationary environments. As long as they keep saying one thing, only to wimp out or pour petrol on the fire, markets will have little incentive other than to keep the disco inferno of asset price appreciation going. This week is noisy, but unless US Inflation tonight slaps the Federal Reserve with a dead fish hard enough to draw blood, I can’t see much reason for the music to not keep on playing.
USDJPY’s Bullish Structure At Risk As Price Drops To 113 Area
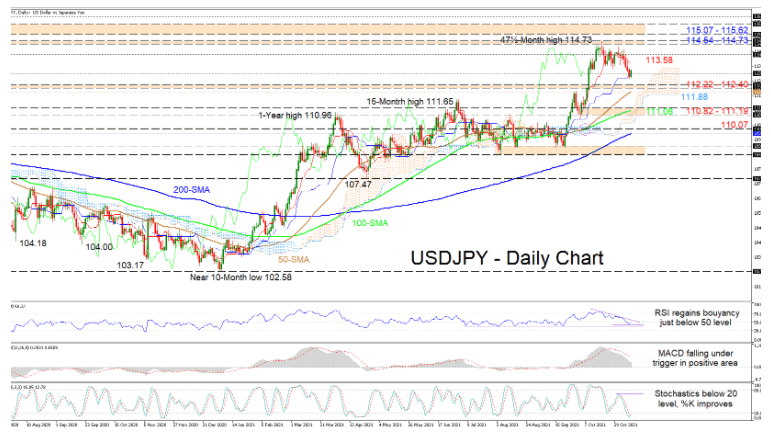
USDJPY's recent retracement from a near 4-year high of 114.73 has snagged in the vicinity of the 113.00 handle and the blue Kijun-sen line, but upside forces remain vulnerable. The lagging simple moving averages (SMAs) are climbing and continue to back advances in the pair despite growing negative pressures - reflected by the pullback in the price.
The Ichimoku lines are indicating some waning in the positive drive but have yet to confirm negative pressures as the frontrunner. Currently, the short-term oscillators are transmitting conflicting messages in directional momentum. The MACD is in the bullish region but continues to plunge beneath its red trigger line, showing that positive forces are declining. The RSI is pointing up and is flirting with the 50 neutral threshold, while the stochastic %K line has overstepped the %D line in the oversold territory, both suggesting that buyers are pushing back.
If buying powers amplify, initial upside friction could commence from the red Tenkan-sen line at 113.58 ahead of the 114.00 hurdle. Should the price continue to improve, the multiple upper wicks in the 114.30-114.40 area could stall the price from challenging the resistance band of 114.54-114.73, a barrier shaped by the rally peaks from October 2018 and November 2017 respectively. Conquering these obstacles may boost buyers' confidence to tackle the nearby barricade of 115.07-115.62, which was formed by the highs over the first quarter of 2017.
Otherwise, if sellers resurface and steer the price below the 113.00 mark, the 112.22-112.40 barrier could prove to be the first downside obstacle along with the Ichimoku cloud. Lurking slightly beneath is the 50-day SMA at 112.04 and the cloud's lower band at 111.88. If a deeper retreat in the pair evolves past these barriers, the price could then encounter its next support in the 110.82-111.19 zone, where the 100-day SMA also resides. Persistent selling in the pair may then turn trader's attention to the 110.07 boundary and the 200-day SMA at 109.85.
Summarizing, USDJPY is sustaining a bullish tone above the 112.22-112.40 barrier, the cloud and the SMAs. That said, for the positive structure to start to become seriously compromised, the price would need to dip below the 110.82 low.
Dow Jones Retreats As Focus Shifts To US Inflation Data
US stocks declined sharply on Tuesday as investors waited for the upcoming consumer inflation data. The Dow Jones declined by more than 200 points while the S&P 500 and Nasdaq 100 indices declined by more than 0.50%. Economists expect the data to show that the country’s inflation surged to a 30-year high of 5.8%. This increase is due to rising energy prices and the fact that many companies have been forced to hike wages. Also, the ongoing logjam in global logistics has led to parts shortages, which has led to higher prices. Still, the Federal Reserve expects that consumer prices will moderate in the coming year.
Tesla shares continued dropping on Tuesday as investors reacted to news that Elon Musk will sell shares. In a weekend poll, the company’s CEO ran a poll on whether he should sell a 10% stake in the company. The poll attracted more than 3 million voters, most of which recommended that he should sell them. If he does, it means that he will sell shares worth about $20 billion. It was also revealed that his brother sold a stake in the company before he ran the poll. Another top mover on Tuesday as General Electric. The company said that it will break itself into three publicly traded companies. The three will deal with healthcare, aviation, and energy. Coinbase shares also declined in extended hours after the company published its earnings.
The economic calendar will have limited events today. In addition to the American inflation, the market will watch out for the upcoming German inflation data. Analysts expect that the country’s inflation data rose by about 4.5% in October. This will be the highest figure in years. Another key data will be the latest US inventories numbers. The data is expected to show that oil inventories jumped by more than 2.12 million barrels last week. These numbers come at a time when oil prices are close to a multi-year high.
XAUUSD
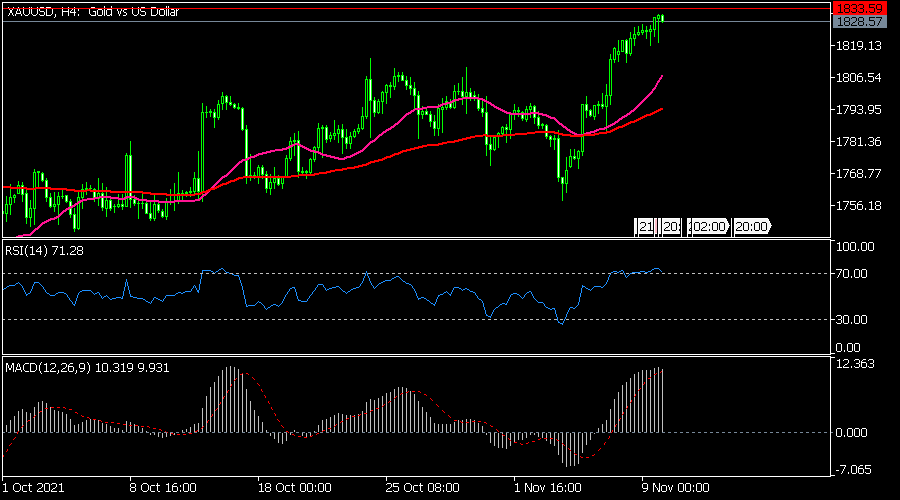
The XAUUSD pair jumped to a multi-month high of 1,830 ahead of the US inflation data. The pair has managed to rise from a low of 1,720 in September this year. It is also attempting to move above the important resistance at 1,833. The pair is also slightly above the 25-day and 50-day moving averages while the RSI has moved to the overbought level. Therefore, the pair will likely keep rising as bulls target the key resistance at 1,900.
EURUSD
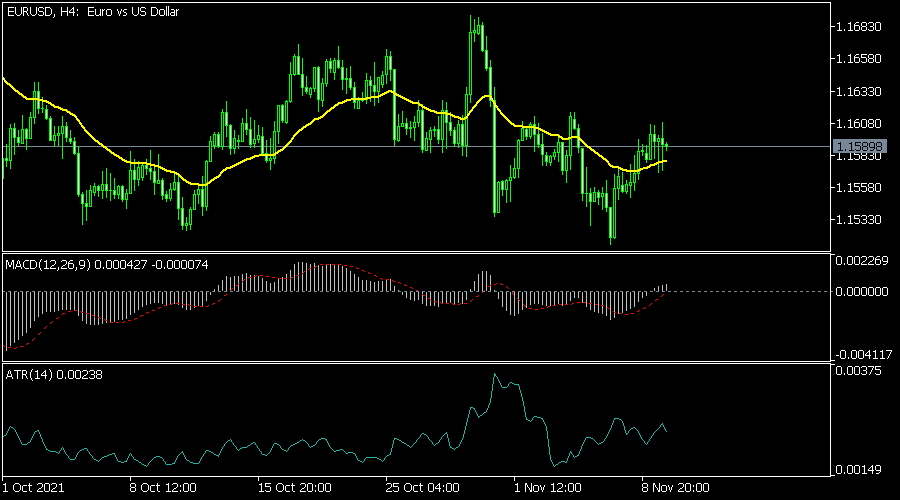
The EURUSD pair was in a tight range as investors waited for upcoming US inflation data. It is trading at 1.1587, where it has been in the past few days. The pair has also formed a small head and shoulders pattern. It is also along the middle line of the Bollinger Bands. The MACD and the Average True Range have been relatively unchanged. Therefore, the outlook of the pair is neutral ahead.
USDJPY
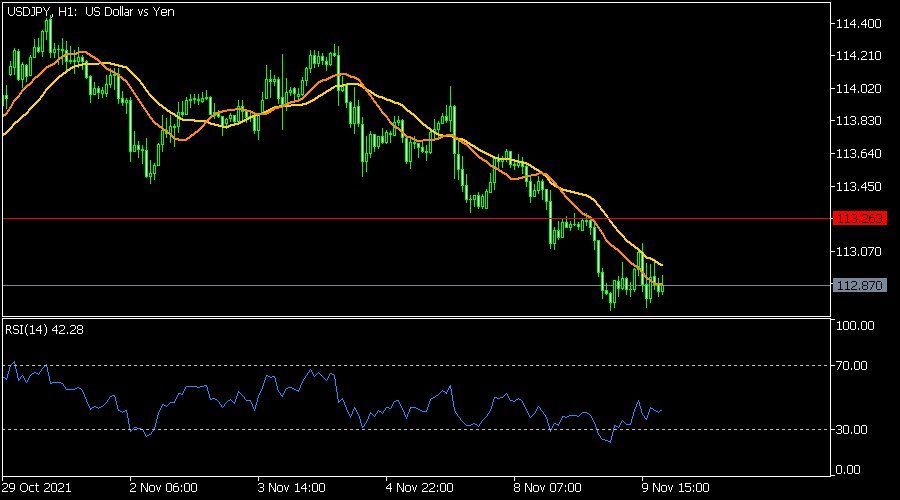
The USDJPY pair has been under intense pressure in the past few days. The pair is trading at 112.88, which is slightly above this month’s low of 112.73. On the four-hour chart, the pair has moved below the envelopes indicator. It has also moved below the key support level at 113.26 while the Relative Strength Index (RSI) has moved from the oversold level. Therefore, the pair will likely remain in this range for a while.
The Analytical Overview Of The Main Currency Pairs
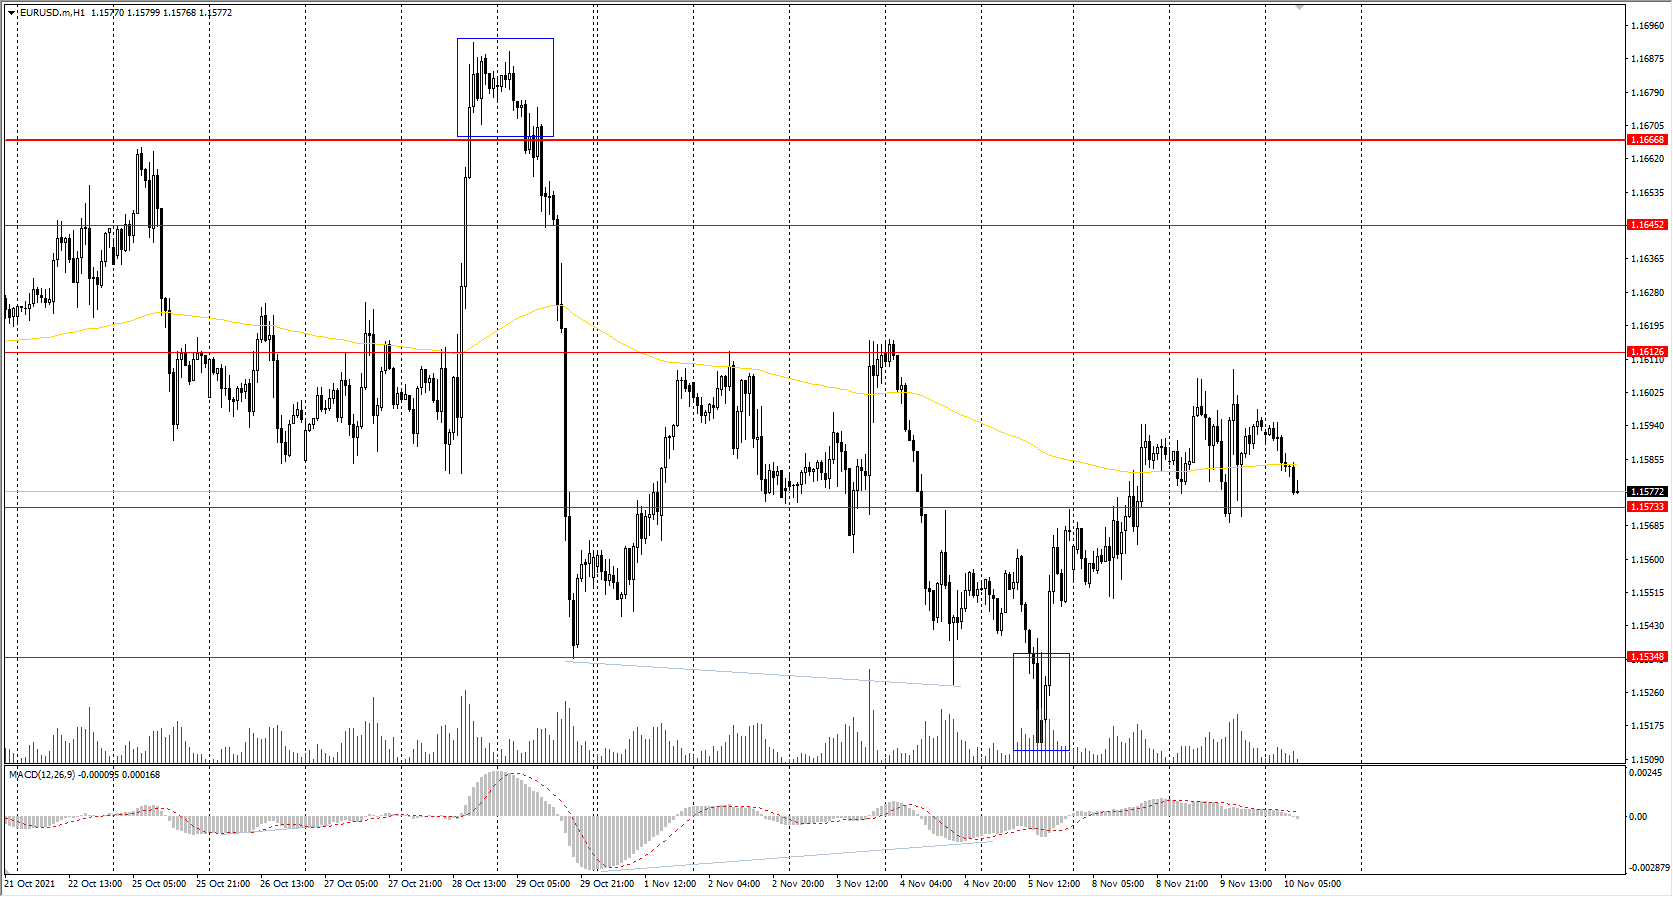
The EUR/USD currency pair
Technical indicators of the currency pair:
Prev Open: 1.1585
Prev Close: 1.1594
% chg. over the last day: +0.08%
The ECB balance continues to grow rapidly. Total assets increased by another €16.6 billion to a new level of €8,382.7 billion. The ECB will continue to print money as part of its stimulus program until the end of the year. The index of economic sentiment in Germany and the Eurozone is rising again. Experts forecast the resumption of economic growth and lower inflation in both Germany and the eurozone in the first quarter of 2022.
Trading recommendations
Support levels: 1.1573, 1.1535, 1.1502, 1.1453
Resistance levels: 1.1613, 1.1645, 1.1667, 1.1717, 1.1772
From the technical point of view, the EUR/USD on the hour time frame is bearish. The MACD indicator has become inactive. Under such market conditions, traders should consider sell positions from the resistance levels near the moving average. There is no optimal entry point for buy trades at the moment.
Alternative scenario: if the price breaks out through the 1.1667 resistance level and fixes above, the mid-term uptrend will likely resume.
News feed for 2021.11.10:
- German Consumer Price Index (m/m) at 09:00 (GMT+2);
- US Consumer Price Index (m/m) at 15:30 (GMT+2);
- US Initial Jobless Claims (w/w) at 15:30 (GMT+2).
The GBP/USD currency pair
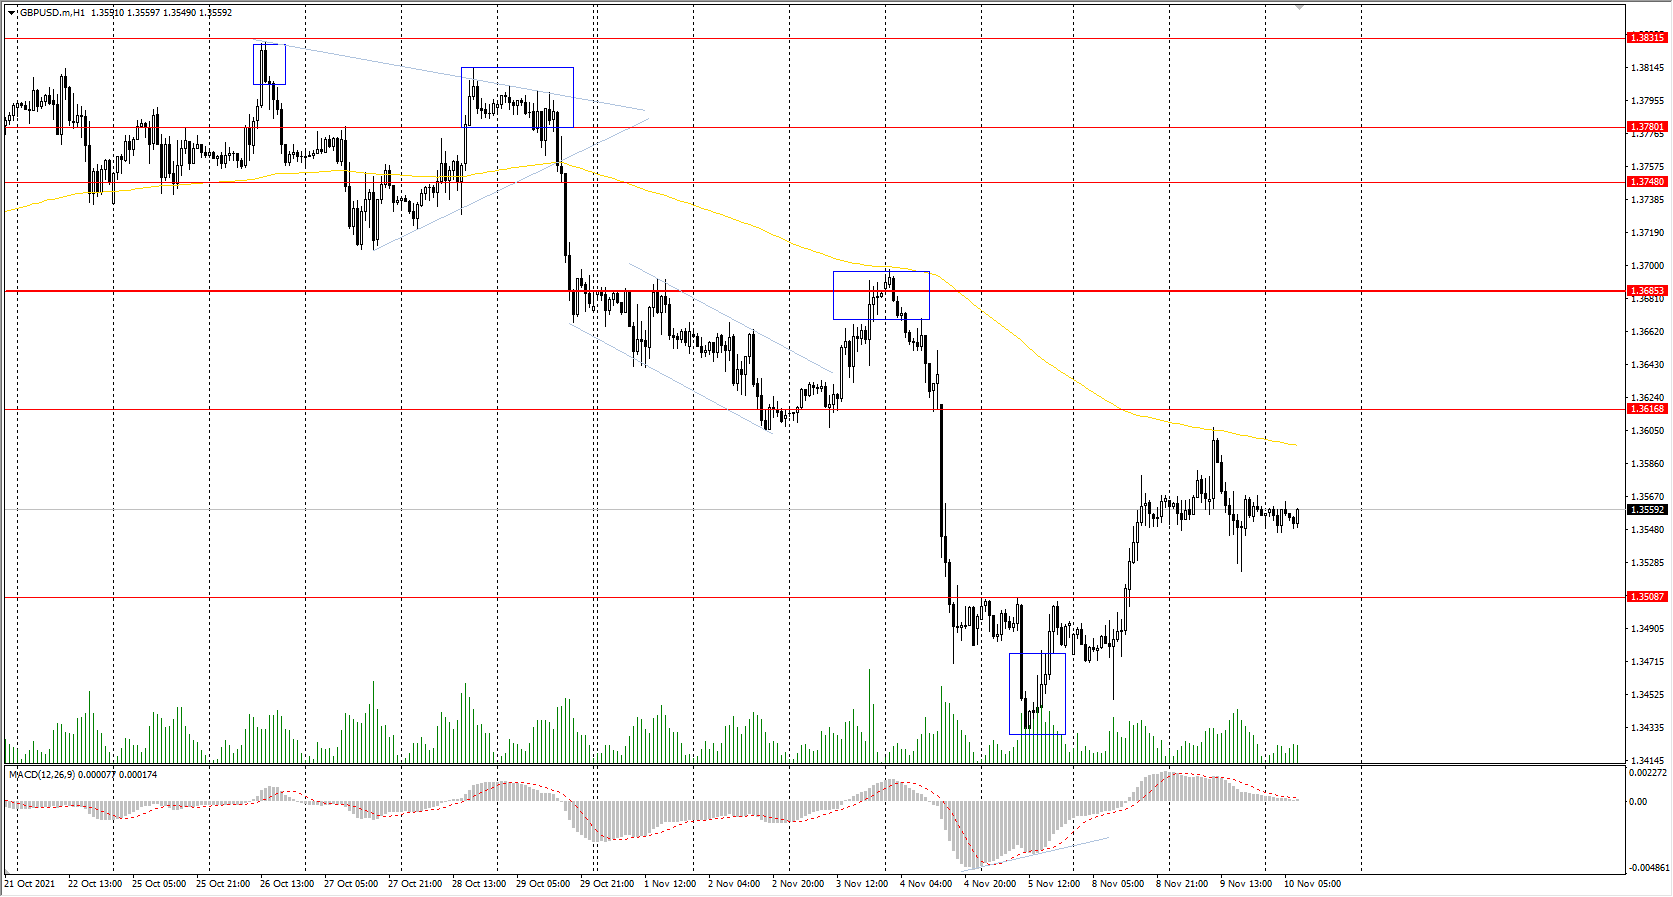
Technical indicators of the currency pair:
Prev Open: 1.3561
Prev Close: 1.3556
% chg. over the last day: -0.04%
According to the Institute for Economic and Social Research (NIESR), the UK consumer price index will peak at around 5% in Q2 2022. UK GDP will grow by 4.7% in 2022 and 6.9% in 2021.
Trading recommendations
Support levels: 1.3508, 1.3360
Resistance levels: 1.3616, 1.3685, 1.3748, 1.3780, 1.3831, 1.3886
On the hourly time frame, the trend on GBP/USD is bearish. The MACD indicator has become inactive. It is best to look for sell deals from the resistance levels around the moving average. There is no optimal entry point for buy trades at the moment.
Alternative scenario: if the price breaks out through the 1.3685 resistance level and consolidates above, the bullish scenario will likely resume.
News feed for 2021.11.10:
- US Consumer Price Index (m/m) at 15:30 (GMT+2).
The USD/JPY currency pair
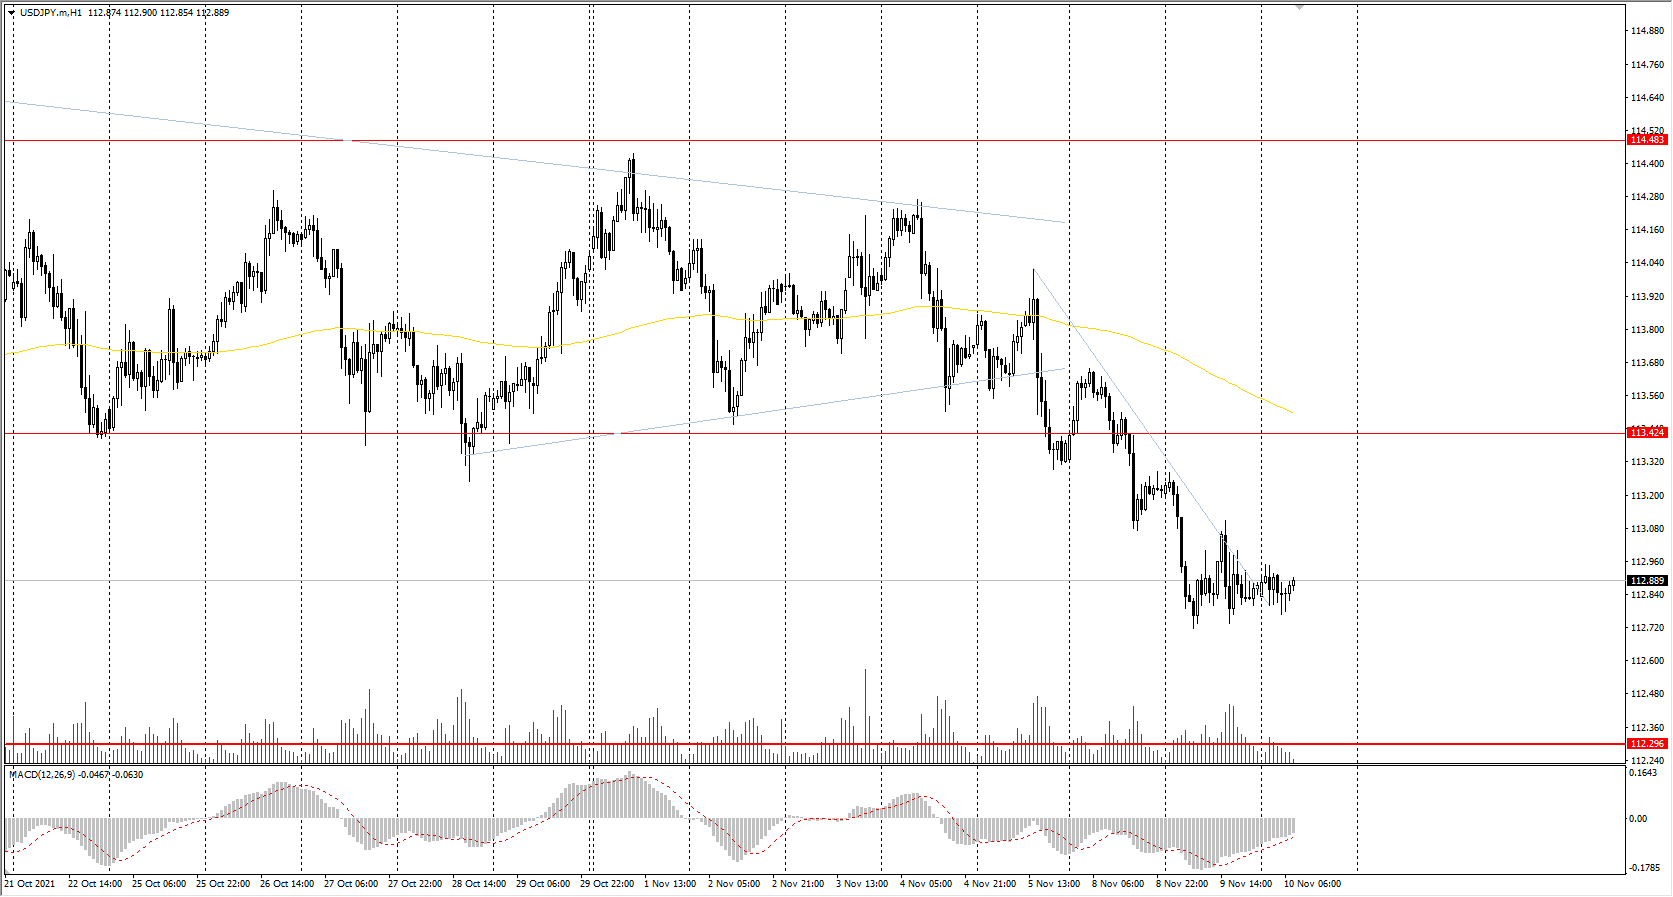
Technical indicators of the currency pair:
Prev Open: 113.21
Prev Close: 112.87
% chg. over the last day: -0.30%
At the moment there are no fundamental reasons for the USDJPY quotes to go down in the mid-term, as the Bank of Japan has kept its monetary policy soft until the end of the year, while the Fed is already cutting QE. Moreover, if the US consumer price index is high today, it will lead to a rise in the dollar index and USDJPY quotes.
Trading recommendations
Support levels: 112.30, 111.53, 110.99, 110.65
Resistance levels: 113.42, 114.48, 115.15
The global trend on the USD/JPY currency pair is bullish. But the local trend is strictly bearish at the moment. Under such market conditions, it’s better to look for buy positions from the buyers' initiative zone on the higher timeframes. Sell positions should be considered from the resistance levels, given there is sellers' initiative.
Alternative scenario: if the price falls below 112.30, the uptrend will likely be broken.
News feed for 2021.11.10:
- US Consumer Price Index (m/m) at 15:30 (GMT+2).
The USD/CAD currency pair
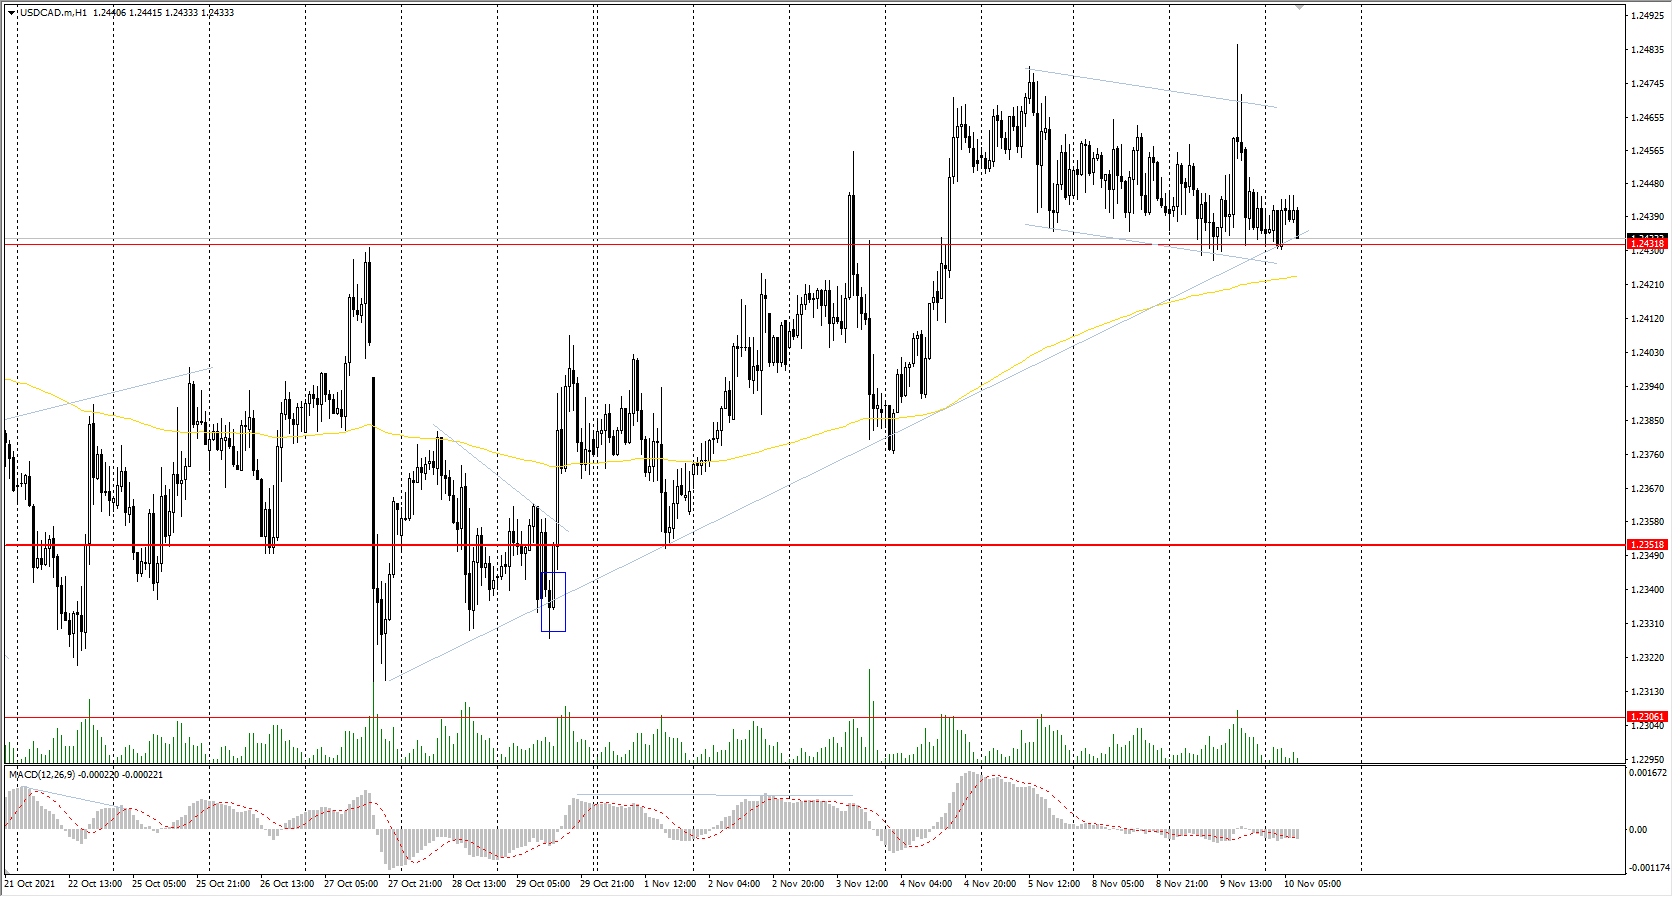
Technical indicators of the currency pair:
Prev Open: 1.2441
Prev Close: 1.2436
% chg. over the last day: -0.04%
The Canadian dollar is a commodity currency, so the USD/CAD currency pair highly depend on the dynamics of the dollar index and oil prices. Both the dollar index and oil prices increased yesterday. As a result, the USD/CAD currency pair is trading flat. Fundamentally, the Canadian dollar is tending to strengthen now as oil prices are rising and the Canadian central bank has begun to cut its stimulus program. On the other hand, a rise in the dollar index may eliminate these factors.
Trading recommendations
Support levels: 1.2428, 1.2352, 1.2306, 1.2260
Resistance levels: 1.2518, 1.2565, 1.2628, 1.2729, 1.2774
From the technical point of view, the USD/CAD currency trend has changed to bullish. The price broke through the priority change level and consolidated above. The MACD indicator has become inactive, and there are no signs of reversal. Under such market conditions, it is better to look for buy trades from the support levels, given there is the buyers' initiative. Sell deals should be considered from the resistance levels of the higher time frame.
Alternative scenario: if the price breaks down through the 1.2351 support level and fixes below, the downtrend will likely resume.
News feed for 2021.11.10:
- Canada BoC Gov Macklem’s Speech at 00:45 (GMT+2);
- US Consumer Price Index (m/m) at 15:30 (GMT+2);
- US Crude Oil Reserves (w/w) at 17:30 (GMT+2).
USD Stabilises Ahead Of CPI Release
The USD seems to have stabilised somewhat against a number of its counterparts yesterday, ahead of the release of the US CPI rates for October later today in the American session. Should the rates accelerate as forecasted we may see the headline rate reaching an over 20 year high as the rate has not seen such levels on a year-on-year level since the end of 1990, which in turn could increase the pressure on the Fed to tighten its monetary policy faster. Supply shortages in conjunction with an acceleration of the US wage growth rates for October tend to tilt the risks related to the release to the upside, while slowing consumption for September could moderate them. Also, we get from the US the weekly initial jobless claims figure which could provide some support for the USD if it drops further, while the two releases are to be simultaneous and could magnify the effect on the greenback under certain conditions.
The USD Index seems to have stabilised yesterday just below the 94.10 (R1) resistance line. As the index’s price action has broken the downward trendline guiding it we switch our bearish outlook in favour of a bias for a sideways movement. The RSI indicator below our 4-hour chart seems to remain near but below the reading of 50, which may imply a rather indecisive market. Should the bulls manage to take over and complete the reversal we may see the index breaking the 94.10 (R1) resistance line and aim for the 94.60 (R2) level that was tested on the 5th of November. Should the bears regain the momentum, we may see the index breaking the 93.70 (S1) support line and aim for the 93.20 (S2) support level.
AUD traders keep an eye out for October’s employment data
The Aussie lost considerable ground against the USD yesterday and during today’s Asian session, breaking an upward movement of the past two days and the sentiment seems to be quite bearish. We highlight the release of Australia’s employment data for October during Thursday’s Asian session, as the main release of the week for Aussie traders which could create considerable volatility for AUD pairs. Despite some tightening of the Australian employment market given the projected rise of the employment change figure, the expected rise of the unemployment rate may intensify the bearish appetite for the Aussie as the Australian employment market despite improving somewhat, seems to remain loose, which in turn could allow RBA to maintain its dovishness. It should be noted that the bank had pushed back against any idea of an earlier hiking of its interest rates in its latest meeting.
AUD/USD has been dropping since yesterday and is now testing the 0.7365 (S1) support line. We see the case for the downward movement to continue and a downward trendline to be formed. Please note that the RSI indicator below our 4-hour chart is near the reading of 30 underscoring the strength of the bearish sentiment. On the other hand the price action seems to be teasing the lower Bollinger band which may imply that a correction higher could be in the cards for the pair. Should the market continue to display a selling interest for AUD/USD we may see it breaking the 0.7365 (S1) line and aim if not break also for the 0.7310 (S2) support level. Should buyers take over we may see the pair reversing course and take aim for the 0.7420 (R1) resistance line and if broken the way would be paved for the 0.7475 (R2) resistance hurdle.
Today’s events and expectations
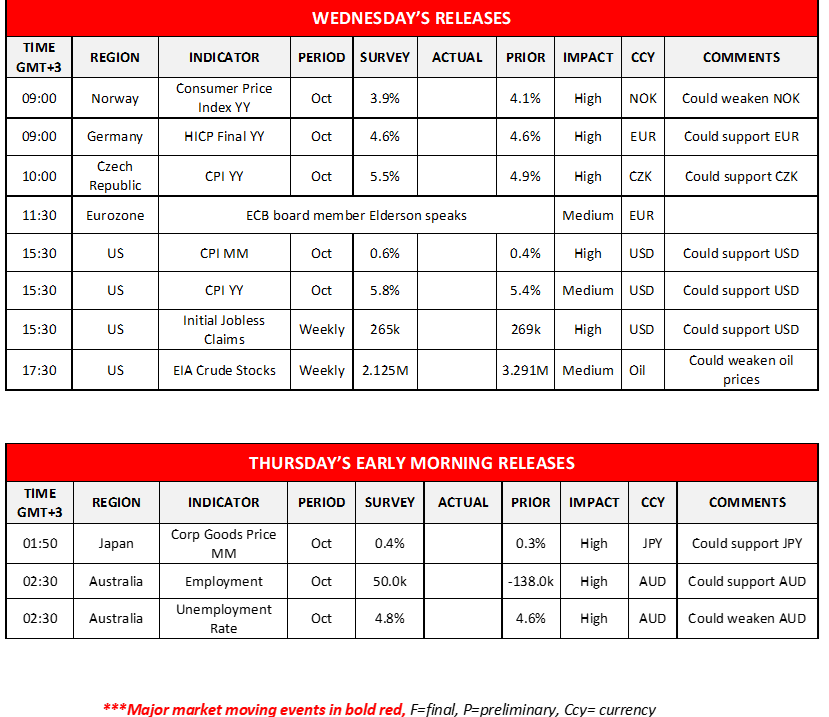
Today in the European session we get from Norway the Consumer Price Index, from Germany the final HICP rate and from the Czech Republic the CPI rates, all being for the month of October. On the monetary front please note that ECB board member Elderson speaks. In the American session, we get from the US, the CPI rates for October, the weekly initial jobless claims figure and the weekly EIA crude oil inventories figure. During Thursday’s Asian session we note the release of Japan’s corporate goods prices growth rate for October and Australia’s employment data for the same month.
USD Index H4 Chart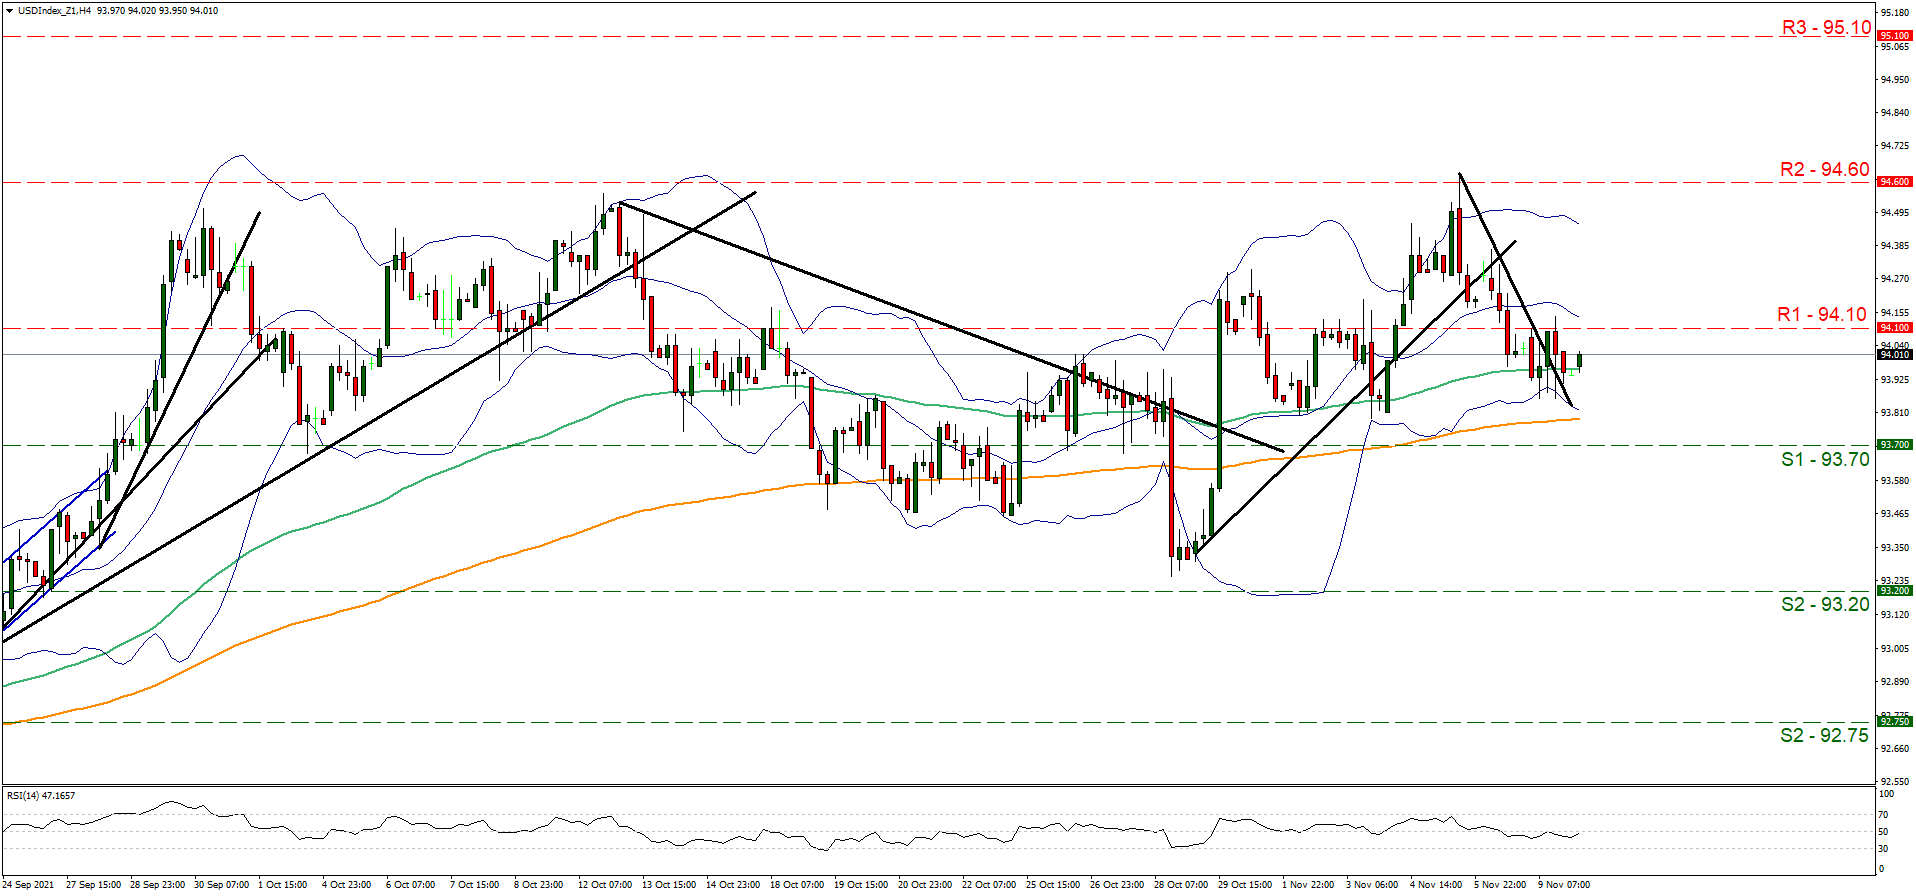
Support: 93.70 (S1), 93.20 (S2), 92.75 (S3)
Resistance: 94.10 (R1), 94.60 (R2), 95.10 (R3)
AUD/USD H4 Chart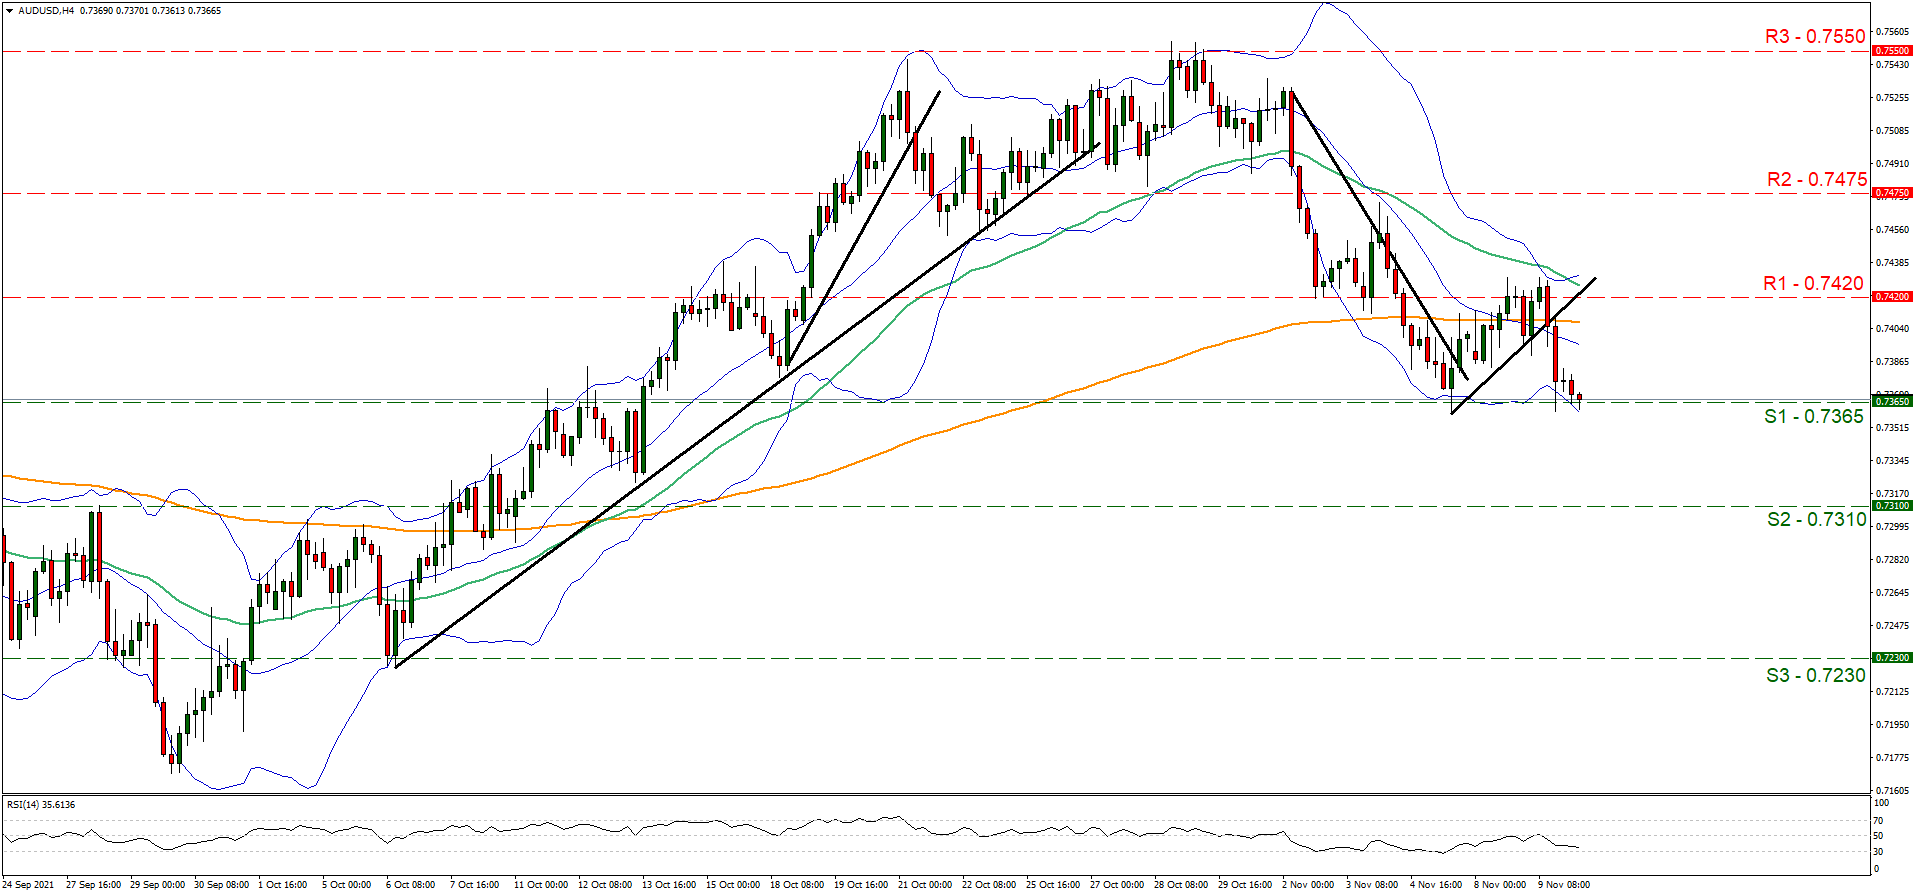
Support: 0.7365 (S1), 0.7310 (S2), 0.7230 (S3)
Resistance: 0.7420 (R1), 0.7475 (R2), 0.7550 (R3)
Daily Technical Analysis
EUR/USD
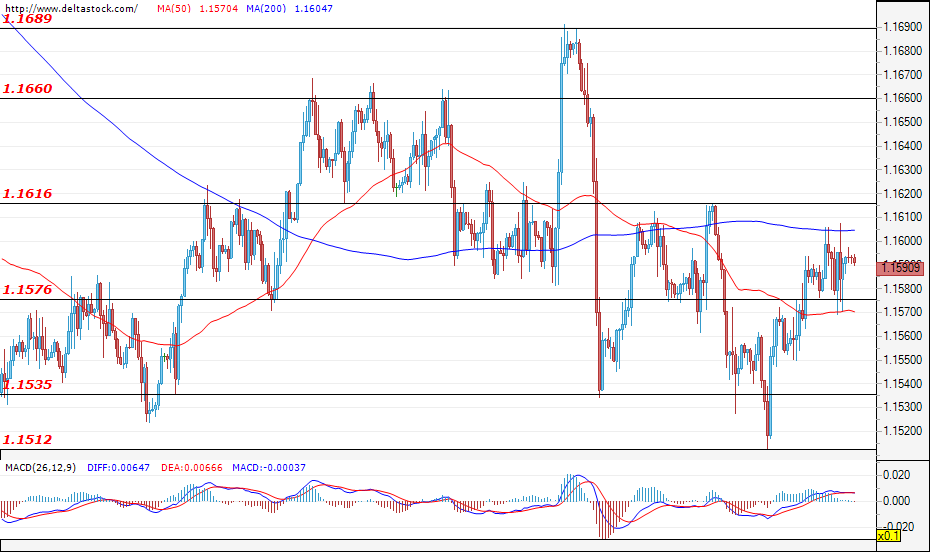
Current level - 1.1590
The bulls still cannot gain enough momentum to breach the resistance zone of 1.1616 and, during the early trading hours of today’s session, the pair is trading just below the mentioned level. The expectations for today’s trading session are for the long-term depreciation of the single European currency against the U.S. dollar to continue and for the pair to head towards a test of the support of 1.1535. A spike in volatility is likely during the announcement of the economic data for the initial jobless claims for the U.S. (today; 13:30 EST).
| Resistance | Support | ||
| intraday | intraweek | intraday | intraweek |
| 1.1616 | 1.1690 | 1.1576 | 1.1510 |
| 1.1660 | 1.1760 | 1.1535 | 1.1410 |
USD/JPY
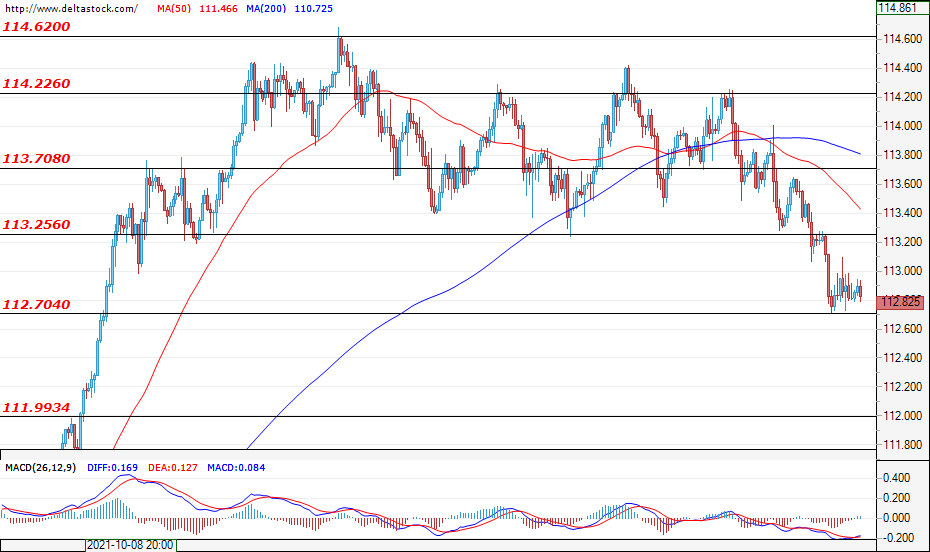
Current level - 112.82
After the successful breach of the support of 113.25, the downward movement was limited by the support zone of 112.70. A breach of the mentioned level would pave the way for the pair towards the next level of 112.00. However, a consolidation in the range of 112.70 - 113.25 is still not off the table. In case the bulls enter the market and successfully violate the resistance level of 113.25, then an upward movement towards the resistance of 113.70 may be expected.
| Resistance | Support | ||
| intraday | intraweek | intraday | intraweek |
| 113.25 | 114.20 | 112.70 | 111.50 |
| 113.70 | 114.60 | 112.00 | 111.00 |
GBP/USD
Current level - 1.3554
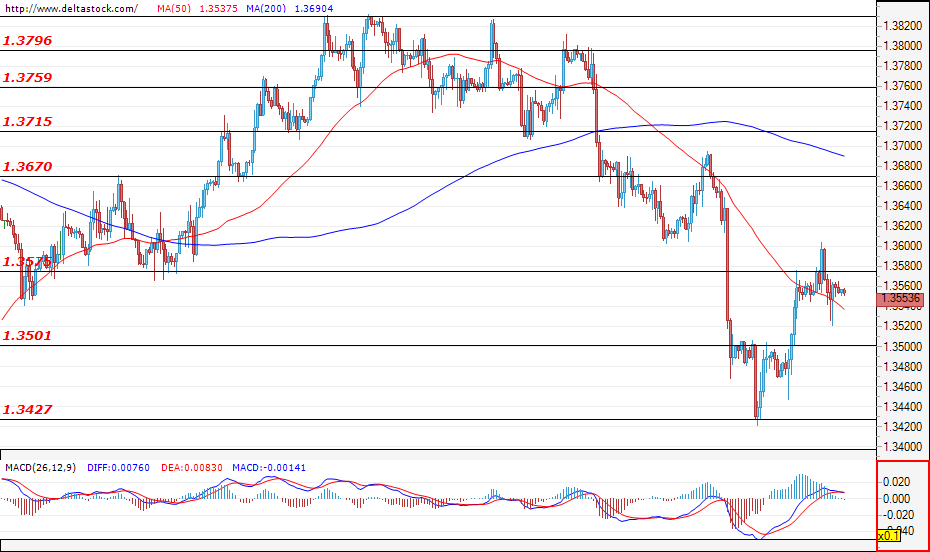
The bulls entered the market and the sterling recovered some of its recent losses against the dollar. The currency pair breached the resistance zone of 1.3500, but the upward movement was limited by the resistance of 1.3575. The market sentiment remains negative and the pair would most probably head towards a test of support level of 1.3427.
| Resistance | Support | ||
| intraday | intraweek | intraday | intraweek |
| 1.3575 | 1.3715 | 1.3500 | 1.3427 |
| 1.3670 | 1.3760 | 1.3427 | 1.3350 |