Sample Category Title
Elliott Wave View: Dollar Index (DXY) Continues To Be Supported
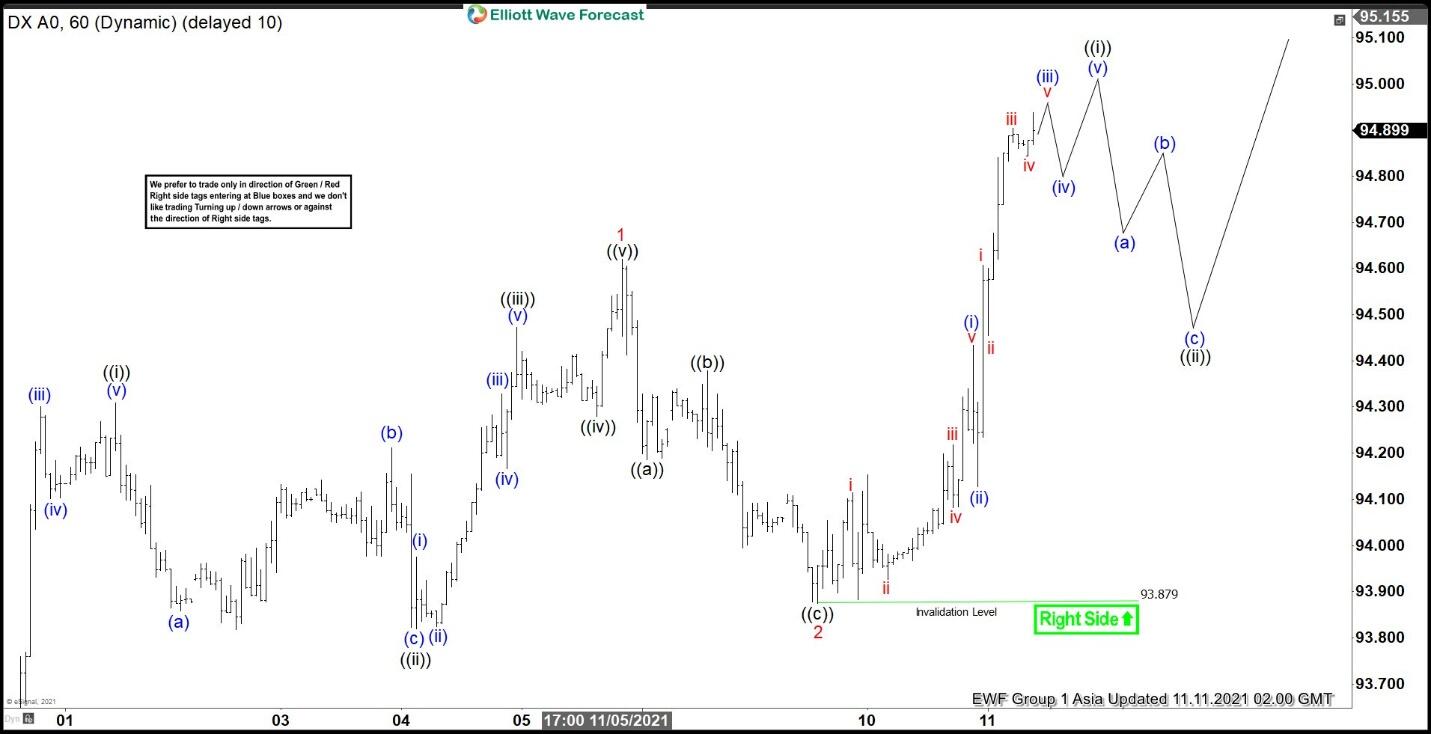
Short Term Elliott Wave view on Dollar Index (DXY) suggests the rally from October 28, 2021 low is unfolding as a 5 waves impulse. Up from October 28 low, wave ((i)) ended at 94.3 and dips in wave ((ii)) ended at 93.82. The Index rallies higher in wave ((iii)) towards 94.47, pullback in wave ((iv)) ended at 94.28, and final leg wave ((v)) ended at 94.62. This completed wave 1 in higher degree. Pullback in wave 2 has ended at 93.88 . Internal subdivision of wave 2 unfolded as a zigzag structure. Down from wave 1, wave ((a)) ended at 94.18, wave ((b)) ended at 94.38, and wave ((c)) ended at 93.88.
The Index has extended higher in wave 3 with internal subdivision of another 5 waves in lesser degree. Up from wave 2, wave (i) ended at 94.43, and pullback in wave (ii) ended at 94.12. Short term, expect two more highs to end wave (iii) and (v) before the Index ends wave ((i)) of 3. The index should then pullback in wave ((ii)) of 3 to correct cycle from November 9, 2021 low before the next leg higher. As far as pivot at 93.88 low stays intact, expect dips to find support in 3, 7, or 11 swing for further upside.
Dollar Index 60 Minutes Elliott Wave Chart
Market Morning Briefing: EURJPY Is Holding Above Support At 130.50
STOCKS
Some correction seen in equity indices after the US CPI release yesterday. Dow has dipped breaking below our mentioned supports at 36250/36000 and if the fall sustains, we may expect a further decline towards 35000. Dax has support at 16000 which if breaks can drag it down to 15900. Nikkei trades below support at 29500 and if it falls to break below 29000, it can test 28500 on the downside soon. Shanghai on the other hand has bounced from 3450 and can rise to 3550-3575. Nifty and Sensex trade above supports at 17800 and 60000 but it would be prudent to consider a break and fall towards 17600/400 and 59000 respectively.
Dow (36079.94, -240.04, -0.66%) has broken below 36250 mentioned yesterday and could have chances of a fall to 35000 as 36000 breaks. Our earlier mentioned rise to 36500 and 37000 is negated while Dow remains below 36250-36000. Immediate view is bearish below 36250/36000.
DAX (16067.83, +27.36, +0.17%) has dipped slightly today and seems to be holding below 16100 for now. While below 16100 we may expect a decline towards 15900 and a range of 15900-16100 to hold for the next few sessions. Broadly, 15900 is an important support that could hold in the medium term and produce a bounce to 16400 eventually.
Nikkei (29325.75, +217, +0.75%) has failed to rise above 29500 contrary to our expectation. A further decline below 29000 will take it down to 28500 before bouncing from there.
Shanghai (3511.64, +19.18, +0.55%) has risen, sharply bouncing from 3450. A rise to 3550-3575 looks possible in the near term. Any break below 3450, if seen again would be bearish in the medium term. .
Nifty (18017.20, -27.05, -0.15%) has crucial Support at 17800. It would be prudent to consider chances of break which would then target 17600-400. Watch price action near 17800.
Sensex (60352.82, -80.63, -0.13%) too has crucial support at 60000 which if breaks could target 59000 on the downside. Watch price action closely near 60000.
COMMODITIES
Strong US CPI data release yesterday has pulled up Gold, Silver and Copper while it has lead to a sharp decline in Crude prices. But we need to see if the movement sustains or whether it is a data-based short lived move that may correct itself soon.
Brent (82.77) has surprised by falling back below 85 instead of rising towards $87.50 as mentioned yesterday. The overnight low of $82.08 is a crucial Support on the Daily Candles. Need to see if it triggers a rise past $85 to $90. Else, while below $85, there could be chance of break below $82 targeting $80. Very delicate juncture.
WTI (81.49) has also surprised by falling from levels below 85 instead of rising towards resistance at 86. There is scope for a fall towards 82-81 if the current dip continues. Keep a close watch to see if the current fall sustains.
Gold (1845.80) saw a sharp rise yesterday breaking above our mentioned resistance at 1840. This possibly breaks the downtrend since 2100 (aug’20) mentioned yesterday. We need to see if Gold falls back to levels below 1840 or sustains the rise to head higher in the near term. Movement from 1840 levels on either side will bow be crucial to watch as it would decide the next directional course.
Silver (24.65) too has risen from levels seen yesterday. There is immediate resistance near 24.65/70-25 which needs to hold in order for the price to fall back to 24-23.50. Else a sustained rise above 24.65/70-25.00 will be needed to turn further bullish on the price.
Copper (4.3480) is stuck below 4.45 which is holding as an interim resistance for the last few sessions. Unless a break above 4.45 is seen, it would be difficult for Copper to move up further and instead the price can fall towards 4.20/25 soon. Watch price action near current levels.
FOREX
Dollar Index has risen sharply after the strong US CPI data release pulling down Euro to levels below. Our bearish view on Euro has been holding well as we now look for a further fall towards support at 1.14. Dollar-Yen can rise towards 115.50 while above 114. Aussie and Pound are bearish for a fall towards 0.7250/40 and 1.33 respectively. USDCNY can rise to 6.42/43 on a break above 6.41. USDINR can see a decent rise towards 74.40/50/60 on the upside before falling from there. Immediate resistance is seen at 74.60.
Dollar Index (94.93) has risen well and has resistance at 95 and then higher at. Dollar Yen has risen sharply and could rise towards
Euro (1.1483) has fallen as expected and is trading below 1.1493, the 50% retracement of the rise from 1.0636 (Apr-20) to 1.2349 (Jan-21). Medium term Support is seen at 1.14.
EURJPY (130.87) is holding above support at 130.50. We may expect trade within 131.50-130.50 to hold for the near term.
Aussie (0.73087) looks bearish for a fall to 0.7250-0.7240 which is a near term trend support.
Pound (1.3404) needs to bounce from support at 1.34 else a fall towards 1.33 cannot be negated in the coming sessions.
Dollar-Yen (114.06) has proved the break below 113 as very short lived and surged yesterday proving our bearishness towards 112.5-112 as wrong. While above 114, we may look for a rise to 115.50 on the upside.
USDCNY (6.4050) can rise to 6.42/43 if immediate Resistance at 6.41 breaks.
USDINR (74.39) is expected to see a near-term pull-back to 74.20-40-50. Might test 74.50/60 also. A broad range of 73.50-74.50 for the coming sessions hold with a sell-on rallies environment.
INTEREST RATES
The US Treasury yields have surged across tenors after the strong inflation data release yesterday. The US Headline CPI rose sharply by 6.24% (YoY) in October after rising 5.38% in the previous month. While this bounce sustains, the Treasury yields can move up further towards the upper end of our expected range in the coming days. The German Yields have bounced back as expected and can see a corrective rise in the coming days before resuming the broader downtrend again. The 10Yr and 5Yr GoI have risen back sharply yesterday and can move up further if they manage to sustain the bounce in the coming sessions.
The US 2Yr (0.51%), 5Yr (1.22%), 10Yr (1.55%) and 30Yr (1.90%) have risen sharply across tenors. The 10Yr has risen back above 1.5% and while this sustains a rise to the upper end of our expected range of 1.35%-1.65% is possible in the coming days. The 30Yr can now test 2% while this bounce sustains and can even extend the rise to 2.1% on a break above 2%. Broadly it is likely to remain in the range of 1.75%-2.1%/2.2%.
The German 2Yr (-0.71%), 5Yr (-0.54%), 10Yr (-0.25%) and the 30Yr (0.05%) have risen back as expected. The 10Yr has bounced from -0.3% and could rise to -0.2%/-0.1% from here itself without seeing an extended fall to -0.4%. The 30Yr is heading up towards 0.1% in line with our expectation. The yields are likely to resume their broader downtrend after this corrective rise.
The India 10Yr GoI (6.3363%) has risen back above 6.3% contrary to our expectation to extend the fall to 6.2%. While above 6.3% a test of 6.36%-6.37% is possible in the near-term. Inability to breach 6.37% can drag the yield below 6.3% and will keep the chances alive of seeing 6.2% on the downside.
The 5Yr GoI (5.6928%) has held above 5.66% and has risen back well. A further rise past 5.70% can take the yield up to 5.74%-5.75%. The price action at 5.7% will need a close watch.
USD/CAD Could Start Fresh Increase To 1.2600
Key Highlights
- USD/CAD is attempting an upside break above the 1.2500 resistance region.
- Earlier, it traded below a major bullish trend line at 1.2450 on the 4-hours chart.EUR/USD failed to clear the 1.1600-1.1620 resistance zone, and GBP/USD also topped near 1.3600.
- The US CPI increased 6.2% in Oct 2021 (YoY), better than the last 5.4%.
USD/CAD Technical Analysis
The US Dollar started a decent increase above 1.2450 against the Canadian Dollar. However, USD/CAD failed to clear the 1.2500 resistance zone.
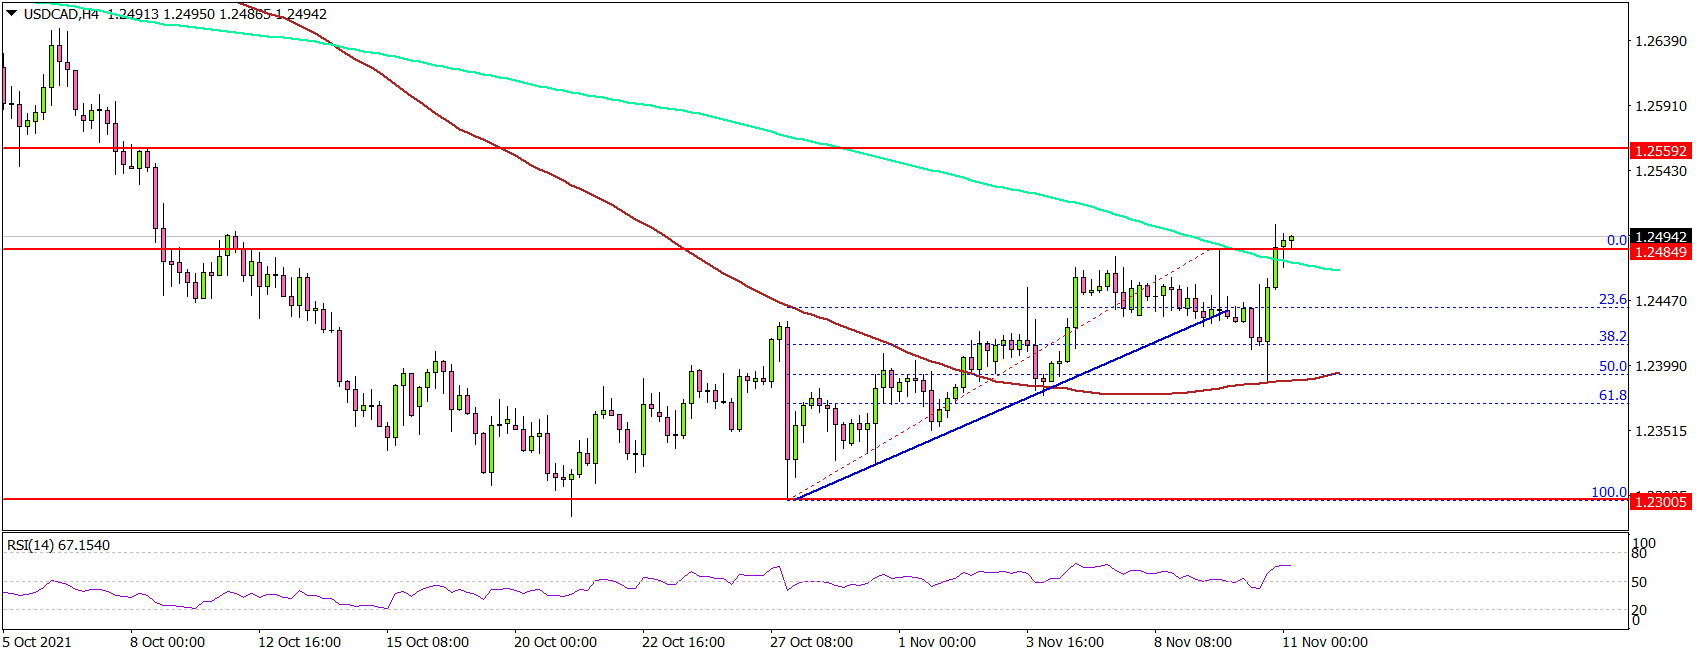
Looking at the 4-hours chart, the pair topped near the 1.2490 level and the 200 simple moving average (green, 4-hours). It started a fresh decline and traded below 1.2450.
There was a break below a major bullish trend line with support at 1.2450 on the same chart. Besides, the pair declined below the 23.6% Fib retracement level of the upward move from the 1.2301 swing low to 1.2484 high.
An immediate support is near the 1.2400 level. It is near the 50% Fib retracement level of the upward move from the 1.2301 swing low to 1.2484 high.
A close below 1.2400 could open the doors for a move towards the 1.2320 level. The next major support is near the 1.2300 level. On the upside, an immediate resistance is near the 1.2490 level.
The next major resistance is near the 1.2500 level. A close above 1.2490 and 1.2500 could open the doors for a fresh increase. In the stated case, the pair could rise towards the 1.2620 level.
Fundamentally, the US Consumer Price Index for Oct 2021 was released yesterday by the US Bureau of Labor Statistics. The market was looking for a rise of 5.8% in Oct 2021, compared with the same month a year ago.
The actual result was better than the forecast, as the US CPI increased 6.2%. Besides, the Consumer Price Index (CPI) Ex Food & Energy increased 4.6%.
Looking at EUR/USD, the pair failed to clear the 1.1600 hurdle and it remains at a risk of a downside break. Similarly, GBP/USD failed to surpass 1.3600.
Economic Releases
- UK Industrial Production for Sep 2021 (MoM) - Forecast +0.2%, versus +0.8% previous.
- UK Manufacturing Production for Sep 2021 (MoM) - Forecast +0.2%, versus +0.5% previous.
- UK GDP for Q3 2021 (QoQ) (Prelim) - Forecast +1.5%, versus +5.5% previous.
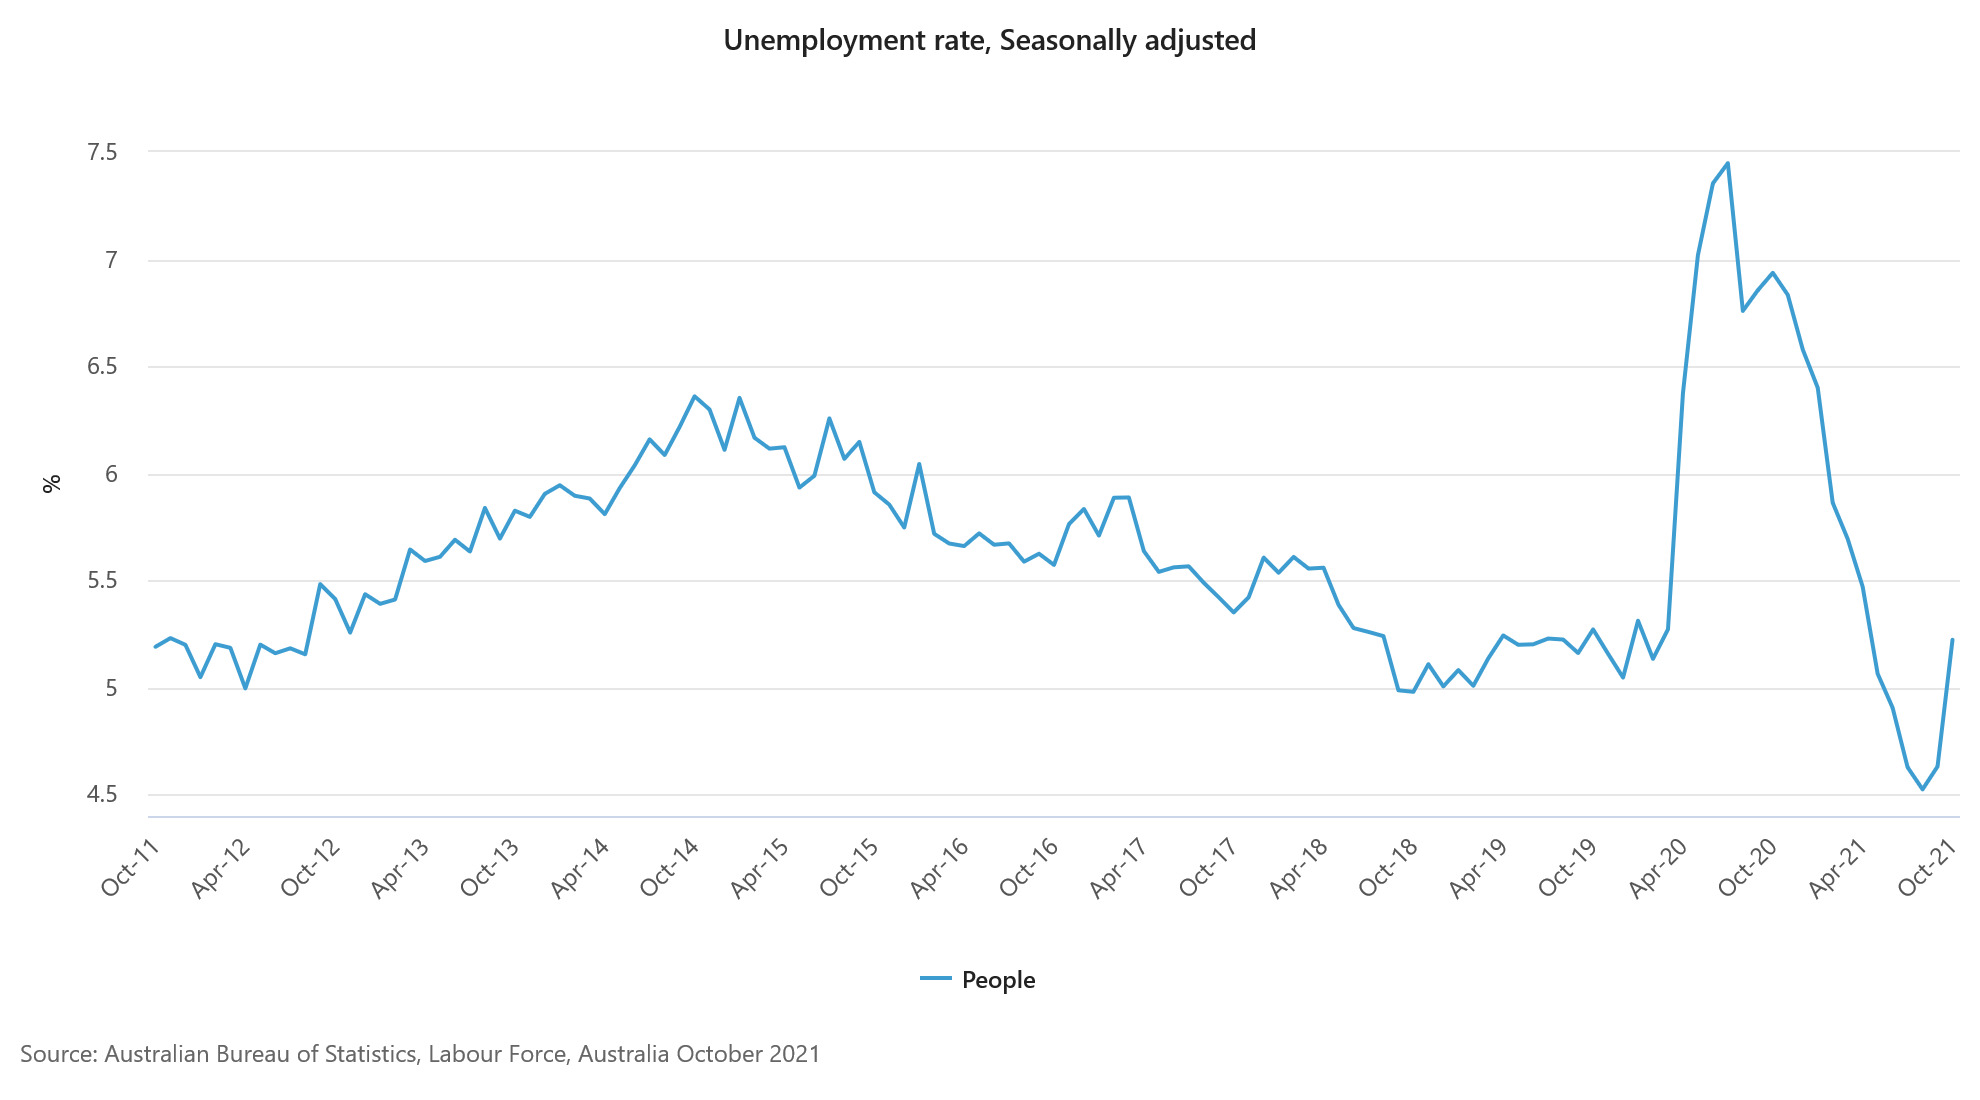
Australia employment dropped -46.3k, unemployment rate jumped to 5.2%
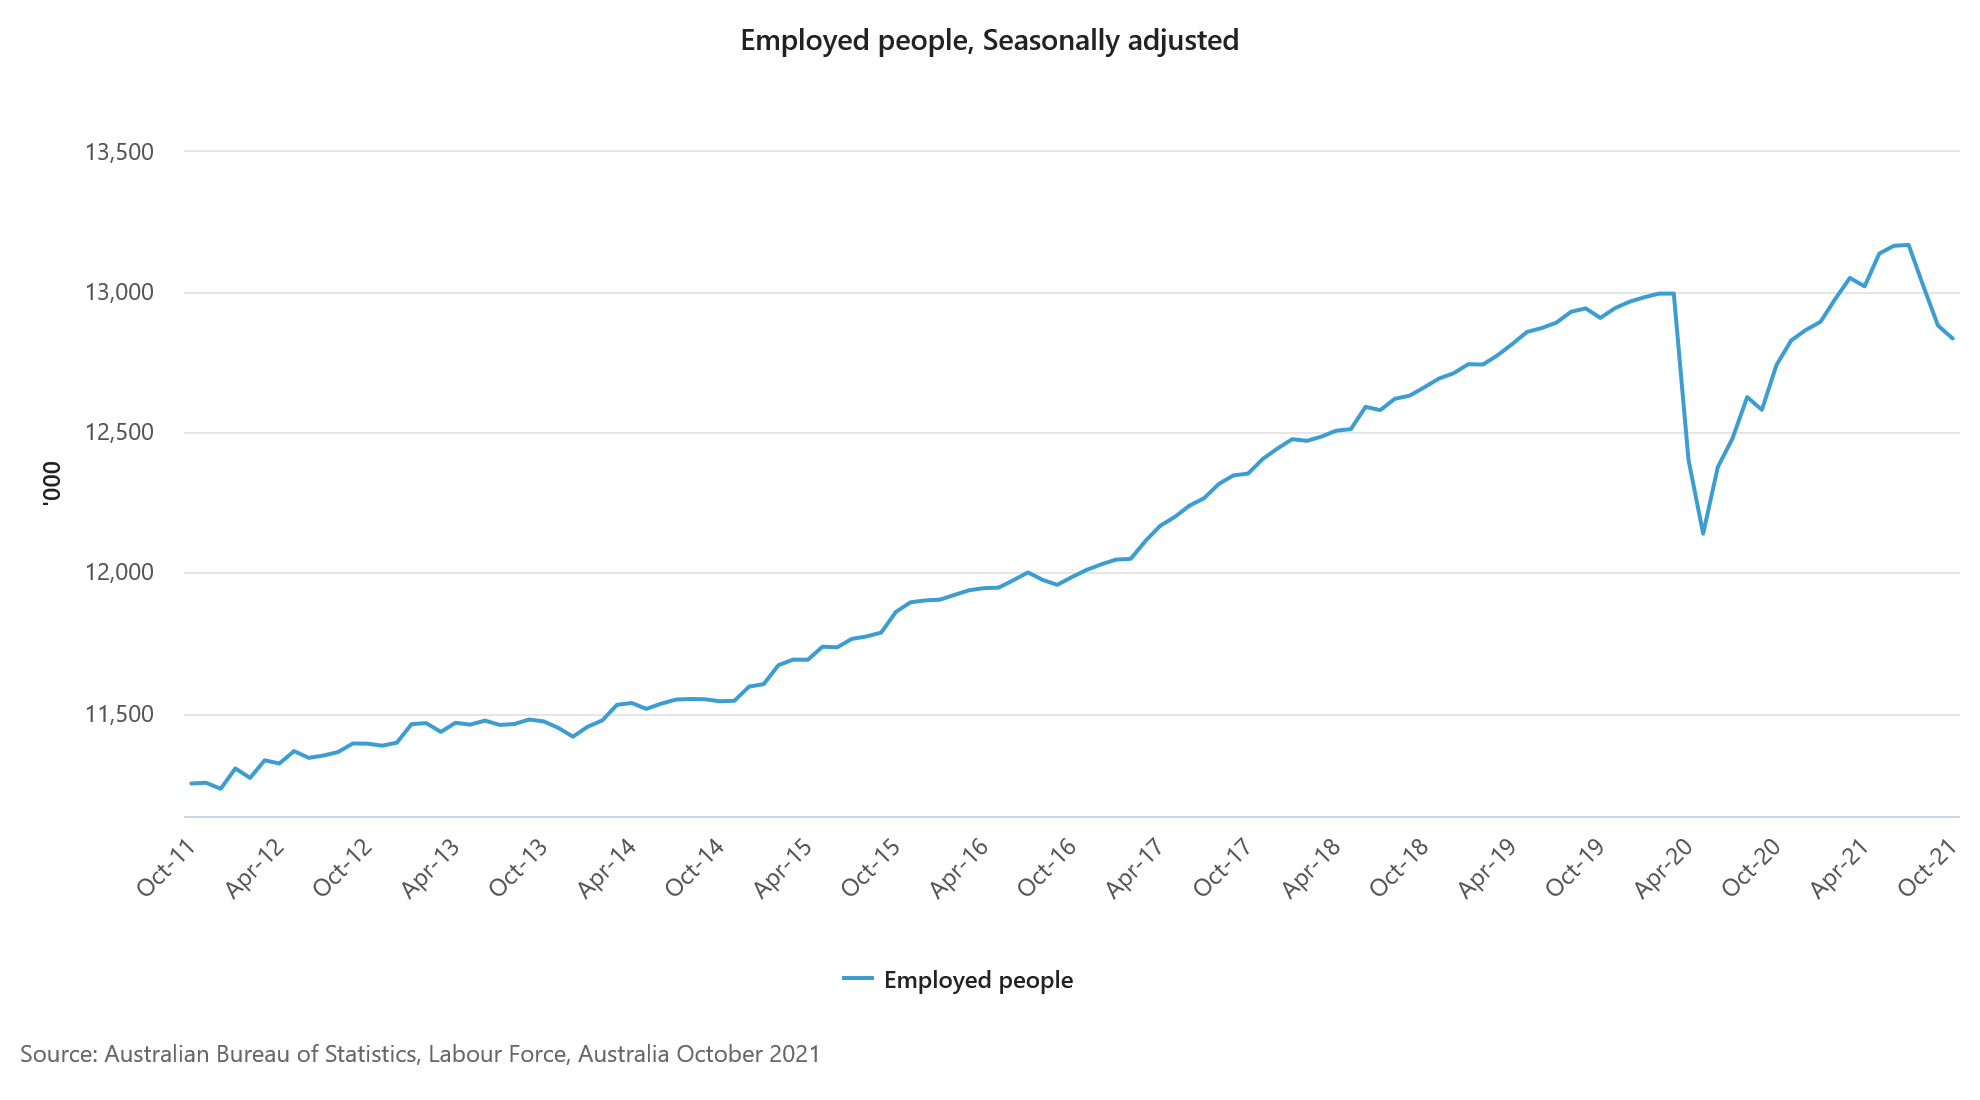
Australia employment decreased -46.3k in October, much worse than expectation of 50k rise. At 12.84m, employment level was back below pre-pandemic peak. Full time jobs dropped -40.4k while part-time jobs dropped -5.9k.
Unemployment rate jumped sharply from 4.6% to 5.2%, well above expectation of 4.7%. But participation rate also rose slightly from 64.5% to 64.7%. Monthly hours worked dropped -1m hours.
Bjorn Jarvis, head of labour statistics at the ABS: "The increases in unemployment show that people were preparing to get back to work, and increasingly available and actively looking for work – particularly in New South Wales, Victoria and the Australian Capital Territory. This follows what we have seen towards the end of other major lockdowns, including the one in Victoria late last year."
"It may seem counterintuitive for unemployment to rise as conditions are about to improve. However, this shows how unusual lockdowns are, compared with other economic shocks, in how they limit being able to work and look for work."
Japan PPI surged to 8% yoy in Oct, highest since 1981
Japan corporate goods price index rose 8.0% yoy in October, up from September's 6.4% yoy, well above expectation of 6.9% yoy. That's also the highest level since January 1981.
Looking at some details, lumber & wood surged 57.0% yoy. Petroleum and cola rose 44.5% yoy. Iron and steel rose 21.8%. Nonferrous metals rose 31.4% yoy. Export price rose 13.7% yoy while import price rose 38.0% yoy.
Eco Data 11/11/21
[php_everywhere instance="1"]
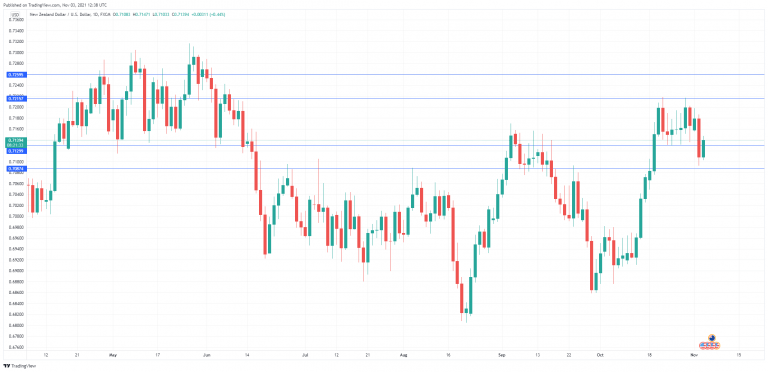
New Zealand Dollar Dips to 71
The New Zealand dollar has extended its losses for a second successive day. NZD/USD is currently trading at 0.7109, down 0.31% on the day.
New Zealand business confidence slides
The news was grim from the New Zealand Business Confidence index, which fell for a fourth consecutive month. The drop in November was significant, as the index fell to -18.5, down from 13.1 a month earlier. The survey noted that costs for businesses have gone “through the roof”, with some 89% of firms reporting higher costs.
Later in the day, New Zealand releases the Food Price Index for October. This is an important gauge of inflation, as the official CPI release is only once a quarter.
In the US, inflation remains red-hot. On Tuesday, PPI surged 8.6% y/y, its highest annual pace since records began 10 years ago. This was followed today by the October CPI numbers, which were higher than expected. Headline CPI rose 4.6% y/y, compared to 4.0% in September. Core CPI hit 6.2%, up from 5.4% in September. The rise in prices has sent US Treasury yields slightly higher and could climb further, depending on the success of the US Treasuries auction later in the day.
These high numbers do not lend support to the Fed’s argument that inflation is transitory, but the important question is will the markets continue to buy into Jerome Powell’s message that the Fed does not plan to raise interest rates in the near future. However, cracks are forming in the Fed’s stance, with Fed member James Bullard saying on Tuesday that he expects two rate hikes in 2022. The Fed will begin trimming its asset purchases at the end of the month, and today’s inflation data will increase pressure on the Fed to raise rates sooner rather than later.
NZD/USD Technical
- NZD/USD faces resistance at 0.7215 and 0.7259
- 0.7129 is a weak support line. Below, there is support at 0.7087
Sunset Market Commentary
Markets
Question: what is red hot and not temporary? - *Gaze* I don’t kn… - False. US inflation. Fact: prices rose at the fastest pace since the 90s in October. With 6.2% y/y (0.9% m/m, up from 5.4% in September) it crushes another psychological barrier at 6% and easily surpasses the 5.9% consensus. Energy obviously had an important part in last month’s price increases, sprinting 4.8% m/m higher as fuel oil soared 12.3% as well as gas service (6.6%).However, with core inflation also quickening from 4% to 4.6%, a new cycle high and the fastest in three decades, inflation has much deeper roots. Prices for used cars and trucks added another strong 2.5% m/m. The cost of shelter, a major component of (core) inflation, rose with 0.5% m/m, a well-above average number. This indicates inflation is broadening beyond categories that are associated with the economic reopening – an often used but flawed explanation for current strong upward price pressures. The US data came after yesterday’s strong PPI reading of 8.6% and stronger-than-expected similar data in China this morning. While European/US markets remained relatively stoic then, the story is much more different now. The US yield curve bear flattens with yields jumping as much as 6.8 bps at the short end. The 2y-yield erases the post-BoE decline as US money markets ramp up bets on Fed rate hikes (two discounted by the end of next year). It is set for a finish near or above the previous cycle high close. Yields increase 5 bps in the 10y tenor with surging inflation expectations compensating for a 4 bp decline in real yields (10y real rate new historical low). This may be markets expecting the Fed to pursue a short-lived tightening cycle that won’t suffice to kill off inflation durably before turning back to growth. It also helps explain the impressive jump in gold prices, whose appeal as an inflation hedge dominates over the opportunity cost as a non-interest bearing asset. The very long end of the US curve outperforms (+2 bps 30y) but we’re keen to see whether this will hold should tonight’s 30y auction disappoint as well – not an unlikely scenario after such a US inflation print. German yields join their US peers with a tad of reluctance. The curve slightly flattens with the belly (+1 bp) outperforming wings (+2.6 bps in 2y and 2.8 bps in 30y). The US dollar strengthened in a knee-jerk move to EUR/USD 1.154 before paring some of the gains to 1.157 (down from 1.159). The increased short-term rate support hangs in the balance with the continued decline in long real yields. USD/JPY reverses a four-day losing streak, bouncing from below 113 to 113.43. Sterling holds steady near EUR/GBP 0.855 as it awaits crucial talks between the EU and the UK on Friday. UK’s Frost struck a more conciliatory language, saying it won’t give up on talks with the bloc. However, given what’s at stake (ie the whole Brexit deal), it makes sense for sterling investors not to frontrun on any of such comments.
News Headlines
Czech inflation accelerated in October, rising by 1% M/M and 5.8% Y/Y (from 4.9% vs 5.5% expected). The yearly number is the highest since October 2008 and obviously way above the CNB’s 2% inflation target. Prices went up in nearly all baskets on a monthly basis with food being the only exception. The main driver of the Y/Y-number was price growth of housing and fuels. Imputed rentals (owner occupied housing costs) rose by 12.8% Y/Y. Yearly price rises in total goods and services amounted to 5.4% and 6.6% respectively. The Czech krone tested the recent highs (EUR/CZK 25.20 area) reached in the wake of last week’s unexpected 125 bps CNB rate hike. A break didn’t occur even as the CZK swap curves shows a further inversion. Yields rise by 14.4 bps for the 2y to 6.5 bps for the 10y.
Germany’s council of economic advisers published a report today calling on the ECB to communicate a normalization strategy soon. The four-member group warns for upside risks to the inflation outlook for coming years. In combination with public finances’ growing dependence on low interest rates, this could lead to dilemma’s at the central bank. They add that history suggests that the economic price is high is you act too late or half-hearted against spiraling price pressures. One of their proposals for detailing the exit is the introduction of individual governors’ expectations with regard to the policy rate, in line with the Fed’s dot plot.
Gold upside breakout after strong US CPI, targeting 1909 next
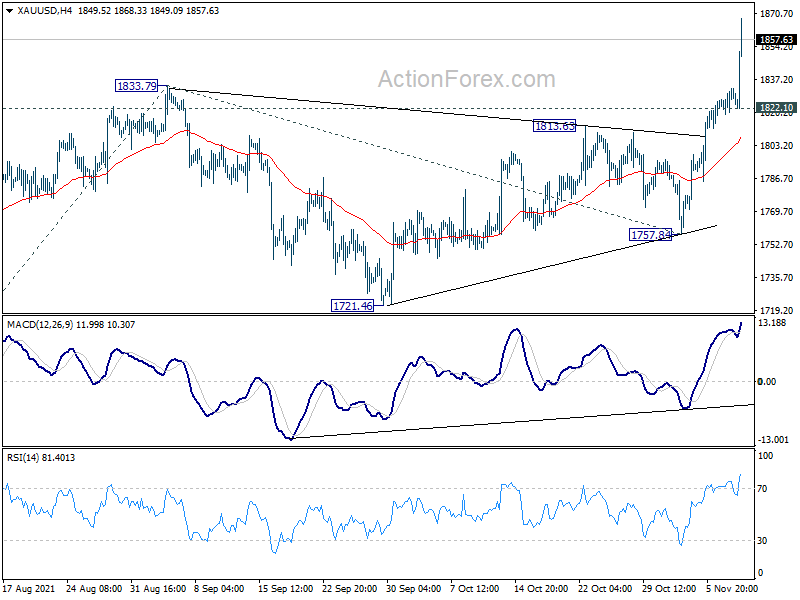
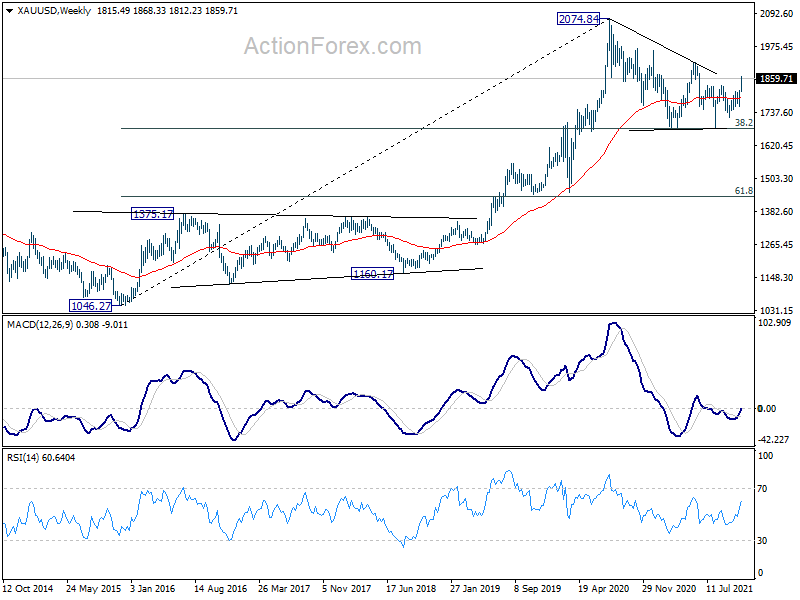
Gold surges sharply after stronger than expected US CPI data, and finally breaks 1833.79 resistance decisively. The development now affirms the case that corrective pattern from 2074.84 has already finished. Near term outlook will now stays bullish as long as 1822.10 support holds. Next target is 100% projection of 1682.60 to 1833.79 from 1757.84 at 1909.03, which is close to next key resistance level at 1916.30.
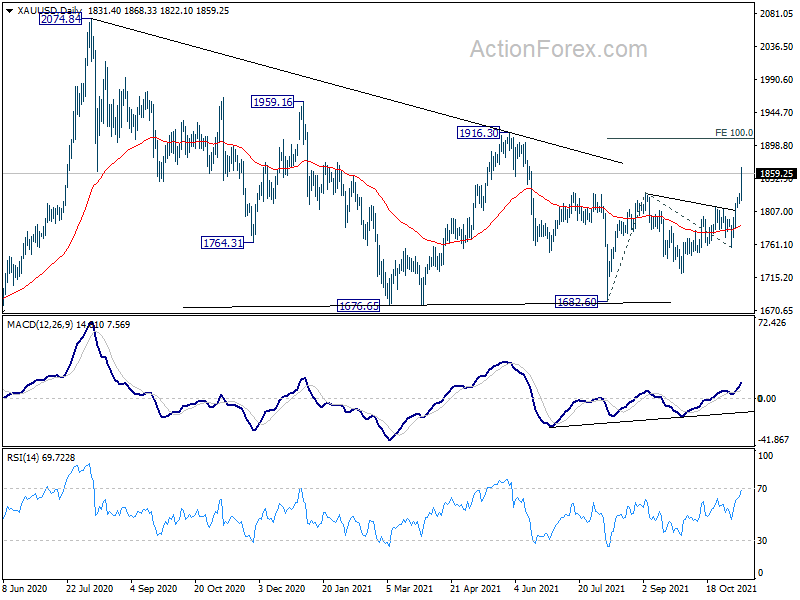
Long term outlook is gold remains bullish with 38.2% retracement of 1046.27 to 2074.84 at 1681.92 well defended. Sustained break of 1916.30 would be a signal that gold is ready to resume the long term up trend.
EURJPY Selloff Could Have More Legs; Neutral in Medium-Term
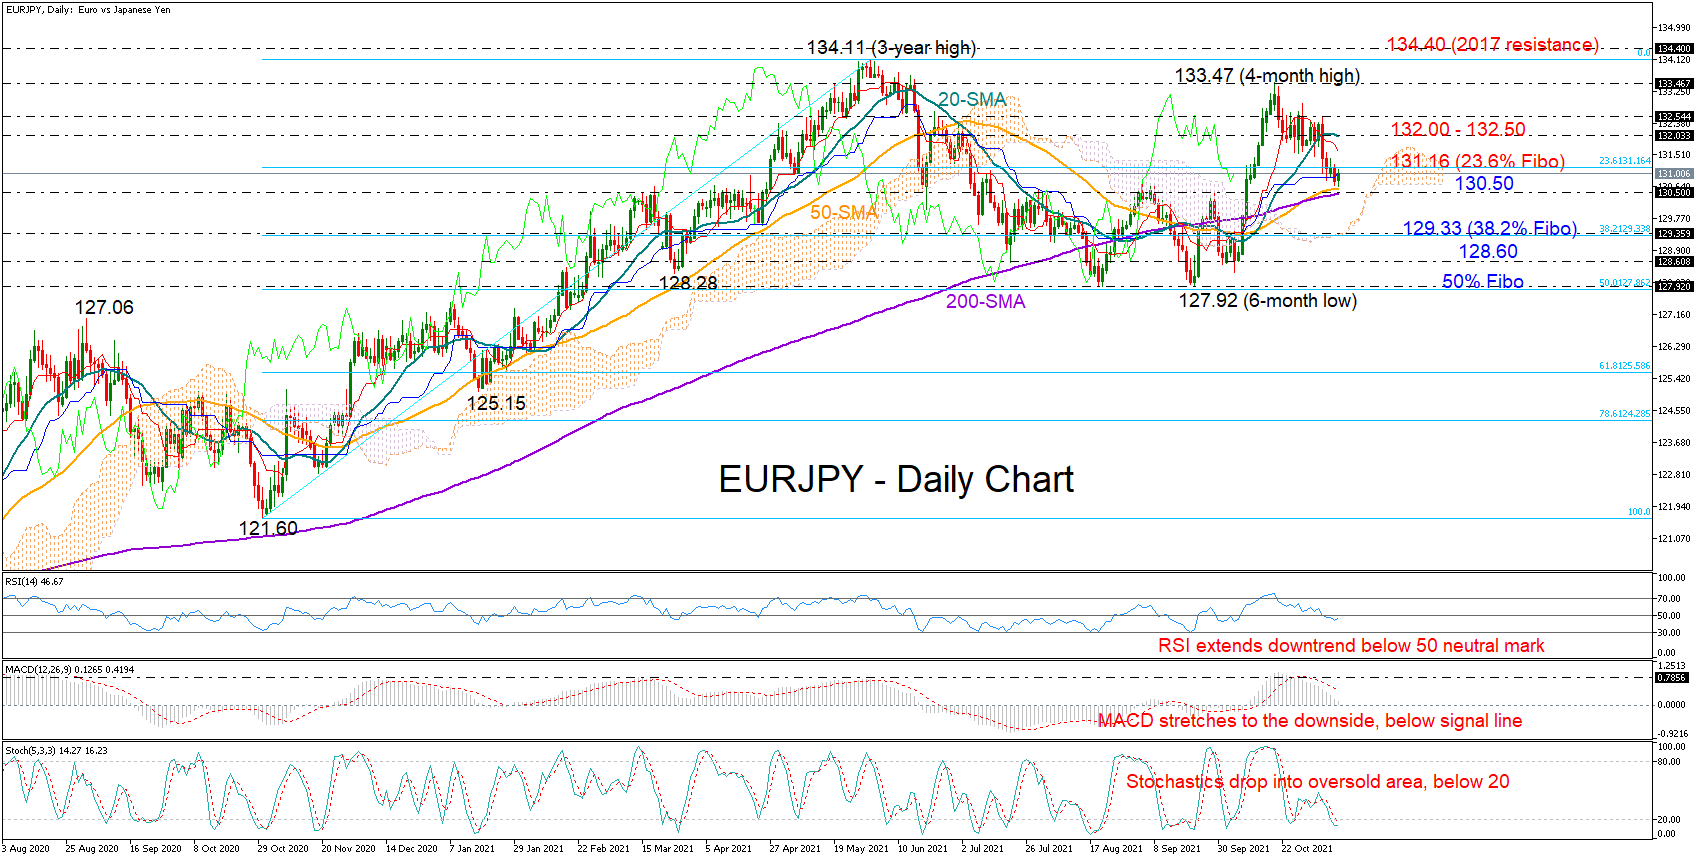
EURJPY has erased half of October’s rally, which peaked at a four-month high of 133.47, with the 50- and 200-day simple moving averages (SMAs) recently coming into the rescue to impede the sell-off around 130.50.
The technical status, however, is still bearish. The RSI has stretched its downtrend into bearish territory, while the MACD continues to lose ground below its red signal line as the Stochastics head back into the oversold zone.
Hence, unless the longer-term SMAs build a solid base, the price could tumble towards the 129.33 level, that being the 38.2% Fibonacci retracement of the 121.60 – 134.11 upleg. Falling lower, the price may attempt to pivot around 128.60 before the 6-month low of 127.92 comes on the radar.
On the upside, the 23.6% Fibonacci of 131.16 has been capping bullish actions the past two days. Therefore, a forceful move above that bar could be the key for a rally towards the 20-day SMA and the 132.00 barrier. Not far above, the 132.50 mark could delay any progress towards the 4-month high of 133.47.
Meanwhile in the medium-term picture, the pair is still in a trendless market, moving sideways between the 134.11 and 127.92 boundaries. Any violation at these limits would alter the neutral outlook accordingly.
In summary, despite the recent selloff, EURJPY bears seem to have more fuel in the tank. A break below 130.50 could confirm additional negative extensions, though in the medium-term picture a freefall below 127.92 would be needed to switch the neutral trajectory to bearish.