Sample Category Title
EUR/USD Outlook: Close Below Key Fibo Support Could Spark Bigger Drop
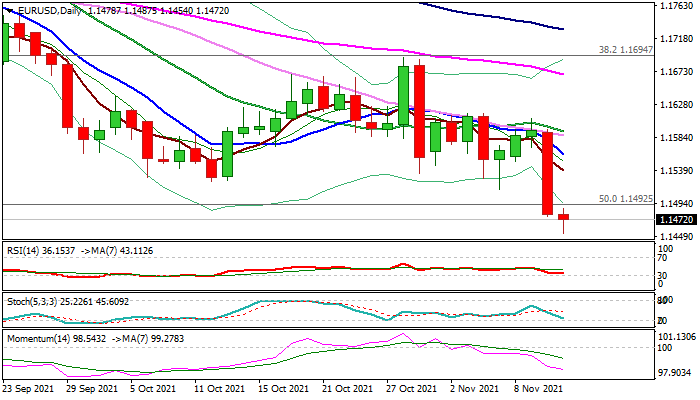
The Euro remains in red on Thursday and extends weakness to the new 2021 low, hitting the lowest level since July 2020, following nearly 1% drop on Wednesday (the third biggest daily fall this year).
Higher than expected US inflation in October boosted expectations that the Fed may start tightening earlier than expected, increasing demand for the US dollar and putting the single currency under increased pressure.
Wednesday’s massive bearish candle weighs, with strong bearish signal being generated on break and close below pivotal support at 1.1492 (50% retracement of 1.0635/1.2349 advance) that increases risk of acceleration towards 1.1290 (Fibo 61.8% of 1.0635/1.2349).
Broken Fibo support (1.1492) reverts to initial resistance (repeated daily close below to confirm break and validate barrier), with former low at 1.1525 marking next significant level which should ideally protect the upside and keep bears intact.
Res: 1.1492, 1.1525, 1.1559, 1.1586.
Sup: 1.1454, 1.1400, 1.1420, 1.1395.
USD/CAD Reaches Above 1.2500
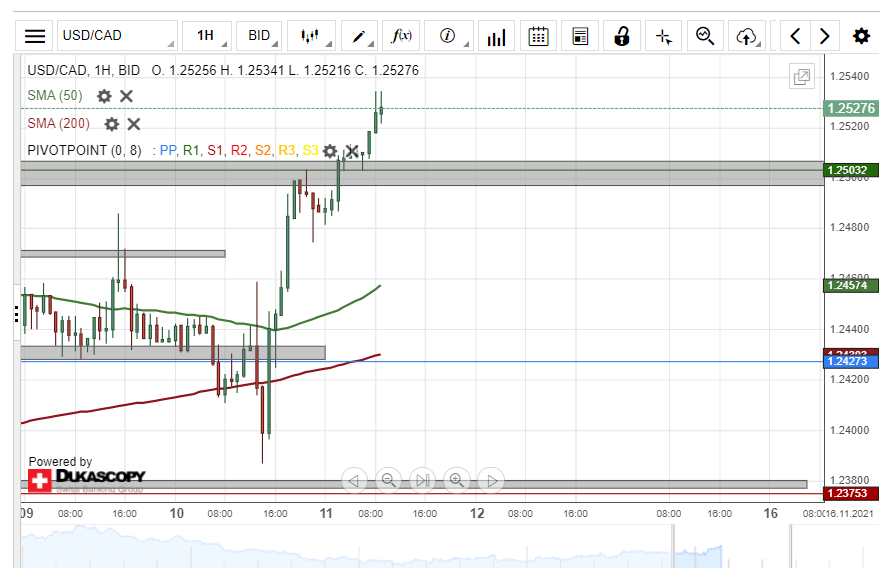
The high volatility period of the USD/CAD currency exchange rate ended with a surge to the 1.2500 level, the zone that surrounds it and the weekly R1 simple pivot point in the zone. On Thursday morning, the rate broke the resistance of the 1.2500 mark and reached for the 1.2530 level.
The USD has been surging against all other currencies since the reveal of higher than forecast US monthly Consumer Price Index data.
In general, the surge is expected to continue. A continuation of the surge might find resistance int he 1.2550 mark and the weekly R2 simple pivot point at 1.2555, before aiming at the 1.2600 mark.
However, the rate could consolidate its gains by declining, A potential decline might look for support in the 1.2500 level and the technical levels that surround it.
GBP/JPY Tests Support Zone
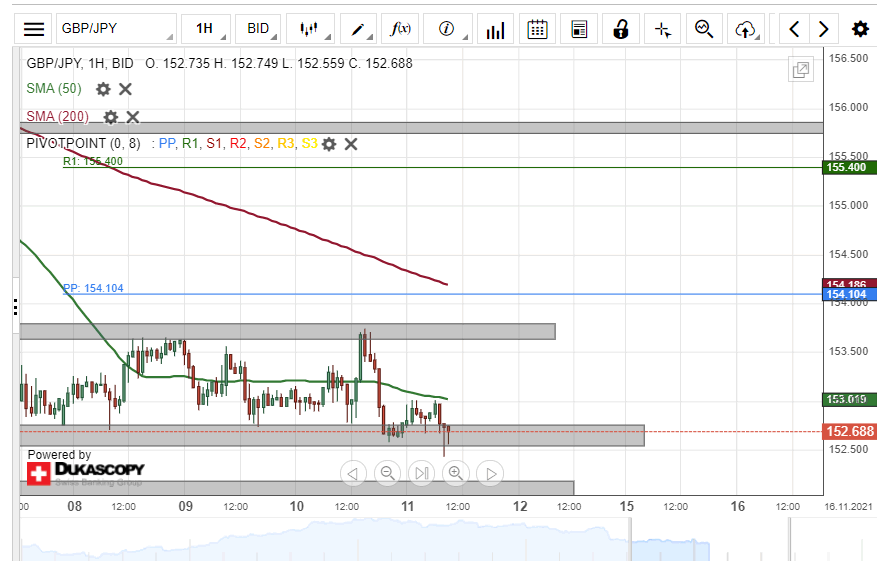
Since Tuesday, the GBP/JPY has been trading in range between the support zone at 152.55/152.75 and the resistance of 153.65/153.75.
However, on Thursday morning, the rate appeared to start to find resistance in the 153.00 level and the 50-hour simple moving average. The resistance of these levels was enough for the rate to move outside the borders of the support zone and shortly trade below the 152.50 level.
A passing of the 152.55/152.75 support zone could result in the rate reaching for the 152.00 level, which had impacted the rate in early October. Below the zone, the weekly S1 simple pivot point at 151.72 might stop a decline.
However, a recovery of the rate would have to first pass the resistance of the 50-hour SMA and the 153.00 mark before aiming at the resistance of the 153.65/153.75 zone.
AUD/USD Drops Below 0.7300
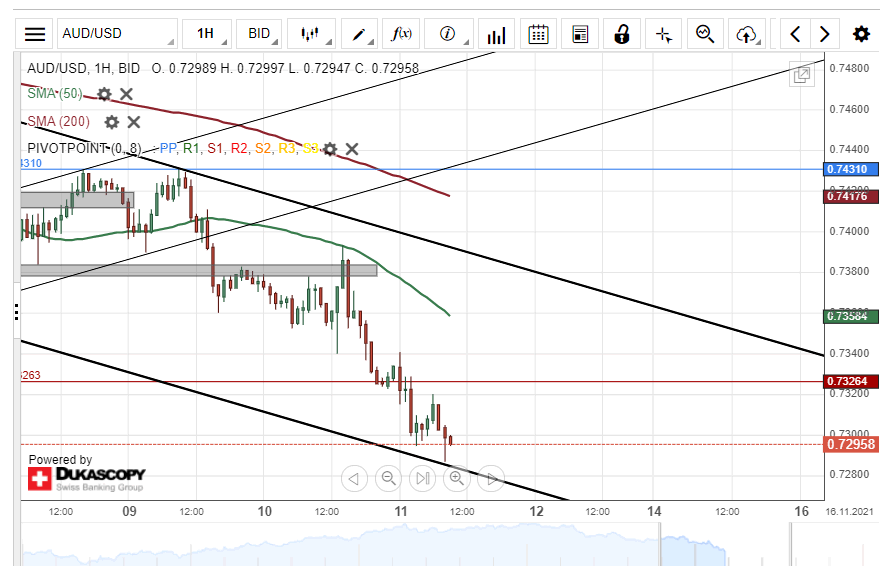
The decline of the AUD/USD extended and reached below the 0.7300 level on Thursday morning. From a technical perspective the decline of the rate gained new energy, as the resistance of the 50-hour simple moving average provided resistance at 0.7394 on Wednesday.
In the meantime, a broader review of the pair's chart has revealed that the previously broken channel up pattern was part of a larger scale pattern. Namely, the junior channel up captured the rate's recovery in the borders of a large scale descending channel. The rate has been trading in the borders of the pattern since late October.
On Wednesday morning, the rate approached the lower trend line of the channel down pattern. If the pair bounces off the support of the trend line, the pair could retrace to the resistance of the weekly S1 simple pivot point at 0.7326. Above the pivot point, the rate might find resistance in the 50-hour simple moving average near 0.7360.
On the other hand, a breaking of the channel pattern could result in a decline. A potential decline would first look for support in the weekly S2 simple pivot point at 0.7255. Below the pivot point, an October low level zone is located at 0.7225/0.7230.
EUR/JPY Returns To Support Zone
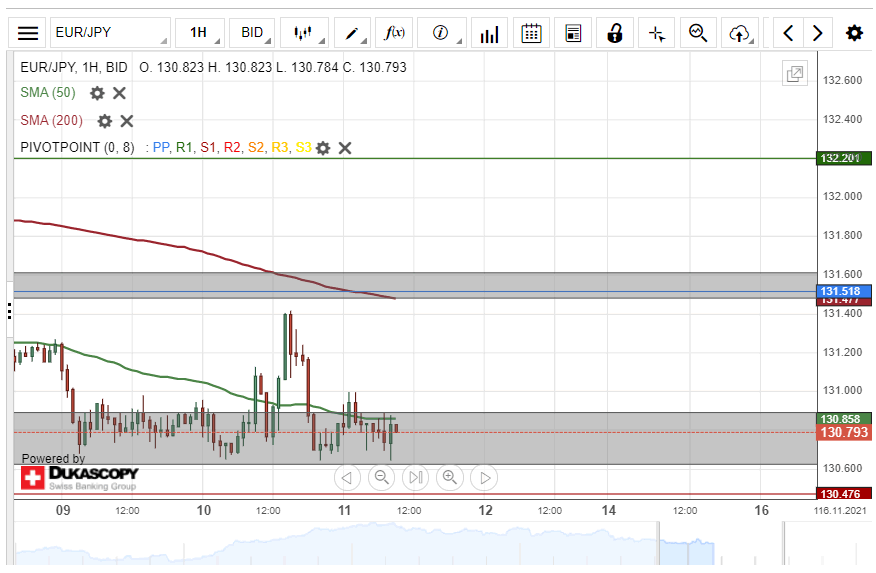
The resistance of the 131.40 mark held on Wednesday, and the EUR/JPY currency exchange rate declined to the support zone at 130.63/130.90. On Thursday morning, the rate was located in the zone and below the resistance of the 50-hour simple moving average at 130.85.
A decline below the support zone would most likely result in the pair looking for support in the weekly S1 simple pivot point at 130.48. If the rate passes the support of the pivot point, the rate could look for support in the 130.00 mark before reaching the weekly S2 at 129.79.
On the other hand, a surge of the pair should first pass the resistance of the 50-hour simple moving average. Above the simple pivot point, the rate would most likely encounter resistance in the 131.40 mark before reaching the resistance zone at 131.48/131.61. Note that the resistance zone is strengthened by the weekly simple pivot point and the 200-hour simple moving average.
XAU/USD Outlook: Gold Is Set For Further Advance But Possibility
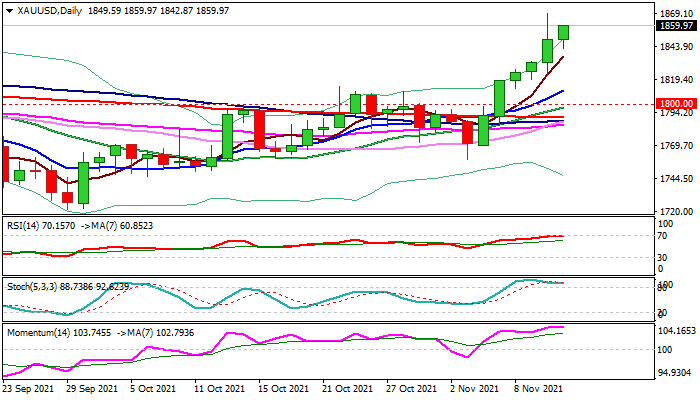
Spot gold extends advance into the sixth straight day on Thursday and pressuring new 5-month high ($1868), posted on Wednesday when metal’s price spiked after higher than expected us inflation data in October.
Rising consumer prices boost demand for gold as an inflation hedge, while a slowdown in the US and Chinese economies contributes to the positive sentiment that could push the price much higher.
Bullseye significant barriers at $1872/75 (weekly cloud top/50% retracement of $2074/$1676, Aug 2020/July 2021 correction), violation of which would unmask psychological $1900 level and May’s peak at $1916.
Bullish studies on daily and weekly charts support the action, which could be interrupted for consolidation due to overbought conditions, with dip-buying favored above the former top at $1834.
However, traders need to remain cautious, as surging inflation may prompt an earlier than expected rate hike that would weigh on yellow metal’s price.
Res: 1868, 1875, 1890, 1900.
Sup: 1842, 1834, 1822, 1813.
USOIL Retreats From Resistance
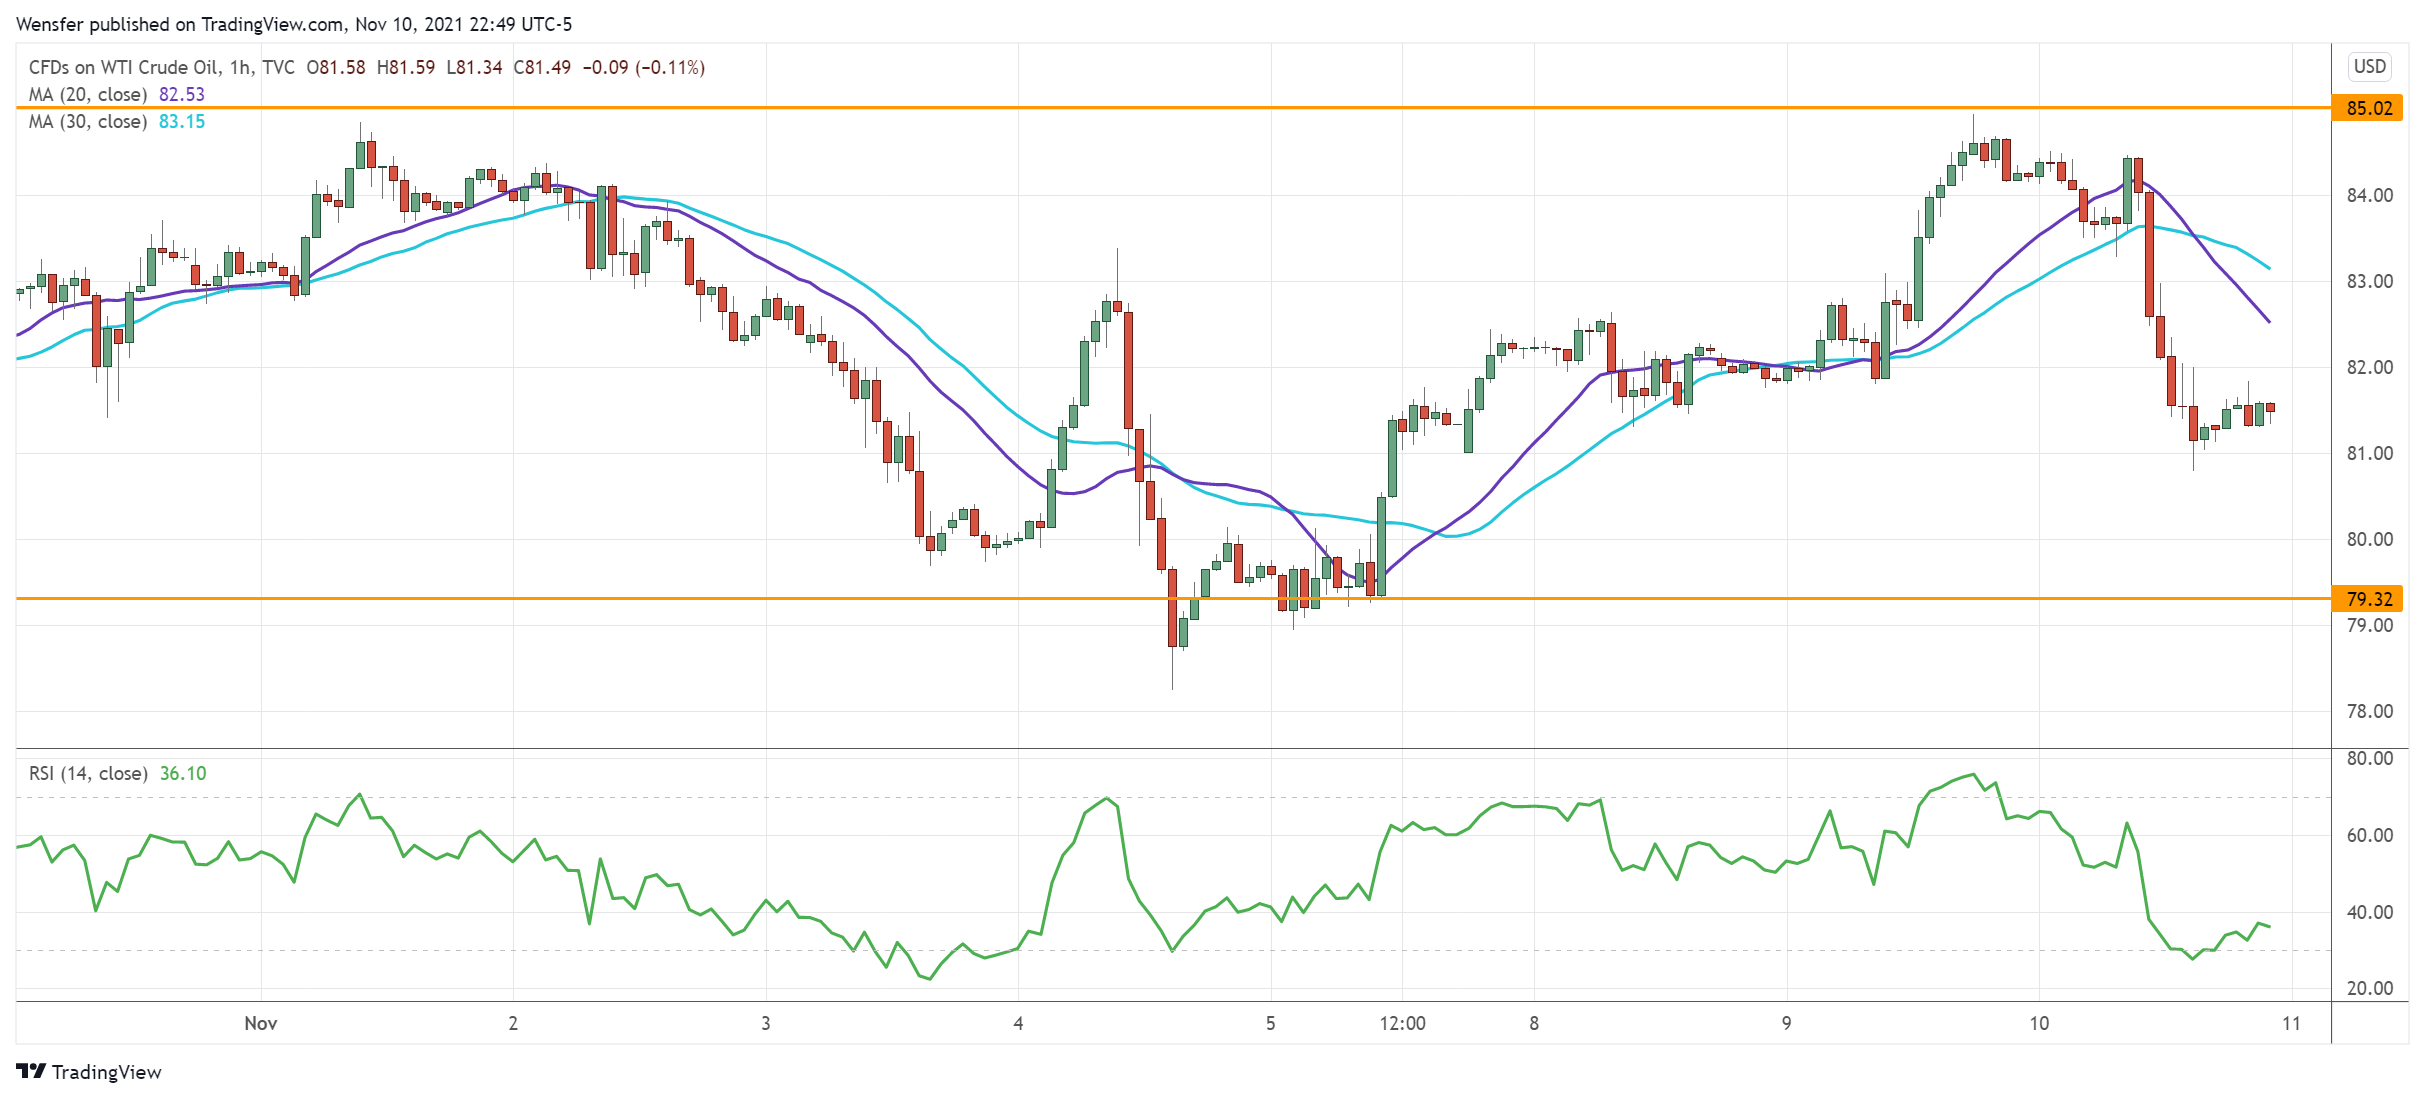
WTI crude edged lower after the EIA reported a slight rise in US inventories. The price’s swift recovery above the sell-off point at 83.00 is an indication that sentiment remains overall optimistic.
However, the previous peak and psychological level of 85.00 seems like a tough hurdle to overcome for now. An overbought RSI has triggered a temporary pullback with a break below 81.90. In turn, this is deepening the correction towards 79.30.
Trend followers may see the limited retracement as an opportunity to stake in.
XAU/USD Breaks Resistance
Rising US CPI boosts the demand for gold as an inflation hedge.
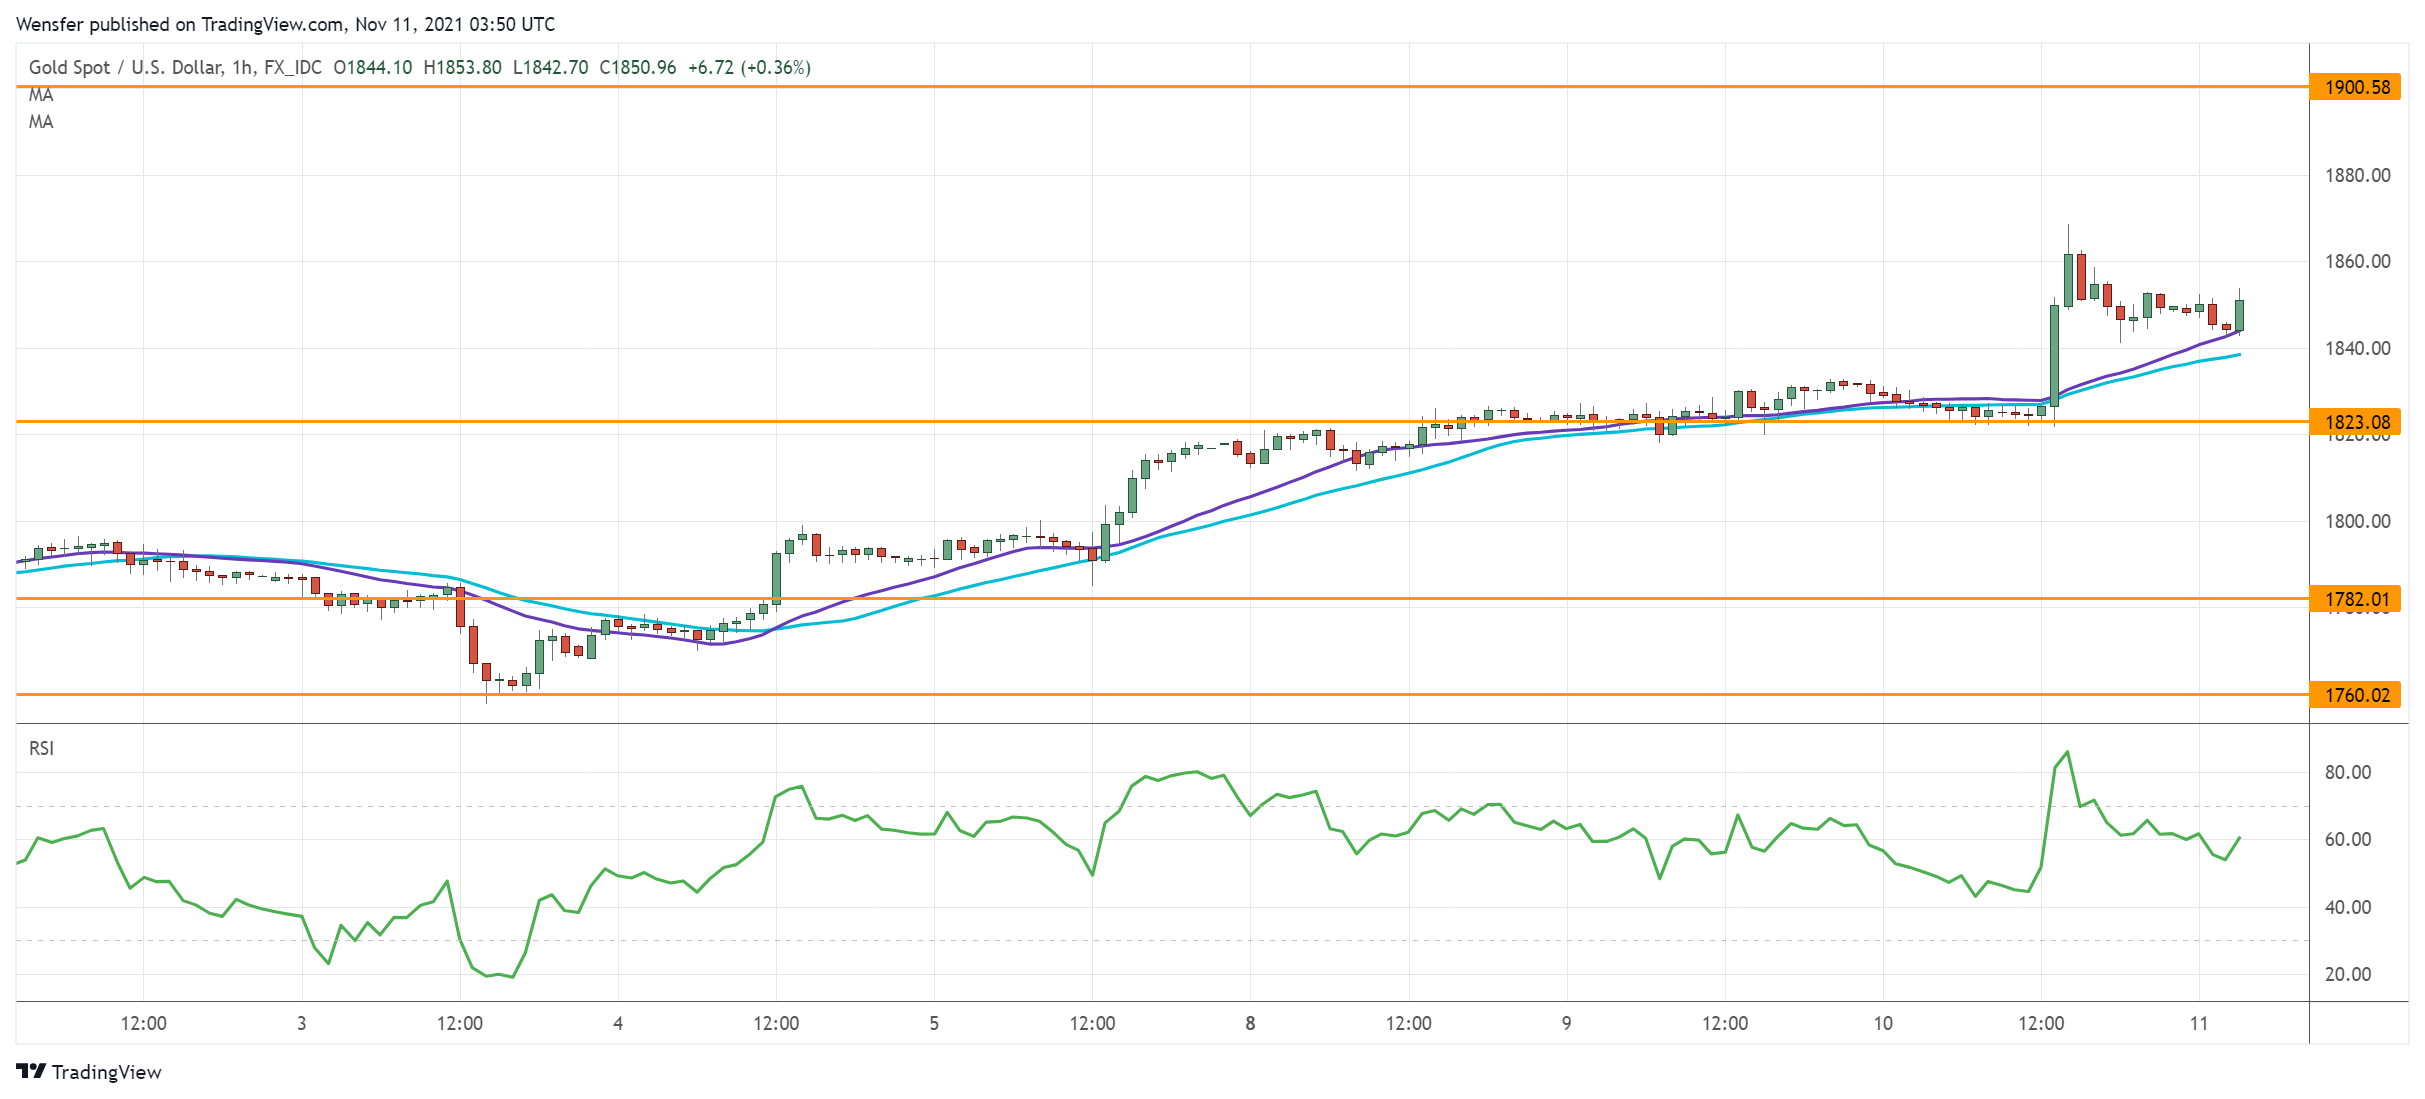
After being unable to clear the daily chart’s triple top at 1833 over the course of the summer, the precious metal has cut through the resistance like a hot knife through butter. High volatility suggests that sellers were quick to bail out.
As momentum traders jump in, the bullish breakout would lead to an extended rally towards 1900. An overbought RSI may cause a limited pullback. In that case, 1823 at the base of the rally may see strong buying interest.
USD/JPY Attempts A Bullish Reversal
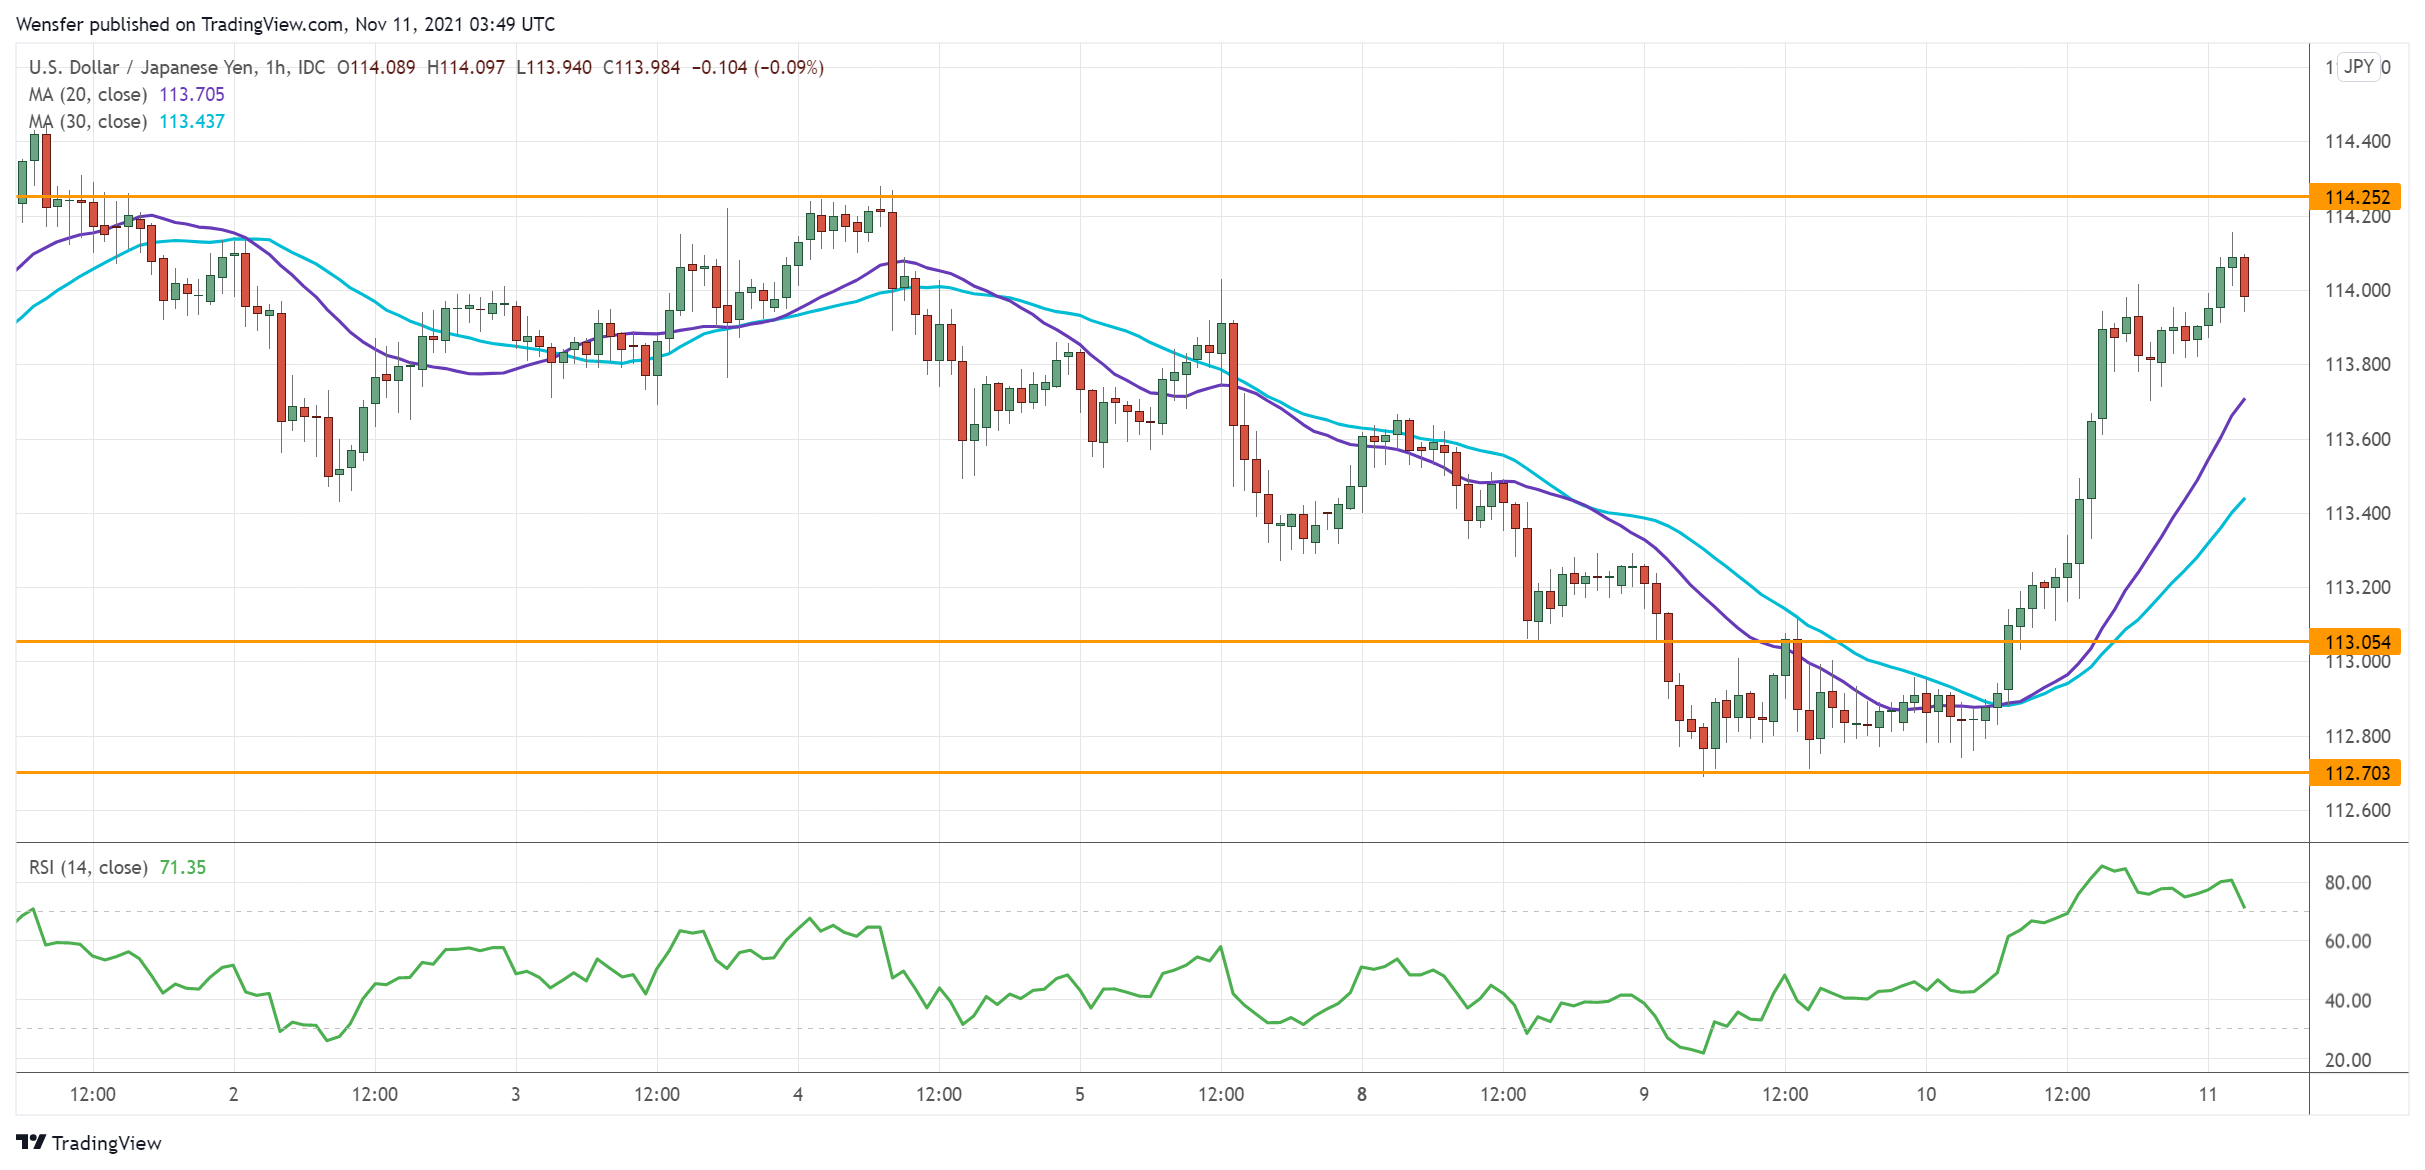
The US dollar broke higher after October’s CPI exceeded expectations.
On the daily chart, the RSI has dropped back into the neutrality area. The greenback has secured bids around the 30-day moving average. An oversold RSI on the hourly chart attracted a ‘buying-the-dips’ crowd at 112.70.
The latest surge above the psychological level of 114.00 has prompted sellers to cover their bets, paving the way for a bullish reversal above 114.25. Before that, an overbought RSI may lead to a pullback towards 113.05.
WTI Oil Futures Trade On Weak Bias After Strong Rejection
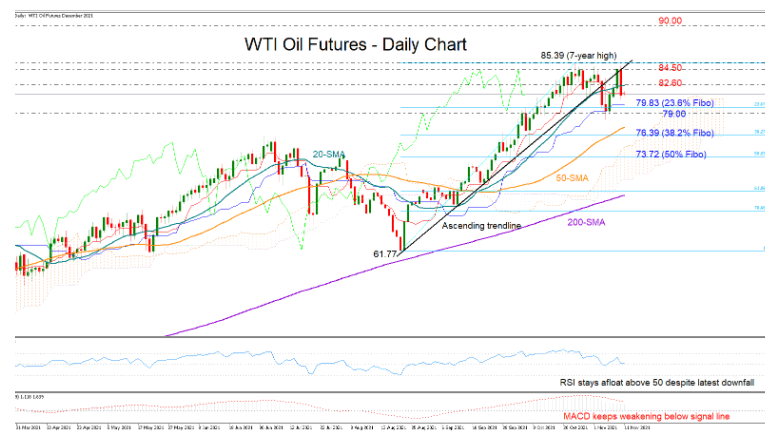
WTI oil futures (December delivery) pulled aggressively below the tough barricade of 84.50, unable to correct the breakout below the ascending trendline, which has switched roles from support to resistance for the price.
The technical picture reflects a neutral-to-bearish short-term bias as the RSI is still floating marginally above 50 following its latest downfall, whereas the MACD keeps stretching downwards below its red signal line.
Should the bears gear up, the price could initially test the 79.83 – 79.00 region formed by the 23.6% Fibonacci of the 61.27 – 85.39 upleg and the limits emerged in early October and November. The 50-day simple moving average (SMA) at 77.33 may attempt to add some footing with the help of the 38.2% Fibonacci of 76.39 if the sell-off picks up steam, while lower, another notable decline is expected to take place, likely driving the price towards the 50% Fibonacci of 73.72.
On the upside, a close above the 20-day SMA at 82.60 is required to access the 84.50 territory. A victorious win here would bring the 90.00 level next on the radar.
In brief, even though the upward trajectory in WTI oil futures remains on track, the price performance in the coming sessions could be depressing.