Sample Category Title
Rate Hike Speculations Heighten as Eurozone’s Inflation Accelerates Further
The latest ECB bulletin, European Commission's latest inflation projections and the preliminary inflation data for October rekindled ECB's rate hike speculations.
At the ECB bulletin, policymakers acknowledged that strong inflation proves more persistent than previously anticipated. Yet, they expected that it would fade next year. As noted in the report, the present inflationary pressure has been driven by “increasing food and energy inflation”. This reflected the low base effect last year. Most of these pressures should be “of a temporary nature”, The ECB attributed the appreciation of inflation to three main factor: 1. Surging energy prices, 2. demand improvement outpacing supply as global economies reopen, and 3. base effects related to the end of the VAT cut in Germany are still contributing to higher inflation.
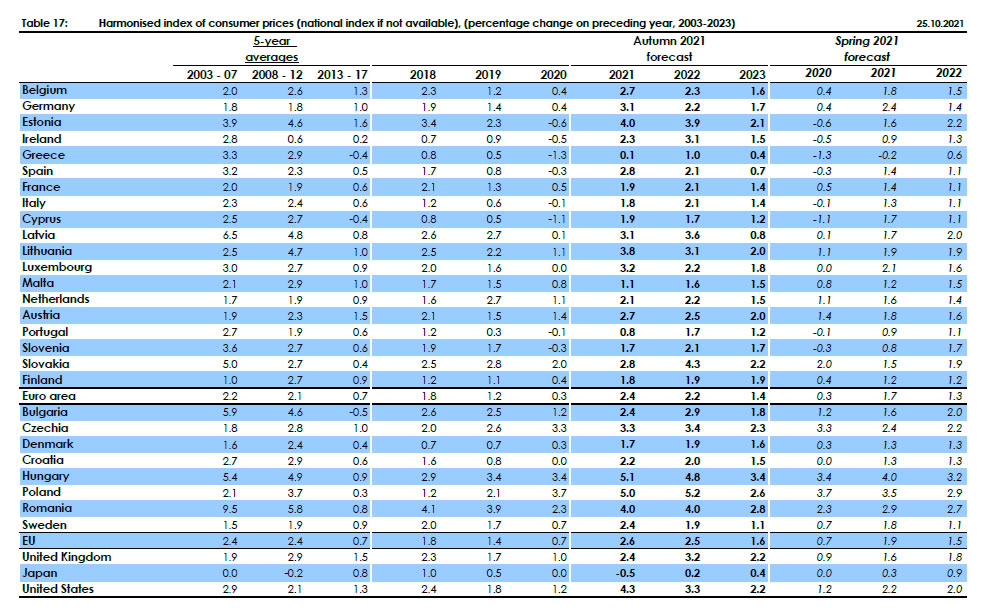
The ECB maintained that strong inflation is of transitory nature. Chief economic Lane, at an interview earlier this week, admitted that “inflation is lasting longer than originally expected”. He added that European Commission forecasts that inflation would reach +2.4% this year, before moderating to +2.2% in 2022 and then to +1.4% in 2023. These are significantly higher than ECB’s September projections of +2.2%, +1.7% and +1.5% for the three years to 2023.
Preliminary data from Eurostat revealed that headline inflation of the bloc accelerated to +4.1% y/y in October. This marks the highest level since July 2008, beating both consensus of +3.7% and September’s +3.4%. The energy component to the inflation data jumped +23% y/y.
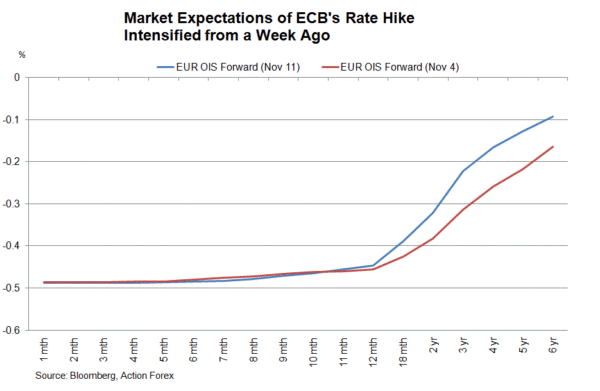
In November, ECB tamed market expectations of a rate hike by end-2022. President Christine Lagarde suggested that the ECB’s analysis “certainly does not support that the conditions of our forward guidance are satisfied at the time of liftoff as expected by markets, nor anytime soon thereafter”. She affirmed confidence that the central bank’s “anticipation and our analysis is actually correct”. Yet, strong preliminary inflation data for October, European Commission’s inflation forecasts and acknowledgement of the persistence of strong inflation at the latest bulletin have rekindled rate hike hopes.
EU expect Eurozone inflation to peak at 2.4% this year
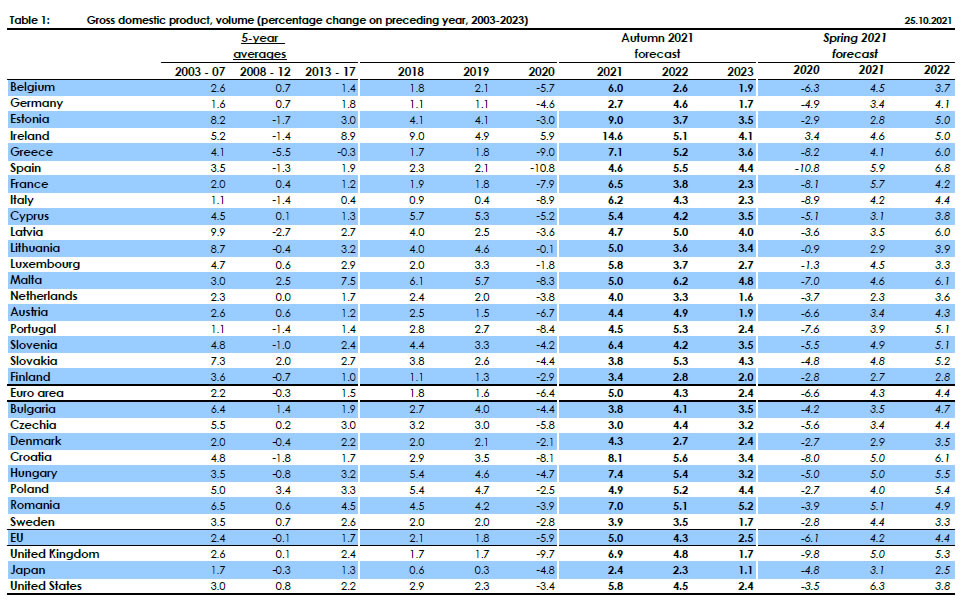
In the Autumn Economic Forecast, European Commission upgraded 2021 GDP growth projection to 5.0% (vs Spring's forecast of 4.3%). Growth is projected to slow to 4.3% in 2022 (vs 4.4), and then 2.4% in 2023.
HICP inflation is projected to peak at 2.4% in 2021 (vs Spring's 1.7%), then slow to 2.2% in 2022 (vs prior 1.3%) and then slow to 1.4%.
Valdis Dombrovskis, Executive Vice-President for an Economy that Works for People, said: "This is no time for complacency: we continue to face uncertainty with this virus and there are some risks to contend with. Not least, we need to address bottlenecks in supply chains, as well as surging energy prices which will affect many households and companies across Europe. We also need to closely monitor inflation and adjust our policies if needed."
EUR/JPY: Drop Below M L3 Pivot Signals Bearish Continuation Move
EUR/JPY Technical Analysis
- Bearish momentum.
- We can see the stronger bearish pressure.
- Yen is getting stronger.
- The drop below M L3 signals continuation.
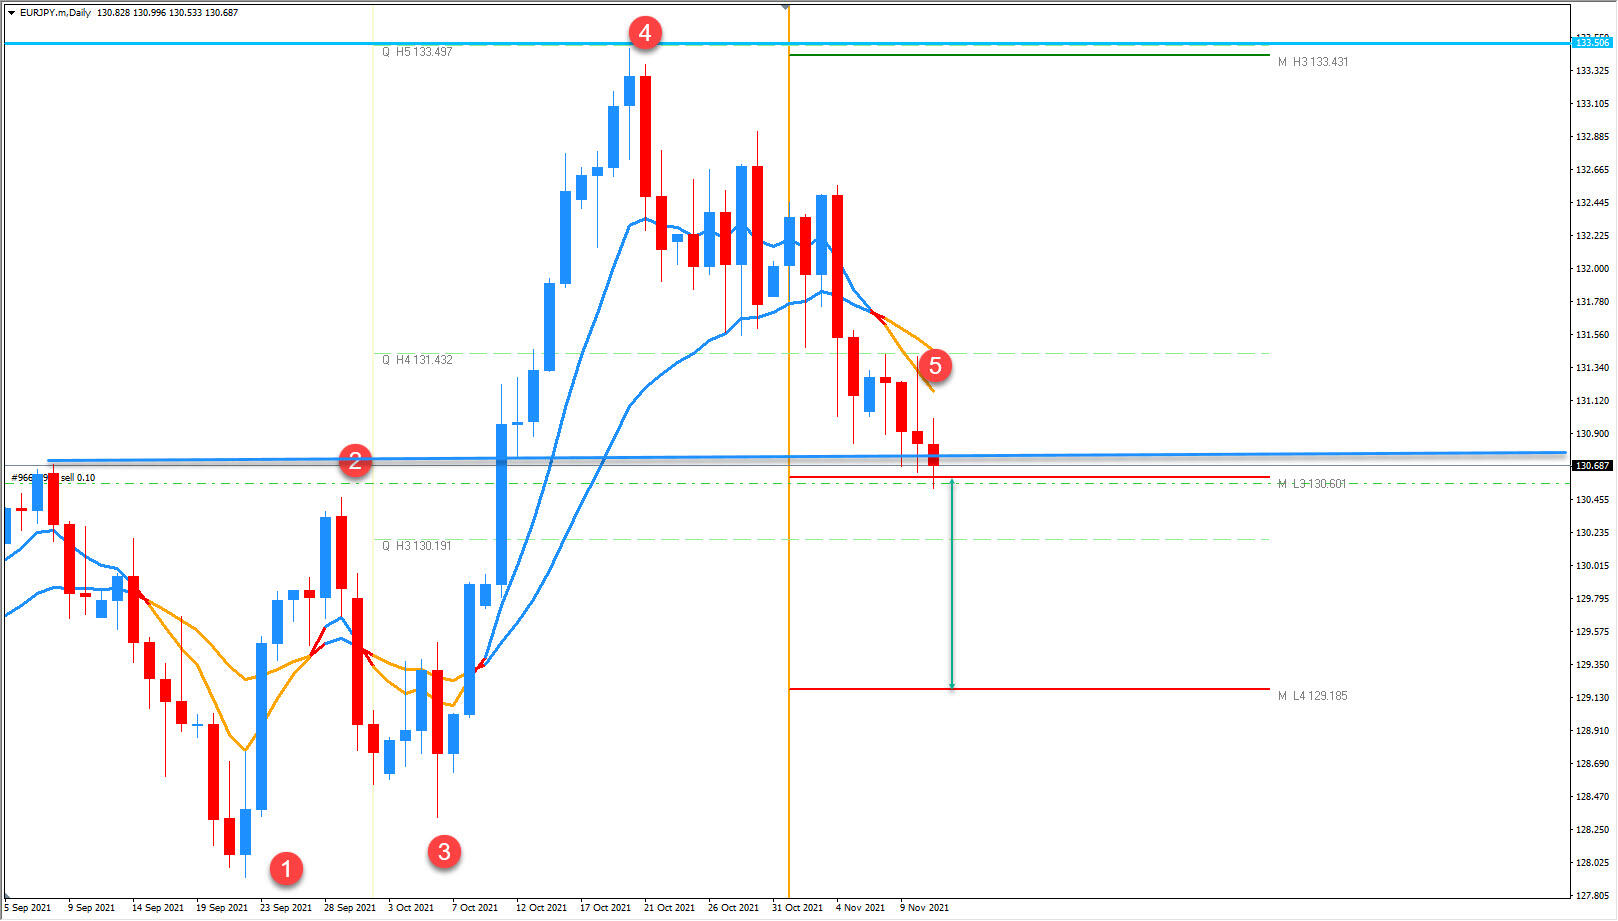
- Low point.
- Order block.
- Swing low.
- Swing high.
- Gravestone Doji variant 2.
The price is bearish. The markets are going down as technical and fundamentals are aligned. BOE stance was dovish and this has absolutely been reflecting on the price. At this point you can see that markets are bearish and the strong opinion is that bearish continuation is developing atm. Targets are 1.3462 followed by 1.3380 and eventually 1.3275. However, as markets are always in the pullback retracement mode, protection of the profits is important when the market gets to important support levels. Selling the rallies is the best way to trade the cable now.
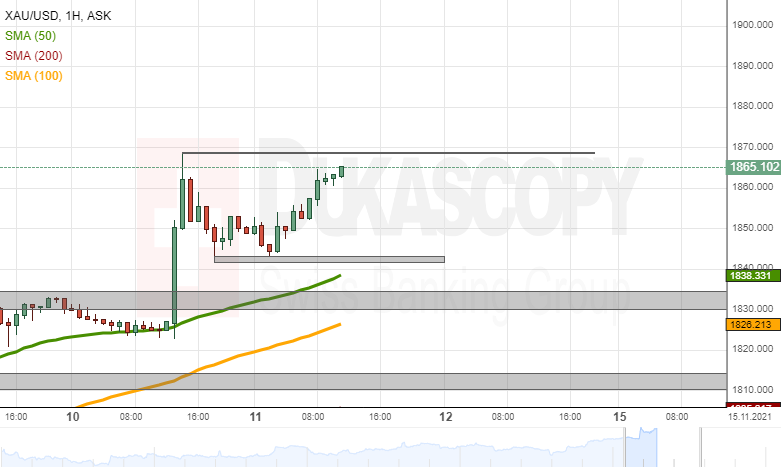
Gold Analysis: Finds Support Above 1,840.00
The retracement from the 1,870.00 level found support above the 1,840.00 mark. Namely, the 1,841.30/1,843.50 zone provided the metal's price with support. By the middle of Thursday's GMT trading hours, the price was once again heading to the 1,870.00 level.
In the case that the price passes the resistance of the 1,870.00 level, the 1,900.00 mark could be the next target for the yellow metal's surge.
On the other hand, a bounce off from the 1,870.00 could return to the 1,841.30/1,843.50 zone. Note that the zone was being approached by the additional support of the 50 and 100-hour simple moving averages near 1,840.00 and 1,830.00.
ECB bulletin: Market-based inflation indicators in line with transient but more persistent rise
In the monthly economic bulletin, ECB said the current phase of higher inflation will "last longer than originally expected", but it's "expected to decline in the course of next year". The factors include sharply risen energy prices, recovering demand outpacing supply, and based effects due to end of VAT cut in Germany. It added, "the influence of all three factors is expected to ease in the course of 2022 or to fall out of the year-on-year inflation calculation".
Meanwhile, ECB also noted that market-based indicators of longer-term inflation expects reached "new highs". Five-year forward inflation-linked swap (ILS) rate five years ahead rose above to 2.1%, highest since August 2014. But it also noted that the increase in ILS rate was "pronounced in short and medium-term maturities". That's "in line with a transient but more persistent increase in near-term inflation".
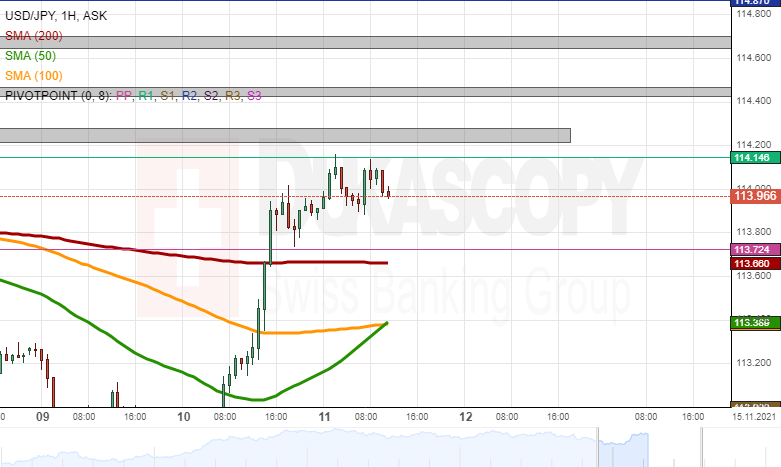
USD/JPY Analysis: Finds Resistance In Pivot Point
The USD/JPY passed the resistance of the 114.00 level during early Thursday's trading hours. However, the pair found resistance in the weekly R1 simple pivot point at 114.15. By the middle of the day's European trading hours, the pair had failed two attempts to pass the pivot point.
In the case that the weekly R1 fails to continue to provide resistance, above the pivot point, the early November high-level zone at 114.20/114.28 might act as resistance. Higher above, another high-level zone at 114.43/114.47 zone.
However, a decline might look for support in the weekly PP at 113.72 and the 200-hour simple moving average of 113.66. Further below, take into account the 100-hour SMA and the 50-hour SMA at 113.40.
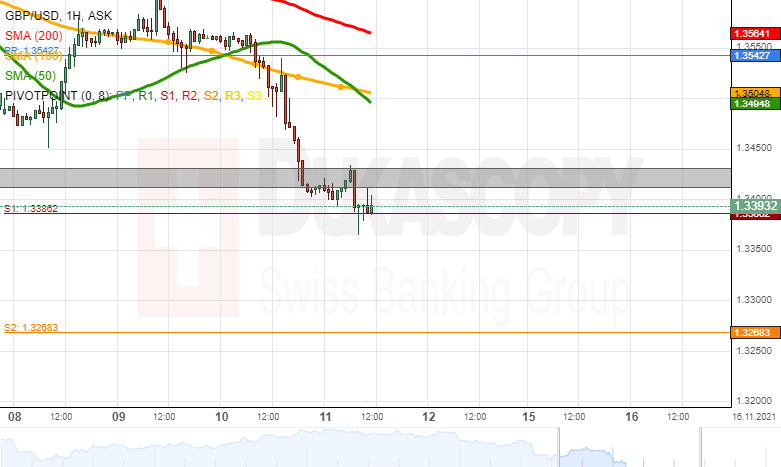
GBP/USD Analysis: Reaches Below 1.3400 Level
By the middle of Thursday's trading, the GBP/USD passed the support of the 1.3450 mark, the October and November low-level zone at 1.3410/1.3430, and the 1.3400 mark, and the rate pierced the weekly S1 simple pivot point at 1.3386. Moreover, the 1.3410/1.3430 zone was confirmed as resistance.
In the highly likely case that the rate continues to decline, the pair could look for support in the 1.3350 level. Afterward, the 1.3300 mark could act as a support level. Meanwhile, the closest technical support level was the weekly S2 simple pivot point at 1.3268.
On the other hand, the sharp decline of the pair could consolidate via trading sideways, until the 50 and 100-hour simple moving averages catch up to the rate.
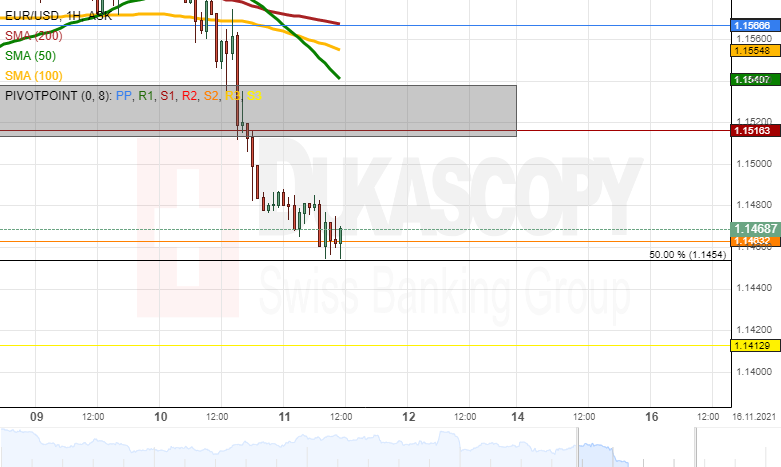
EUR/USD Analysis: Reaches 50.00% Fibonacci Retracement
The decline of the EUR/USD, on Thursday, passed the support of the weekly S2 simple pivot point at 1.1463 and reached the 50.00% Fibonacci retracement level at 1.1455. Future forecasts were based upon whether the retracement level provides support.
If the rate recovers from the 1.1455 level, the EUR/USD might immediately encounter resistance in the form of the weekly S2 simple pivot point at 1.1463. Above the pivot point, the zone at 1.1513/1.1538 might act as resistance.
However, a decline below the 1.1455 level might find support in the weekly S3 simple pivot point at 1.1413, before aiming at the 1.1400 mark.
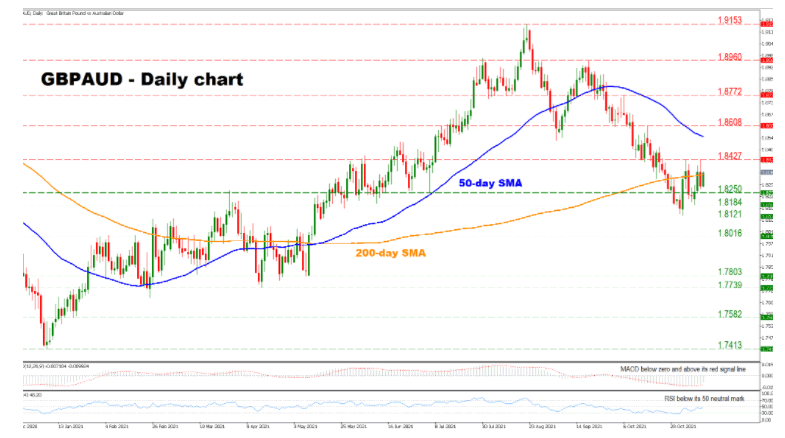
GBPAUD Turns Neutral Amid Waning Negative Momentum
GBPAUD is consolidating following the rebound off the 1.8121 low, with the price currently hovering around the 200-day simple moving average (SMA), as the short-term picture has turned neutral.
The short-term momentum indicators suggest waning negative momentum, as the RSI is increasing but remains slightly below its 50 neutral mark, while the MACD is found below zero but above its red signal line.
Should the price hold above its 200-day SMA currently at 1.8345, the bulls may then target the 1.8427 level. Surpassing this barrier could open the way towards the 50-day SMA, currently at 1.8556. Any advancements beyond that point could turn the cards for the pair, changing its outlook to positive and sending the price to test the 1.8608 resistance.
On the flip side, if the pair breaks below its 200-day SMA, the selling pressure could intensify, sending the price towards the 1.8250 support. A further descending movement from this point could send the bears to target the 1.8184 barrier before moving towards the 1.8121 level. Breaching this obstacle could pave the way towards the strong 1.8016 support.
In brief, the overall short-term outlook for GBPAUD is neutral. However, this might change if the price doesn’t hold above its 200-day SMA, while surpassing the 50-day SMA could turn the outlook for the pair to positive.
EURAUD Crosses Above 200-SMA, Bullish Forces Consolidate
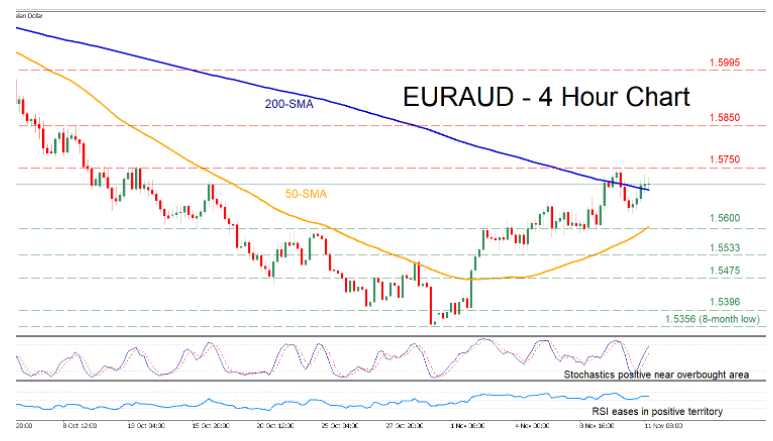
EURAUD has been tumbling in the medium-term but managed to find significant support at the eight-month low of 1.5356 in late October. Since then, the pair has been trending upwards, surpassing both its 50- and 200-period simple moving averages (SMAs). This positive momentum suggests that the near-term bias seems bullish as well.
The momentum indicators reinforce the pair’s positive short-term picture. The stochastic oscillator is pointing upwards near the 80-overbought area, while the RSI is hovering well above the 50-neutral mark.
Should the price continue its ascent in the coming sessions, the next barrier could be met at the 1.5750 region. Clearing this hurdle would reinforce the resumption of the short-term uptrend, setting the stage for the 1.5850 level. Higher up, the price rally might encounter a tougher test at the 1.5995 hurdle.
On the flipside, if positive momentum fades, the price could decline towards the 1.5600 region that has provided both support and resistance on multiple occasions in the last two months. A violation of this level might send the price to test 1.5533. Failing to find support at the aforementioned level, the price could then seek to halt its dip at 1.5475 or even lower at the 1.5396 barricade.
To sum up, EURAUD seems to have the necessary momentum to propel even higher. A break above the 1.5995 barrier would erase the medium-term downtrend, while crossing below 1.5533 would turn the short-term picture back to bearish.