

Sample Category Title
Dollar Extending Broad Based Rally in Quiet Trading
Dollar's broad based rally continues in Asian session today and looks set to have a strong close for the week. Talking about weekly performance, Yen is following the greenback as the next strongest. New Zealand Dollar and Australian Dollar are competing for the worst performing spot. European majors are mixed with Euro, Sterling and Swiss Franc trading in range against each other too.
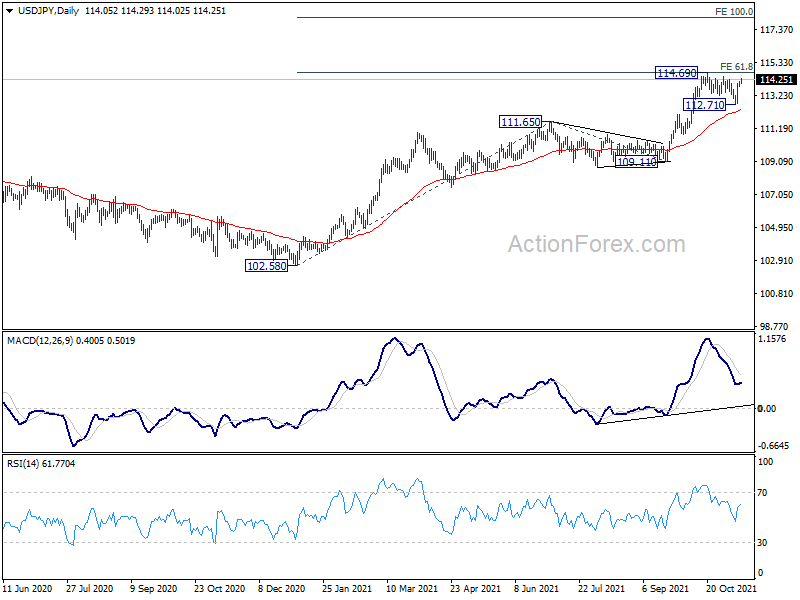
Technically, we're still waiting for USD/JPY to break through 114.69 high to resume the medium term up trend for next projection target at 118.18. But given Yen's strength elsewhere, it might take some more time for the pair to accomplish this breakout. That might also need a strong upside breakout in benchmark US yield to give it a hand.
In Asia, at the time of writing, Nikkei is up 1.01%. Hong Kong HSI is up 0.22%. China Shanghai SSE is down -0.01%. Singapore Strait Times is down -0.01%. Japan 10-year JGB yield is up 0.0072 to 0.078.
SNB Maechler: We are still in a territory where the Swiss franc is high
SNB Board member Andrea Maechler said yesterday that "we are still in a territory where the Swiss franc is high." "The reality is, we continue to have a safe-haven currency," she said. "Uncertainties remain high, largely because of the COVID crisis which continues to be there."
"You've seen recently there has been quite an appreciation of the Swiss franc," Maechler said. "Now if you look at the real exchange rate, it's still higher than 2015. It is something that we do continue to monitor, and we will continue to do so."
Maechler reiterated that it's necessary for the central bank to intervene in the markets.
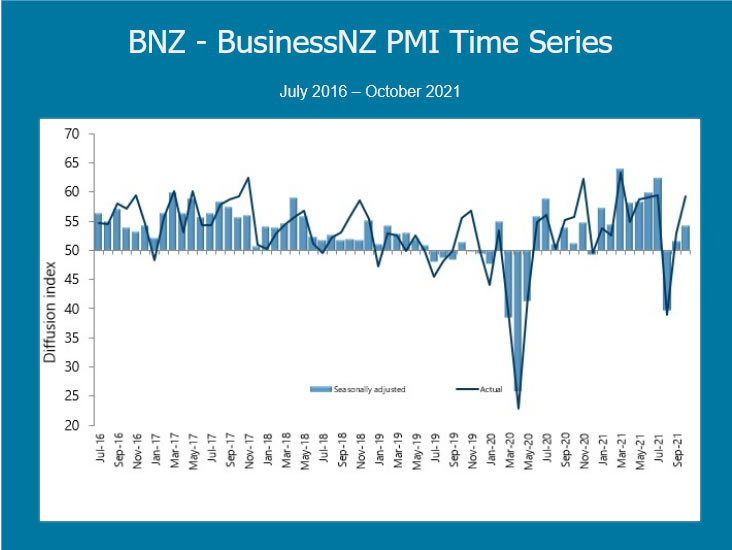
New Zealand BusinessNZ manufacturing rose to 54.3, recovery from a large hard hit
New Zealand BusinessNZ Performance of Manufacturing Index rose from 51.6 to 54.3 in October. Looking at some details, production rose from 49.8 to 54.0. Employment dropped from 54.2 to 52.1. New orders dropped from 54.1 to 53.9. Finished stocks rose from 50.2 to 54.9. Deliveries rose from 47.9 to 59.9.
BNZ Senior Economist, Doug Steel stated that "even though October's reading is above average, we'd classify it more in the realm of some recovery from a large hit rather than an indication of outright strength."
Looking ahead
Swiss will release PPI in European session while Eurozone will release industrial production. US will release U of Michigan consumer sentiment later in the day.
EUR/USD Daily Outlook
Daily Pivots: (S1) 1.1432; (P) 1.1460; (R1) 1.1477; More...
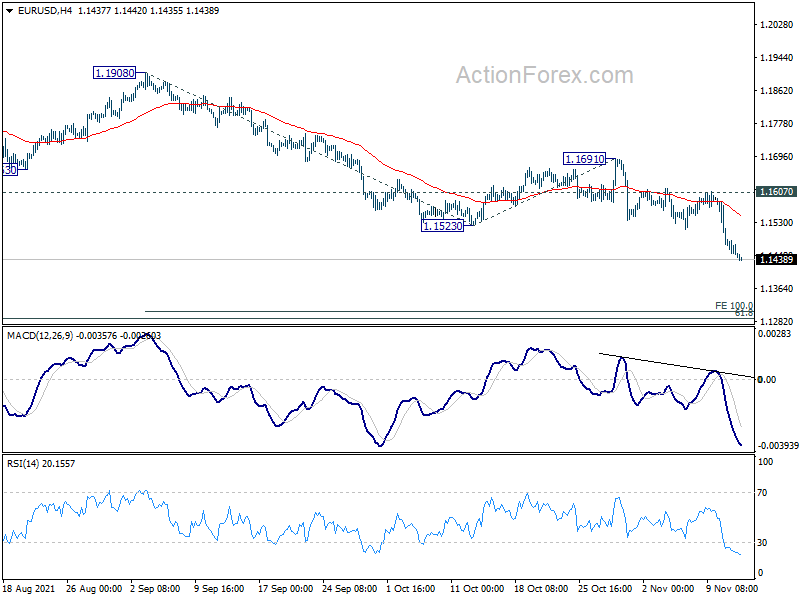
EUR/USD's fall is still in progress and intraday bias stays on the downside. Current decline should now target 100% projection 1.1908 to 1.1523 from 1.1691 at 1.1453 at 1.1306, which is close to long term fibonacci level at 1.1289. On the upside, break of 1.1607 resistance is needed to indicate short term bottoming. Otherwise, outlook will stay bearish in case of recovery.
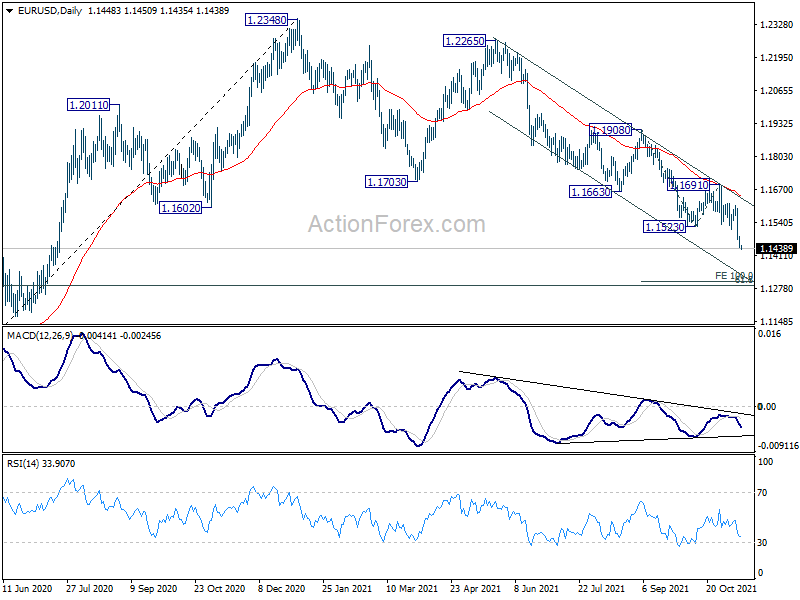
In the bigger picture, price actions from 1.2348 should at least be a correction to rise from 1.0635 (2020 low). As long as 1.1691 resistance holds, deeper fall would be seen to 61.8% retracement of 1.0635 to 1.2348 at 1.1289. Nevertheless break of 1.1691 resistance will revive medium term bullishness and turn focus back to 1.2348 high.
Economic Indicators Update
| GMT | Ccy | Events | Actual | Forecast | Previous | Revised |
|---|---|---|---|---|---|---|
| 21:30 | NZD | BusinessNZ Manufacturing Index Oct | 54.3 | 51.4 | 51.6 | |
| 7:30 | CHF | Producer and Import Prices M/M Oct | 0.20% | |||
| 7:30 | CHF | Producer and Import Prices Y/Y Oct | 4.50% | |||
| 10:00 | EUR | Eurozone Industrial Production M/M Sep | -0.50% | -1.60% | ||
| 15:00 | USD | Michigan Consumer Sentiment Index Nov P | 72.5 | 71.7 |
Cliff Notes: Strong Foundations for Australia’s Recovery and Yet Another Shock from US Inflation
Key insights from the week that was.
The past week has provided evidence of the strong underpinnings of Australia’s recovery from the second wave of the pandemic. Meanwhile in the US, another inflation surprise was seen.
The NAB business survey reported a large jump in conditions and confidence in October to +11 and +21 respectively – both above-average reads. Behind these results was the re-opening of the NSW economy; Victoria’s lockdown nearing an end; and Queensland gaining confidence that their border would re-open before Christmas. Importantly, even with only one of the east coast states re-opening as the survey was sampled, national forward orders jumped 16pts. This highlights the scale of pent-up demand as well as optimism over the outlook. Both should drive employment and investment hence. Note, Australia’s investment outlook was a key theme in the November edition of our Market Outlook in Conversation Podcast, recorded on Tuesday this week.
The Westpac-MI consumer sentiment survey for November also reported a very positive view of the outlook on Wednesday. Households’ views on the economy in one and five years are currently 17% and 21% above average; further, expectations for the labour market are the strongest they have been since the mid-1990’s. While views on family finances are only around-average levels, the special question we ask ahead of Christmas each year on spending intentions recorded its second-best outcome since 2009. Following the survey’s release, Chief Economist Bill Evans provided an in-depth update on the detail of the report and the implications for consumption and housing.
Thursday then saw yet more good news vis a vis the recovery, this time with respect to the labour market. The loss of 46k jobs in a month, bang in line with our -50k forecast, is not normally a positive result, particularly when it is well below the market consensus estimate, +50k. However, month-to-month, this is a significant improvement following the loss of 146k and 141k jobs in August and September respectively. Further, participation in the labour force rose 0.13ppts in the month, signalling confidence that employment opportunities will increase as the recovery takes hold.
This is precisely how we view the outlook. While rebounding participation is expected to keep the unemployment rate above 5.0% for a few months, by the end of Q1 2022 it is expected to be well on its way to a sub-4.0% figure come December 2022, a level consistent with full employment.
Offshore this week, there was one release of particular significance. At 0.9%, the US CPI outcome for October was materially above expectations. It was not just the monthly outcome that was significant, but also the annual rate of 6.2%yr, a new three-decade high and three times the FOMC’s medium-term target of 2.0%yr. Further, there was breadth to the above results, with the core CPI up 0.6% in the month and 4.6%yr.
Market pricing for the US federal funds rate jolted higher following the CPI release, with 56bps of hikes priced in by December 2022 after the release compared to 41bps before. However: from the revised December 2022 starting point, rate hike pricing for 2023 and 2024 is little changed; and, using the 10-year yield as a predictor of the peak fed funds rate for this cycle, expectations for the coming hiking cycle remain very modest, with the current 10-year yield of 1.60% materially below the FOMC’s ‘longer-run’ projection for the federal funds rate of 2.50%.
Our own peak for the federal funds rate is 1.625% in late-2024, though between now and then we expect the US 10-year to rise to 2.30% end-2022 and to drift back only slowly to 2.00% by end-2024. The reason this is the case is that, despite the strength of current price pressures, like the FOMC, we continue to believe they will prove transitory.
In the US, fiscal support for consumer spending is fading quickly and, except for a few key items such as rents, it seems as though prices across the economy have largely reset, limiting further upside. Globally, production backlogs are being worked through. And, from a developed-world demand perspective, we must also recognise that real wages growth is currently going backwards, and many have leveraged up to invest in housing with lasting consequences for discretionary consumption, particularly as interest rates rise.
A final note for the week on currencies. The above US CPI outcome saw the US dollar DXY index leap higher from around 94 to 95.2 as we write – its highest level in more than a year. As elevated inflation is a global issue and given the reactive stance of the FOMC, we continue to believe the US dollar will lose ground into year end and in 2022. This trend should also be supported by the broadening recovery in the global economy and diminishing risks to the outlook. Near-term however, it is probable that the market will hold onto its positive US dollar bias.
Elliott Wave View: FTSE Extending In Wave 5
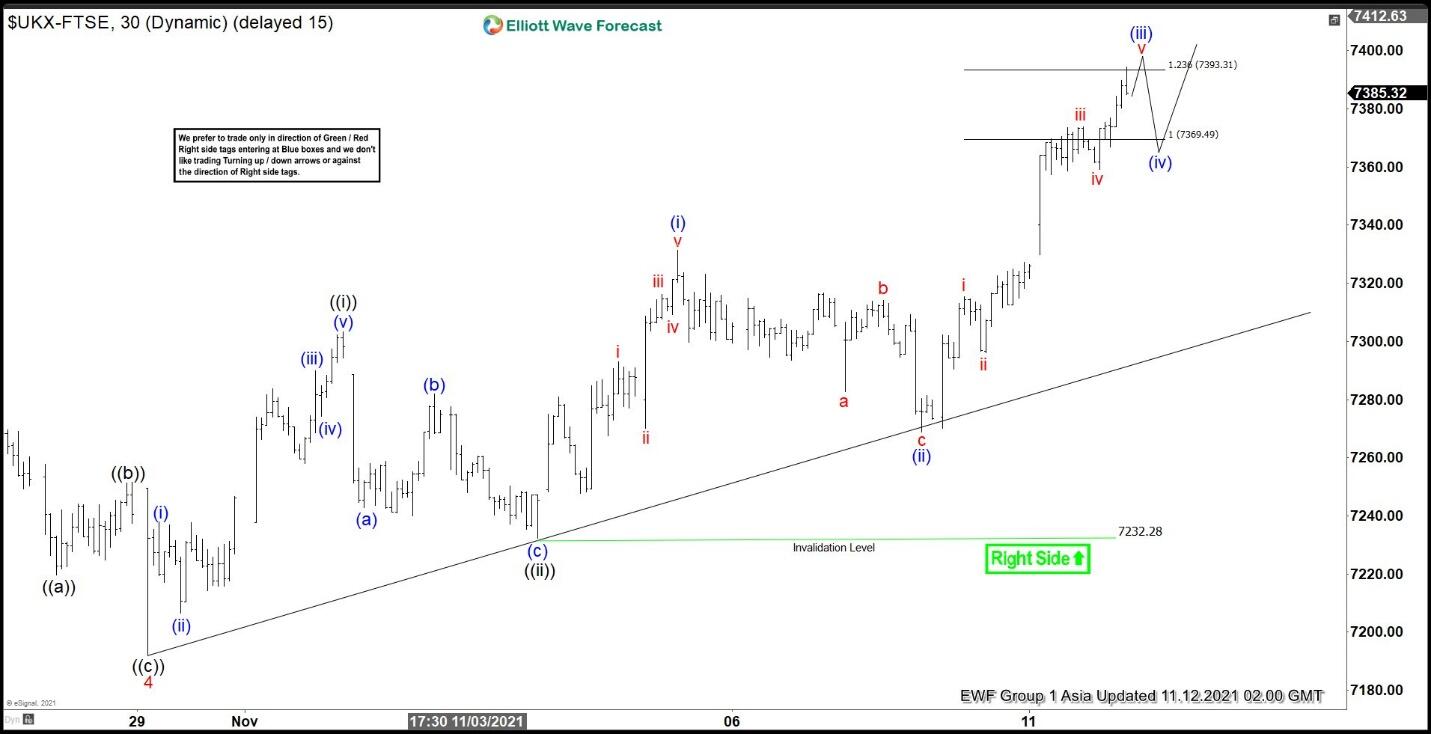
Short Term Elliott Wave view on FTSE suggests the rally from September 20, 2021 low is unfolding as a 5 waves impulse. Up from September 20 low, wave 1 ended at 7159.61 and dips in wave 2 ended at 6945.50. The Index then rallies higher in wave 3 towards 7281.176, and pullback in wave 4 ended at 7192.05. Internal subdivision of wave 4 unfolded as a zigzag structure as 30 minutes chart below shows. Down from wave 3, wave ((a)) ended at 7219.71 and wave ((b)) ended at 7251.55. Wave ((c)) of 4 lower ended at 7192.05.
Wave 5 higher is currently in progress with internal subdivision as another impulse in lesser degree. Up from wave 4, wave ((i)) ended at 7303.39 and pullback in wave ((ii)) ended at 7232.28. Wave ((iii)) rally is in progress as another impulse in lesser degree. Up from wave ((ii)), wave (i) ended at 7331.25 and dips in wave (ii) ended at 7268.79. Near term, expect wave (iii) to end soon, then it should pullback in wave (iv) before the next leg higher in wave (v) of ((iii)). Near term, as far as pivot at 7232.28 low stays intact, expect dips to find support in 3, 7, or 11 swing for more upside.
FTSE 30 Minutes Elliott Wave ChartShort Term Elliott Wave view on FTSE suggests the rally from September 20, 2021 low is unfolding as a 5 waves impulse. Up from September 20 low, wave 1 ended at 7159.61 and dips in wave 2 ended at 6945.50. The Index then rallies higher in wave 3 towards 7281.176, and pullback in wave 4 ended at 7192.05. Internal subdivision of wave 4 unfolded as a zigzag structure as 30 minutes chart below shows. Down from wave 3, wave ((a)) ended at 7219.71 and wave ((b)) ended at 7251.55. Wave ((c)) of 4 lower ended at 7192.05.
Wave 5 higher is currently in progress with internal subdivision as another impulse in lesser degree. Up from wave 4, wave ((i)) ended at 7303.39 and pullback in wave ((ii)) ended at 7232.28. Wave ((iii)) rally is in progress as another impulse in lesser degree. Up from wave ((ii)), wave (i) ended at 7331.25 and dips in wave (ii) ended at 7268.79. Near term, expect wave (iii) to end soon, then it should pullback in wave (iv) before the next leg higher in wave (v) of ((iii)). Near term, as far as pivot at 7232.28 low stays intact, expect dips to find support in 3, 7, or 11 swing for more upside.
FTSE 30 Minutes Elliott Wave Chart
New Zealand BusinessNZ manufacturing rose to 54.3, recovery from a large hard hit
New Zealand BusinessNZ Performance of Manufacturing Index rose from 51.6 to 54.3 in October. Looking at some details, production rose from 49.8 to 54.0. Employment dropped from 54.2 to 52.1. New orders dropped from 54.1 to 53.9. Finished stocks rose from 50.2 to 54.9. Deliveries rose from 47.9 to 59.9.
BNZ Senior Economist, Doug Steel stated that "even though October's reading is above average, we'd classify it more in the realm of some recovery from a large hit rather than an indication of outright strength."
USD/JPY Remains Supported Above 113.00, Dollar Gains
Key Highlights
- USD/JPY remains well supported near 113.00 and 112.75.
- It is facing a major hurdle near 114.35 on the 4-hours chart.
- EUR/USD extended decline and traded below 1.1500.
- GBP/USD traded to a new weekly low below the 1.3440 support.
USD/JPY Technical Analysis
The US Dollar found support near the 112.70 zone against the Japanese Yen. USD/JPY started a fresh increase above the 113.00 resistance zone.
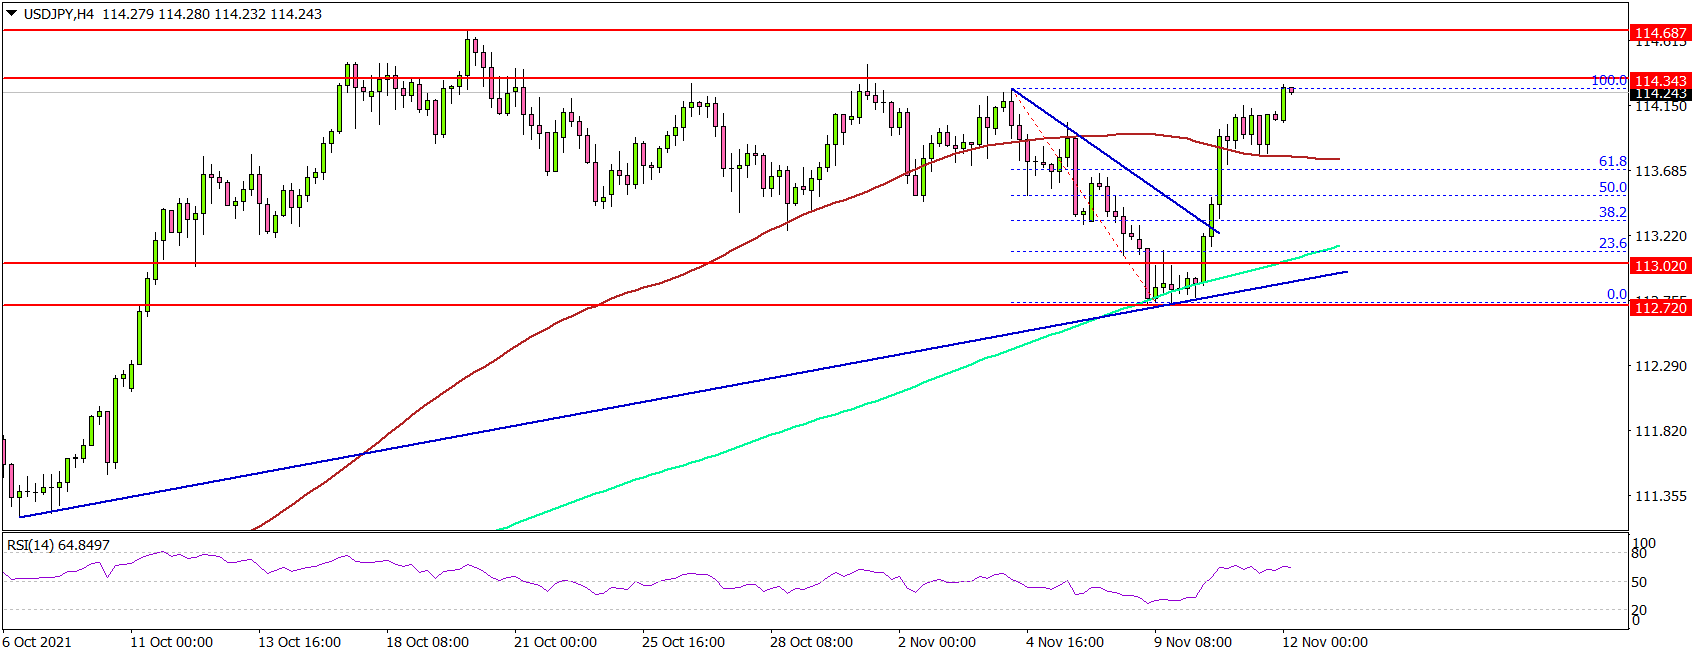
Looking at the 4-hours chart, the pair settled above the 113.20 pivot level and the 200 simple moving average (green, 4-hours). There was a clear break above the 113.50 level and the 100 simple moving average (red, 4-hours).
Besides, the pair traded above the 50% Fib retracement level of the downward move from the 114.27 swing high to 112.72 low.
On the upside, an immediate resistance is near the 114.35 level. The next major resistance is near the 114.65 level. A clear break above the 114.35 and 114.65 resistance levels could open the doors for a steady increase.
An immediate support is near the 113.50 level. The main breakdown support is near the 113.00 level and the 200 simple moving average (green, 4-hours).
A close below 113.00 could open the doors for a move towards the 112.20 level. The next major support is near the 111.50 level.
Looking at EUR/USD, the pair extended decline and traded below the key 1.1500 support. Besides, GBP/USD also declined below the 1.3500 support zone.
Economic Releases
- Euro Zone Industrial Production for Sep 2021 (MoM) - Forecast -0.5%, versus -1.6% previous.
SNB Maechler: We are still in a territory where the Swiss franc is high
SNB Board member Andrea Maechler said yesterday that "we are still in a territory where the Swiss franc is high." "The reality is, we continue to have a safe-haven currency," she said. "Uncertainties remain high, largely because of the COVID crisis which continues to be there."
"You've seen recently there has been quite an appreciation of the Swiss franc," Maechler said. "Now if you look at the real exchange rate, it's still higher than 2015. It is something that we do continue to monitor, and we will continue to do so."
Maechler reiterated that it's necessary for the central bank to intervene in the markets.
Market Morning Briefing: EURJPY Has Bounced A Bit While Above 130.50
STOCKS
Equities continue to remain vulnerable. Dow has broken below 36000 and could be bearish towards 35000 in the near term while Dax is expected to remain ranged within 15900-16100 bot being immediate support and resistance levels. Nifty and Sensex can be headed lower if they sustain below 17800 and 60000 respectively. Nikkei has risen well above 29500 again and can be headed higher on a decisive break above 29750.Shanghai has immediate resistance at 3575 which needs to break in order to move up further.
Dow (35921.23, -158.71, -0.44%) has broken below 36000 and while the fall sustains, it can fall further towards 35000.
DAX (16083.11, +15.28, +0.095%) is trading in the range of 15900-16100 mentioned yesterday. 15900 is a good support which can produce a bounce towards 16400 eventually.
Nikkei (29612.21, +334.35, +1.14%) has risen sharply today re-entering levels above 29500. A rise above 29750 is needed to turn bullish towards 30000/31000 else a fall back to 29000 can be possible. Watch price action near 29750.
Shanghai (3530.86, -1.93, -0.055%) rose sharply and went up to test 3540.60 before coming down. The view is bullish while above 3500 to test 3575-3600. On the contrary, a break below 3500/3450 can take the index down towards 3400/3350.
Nifty (17873.60, -143.60, -0.80%) made an intraday low of 17798.20 before closing at 17886.70 yesterday as support near 17800 seems to have held well. A fall towards 17600/400 is possible if we see a break below 17800.
Sensex (59919.69, -433.13, -0.72%) has closed below the crucial level of 60000. While below 60000, a fall towards 59000/59500 is possible before we see a rise again in the medium term.
COMMODITIES
Most commodities trade higher and while above respective supports, the uptrend is likely to remain intact. Brent and WTI needs to sustain and bounce from supports near 82.08-81.66 and 80 respectively to rise towards 85+ and 83-84 in the near term. Gold looks bullish while above 1840 and can rise towards 1880-1925 on the upside. Silver has broken above 25 and can slowly rise towards 26-26.50. Copper needs to break above 4.45 to head higher else could remain within 4.25-4.45 for the near term.
Brent (82.43) has crucial support at $82.08-81.66 on the Daily Candles. We need to see if it triggers a rise past $85 to $90. While below $85, there could be chances of a break below $82 targeting $80. Very delicate juncture.
WTI (81.19) too has similar support at 80 which if holds can produce a bounce back to 83-84 in the near term and then eventually higher towards 85-86 but if the price falls below 80, it could be vulnerable for a sharp fall targeting 78-76 initially.
Gold (1860.30) attempted to again test 1870 yesterday before coming off from there. While above 1840, the upward movement may hold targeting 1880-1925 on the upside.
Silver (25.18) has risen well breaking above our expected 25. While the rise sustains above 25, the price can rise towards 26-26.50 soon. View is bullish above 25.
Copper (4.40) has risen well too but needs to break above 4.45 and sustain in order to move up further towards 4.55/60 in the medium term. For now, watch price action near 4.45.
FOREX
Dollar Index has risen sharply and could be headed towards 96 before reversing from there. Euro can test 1.14. EURJPY needs to hold above 130.50 to keep possibility of a sharp bounce from current levels. Aussie and Pound look bearish for the near term. Dollar Yen can be headed towards 115.50 while above 114. USDINR can fall while below resistance at 74.60/80 holds. Watch price action near 74.25, a break below which would trigger a fall to 73.80/50. USDCNY can be ranged within 6.41-6.38.
Dollar Index (95.229) has risen well breaking above 95 faster than expected. The index could be headed towards 96 soon. Watch if the index pauses at 96 to reverse from there or breaks higher.
Euro (1.1440) has been falling as expected and could head towards support at 1.14 before bouncing from there.
EURJPY (130.69) has bounced a bit while above 130.50. We need to see if the cross bounces higher to target 131-131.50 or remains stuck within the narrow 130.75-130.50 region and moves lower. For now support at 130.5 is holding.
Aussie (0.7285) continues to fall and looks bearish for a test of 0.7250-0.7240 which could act as a near term trend support and produce a decent bounce towards 0.73.
Pound (1.3358) is in a strong downtrend and could test support near 1.33 from where a bounce can be possible towards 1.3450.
Dollar-Yen (114.23) keeps the upmove intact while above 114 the pair is headed towards 115.50.
USDCNY (6.3959) has immediate Resistance at 6.41 which if holds can keep a sideways range of 6.41-6.38 for the near term.
USDINR (74.5225) has immediate resistance at 74.60 which is holding well for now. A dip is possible today and if the RBI allows a dip below 74.25, it can increase chances of a fall towards 73.80/50. Watch resistance at 74.60/80
INTEREST RATES
The US Treasury yields have inched up further. Our view of seeing a rise in the near-term remains intact. Overall, we expect the Treasury yields to remain in a broad sideways range for some time. The German yields are witnessing their corrective rise in line with our expectation. There is room for further rise before the broader downtrend resumes. The 10Yr and 5Yr GoI have risen further and have room to move up more from here.
The US 2Yr (0.53%), 5Yr (1.25%), 10Yr (1.57%) and 30Yr (1.91%) have inched up further. As mentioned yesterday, the 10Yr can test 1.65% while above 1.5% and the 30Yr can rise to 2% and even 2.1% on a sustained rise above 1.9%. Broadly we are looking for a sideways range of 1.35%-1.65% on the 10Yr and 1.75%-2.1%/2.2% on the 30Yr.
The German 2Yr (-0.72%) and 10Yr (-0.24%) remains stable while the 5Yr (-0.52%) and 30Yr (0.07%) have moved up slightly. Our view of seeing a corrective rise to -0.2%/-0.1% on the 10Yr and 0.1% on the 30Yr remains intact. Thereafter a fresh fall can be seen to keep the broader downtrend intact.
The India 10Yr GoI (6.3675%) tested 6.37% as expected and can retest 6.4%-6.45% while it sustains above 6.35% now. On the weekly chart 6.3%-6.45% seems to be the possible range of trade for now.
The 5Yr GoI (5.7194%) has risen past 5.7% and can extend the rise to 5.74%-5.75% while it remains above 5.7%.
Eco Data 11/12/21
[php_everywhere instance="1"]
Global Inflation Watch – Highest US Wage Growth in More than 10 Years
Overview: Labour shortages persist pushing US wage inflation to the highest level in 10 years. Commodity prices eased over the past month, though, as gas, oil and coal prices are off the peaks. Bottlenecks continue to drive unusually long delivery times. Freight rates have stabilized at very high levels. We look for US core inflation to rise further and peaking somewhat above 5% in February 2022 before easing to around 2½% by end-2022. In the euro we expect core inflation to peak now.
Inflation expectations: Market-based inflation expectations have moved to new cycle highs in both US and Europe over the past month (although it has declined from the peak over the past week). Survey-based inflation expectations are also on the rise in both US and euro area (especially short-term expectations).
US: CPI inflation was once again higher than anticipated in October, now running at 6.2% y/y, the highest rate since December 1990. Price increases are becoming more broad-based and not only driven by surging energy and food prices. Survey-based short-term inflation expectations remain very high but long-term measures remain well-anchored for now. 10yr breakeven inflation expectations are once again above the 2004-07 average. Wage growth is increasing, most likely reflecting shortage of labour (not least within "leisure and hospitality" where wage growth is above 11% y/y).
Euro: HICP inflation rose to 4.1% in October, a new all-time high. Energy continues to be the main driver accounting for 2.3pp of the increase, due to higher natural gas and electricity prices. Although natural gas prices have declined some 40% from the peak, elevated energy price inflation is likely to stay with us in the coming months. As we enter 2022 and some of the inflation distortions will fade, it will be important to keep a close eye on wage developments, not least the big German bargaining rounds, see Research Euro Area - German wages: what to watch in 2022, 25 October.
China: Chinese PPI inflation rose to 10.7% in September, the highest rate in more than 25 years. CPI inflation is still well behaved at 0.7%.
Inflation Worries Weigh
Stock markets are pretty flat on Thursday, with Europe broadly lacking any real direction all week and the US battling inflation risks that are weighing on sentiment.
The US inflation data on Wednesday was a massive blow, there's no doubt about it. Combined with the jobs report on Friday and the employment cost index the week before, it paints a picture of an economy running hot and with widespread price pressures.
The Fed may ultimately prove to be correct in its judgment that pressures will ease naturally over time as they're broadly driven by temporary factors. But how long can they afford to stand by and watch inflation dramatically overshoot their target? Are they really that confident in their assessment? The pressure is intensifying.
The view in the markets is increasingly becoming that the Fed will be forced to act long before they have indicated. The central bank can't bury its head in the sand for much longer and may be forced to accept that earlier hikes will be necessary if higher pressures persist. The transitory narrative is starting to fall on deaf ears.
Central bank inaction on rate hikes has long been celebrated in equity markets, contributing to sky-high valuations that some have argued aren't sustainable. But that may be changing and inaction may come to weigh on sentiment in the coming months if central banks are forced to aggressively deal with higher, more prolonged, and widespread inflation.
UK GDP highlights difficulty for BoE
Unfortunately, policymakers are stuck between a rock and a hard place, as we are seeing clearly in the UK. The BoE has backed itself into a corner in many ways as it weighs up dealing with inflation early at the risk of choking off an already sluggish recovery fraught with strong headwinds, or supporting the economy and risk inflation becoming a greater problem next year.
The GDP data today is clear evidence of the challenges facing the central bank. Can it really justify raising interest rates at a time when quarterly growth fell to 1.3% in the third quarter? The country already finds itself behind most other major economies in making up lost growth since the pandemic - still 2.1% smaller than Q4 2019 - and expectations for the coming quarters aren't particularly promising. Higher taxes, energy bills and inflation, on top of the end of various support schemes, will hit household disposable income and be a drag on the economy.
Oil edges higher as OPEC revises down demand
OPEC pared back its demand forecasts for the final quarter of the year in its monthly report, with higher prices at least partly responsible for the change. Demand was revised down by 330,000 barrels per day to 99.49 million which means it will take an extra few months for it to get back to pre-pandemic levels.
The group also expects US shale to ramp up production more than previously as higher prices encourage further investment. Whether the acknowledgment of higher prices affecting economic activity and demand will encourage the group to increase output more at an upcoming meeting is another thing, especially with some struggling to meet output targets as it is.
Inflation hedge gold continues to rally
Gold is continuing to rally on Thursday, adding to gains the day before when it surged following the inflation report as traders sought out an old friend in the face of higher inflation. They also briefly sought out a new companion as it appeared the bitcoin hedge narrative was finally sticking, although only one held on.
Perhaps this is the clearest sign yet that traders are losing patience with, or faith in, the Fed as inflation hit a 31-year high. It's not often that gold rallies alongside yields and the dollar but markets are pushing for rate hikes and may be fearful of the Fed waiting too long to deliver.
Gold is back in early summer territory and the next test now falls around $1,870. It appears to be building momentum once more though so the real challenge is the region between $1,900 and $1,920, where it struggled six months ago. If the Fed can't get traders back on board, it could continue to build momentum.
Bitcoin the inflation hedge?
It may feel like there's plenty of momentum in bitcoin but it's having real problems fully capitalizing on it as it continues to dip in and out of record territory. The US inflation data was seized upon yesterday and drove prices back to new highs but it didn't last long and it ended the day down 5%. Not ideal for an inflation hedge. Bitcoin is certainly showing signs of exhaustion but it wouldn't be the first time it's done that before managing to dig deep and surge once again. And you wouldn't put it past it now.