Sample Category Title
US 100 Tests Demand Zone
The Nasdaq 100 suffers losses as high inflation dents risk appetite.
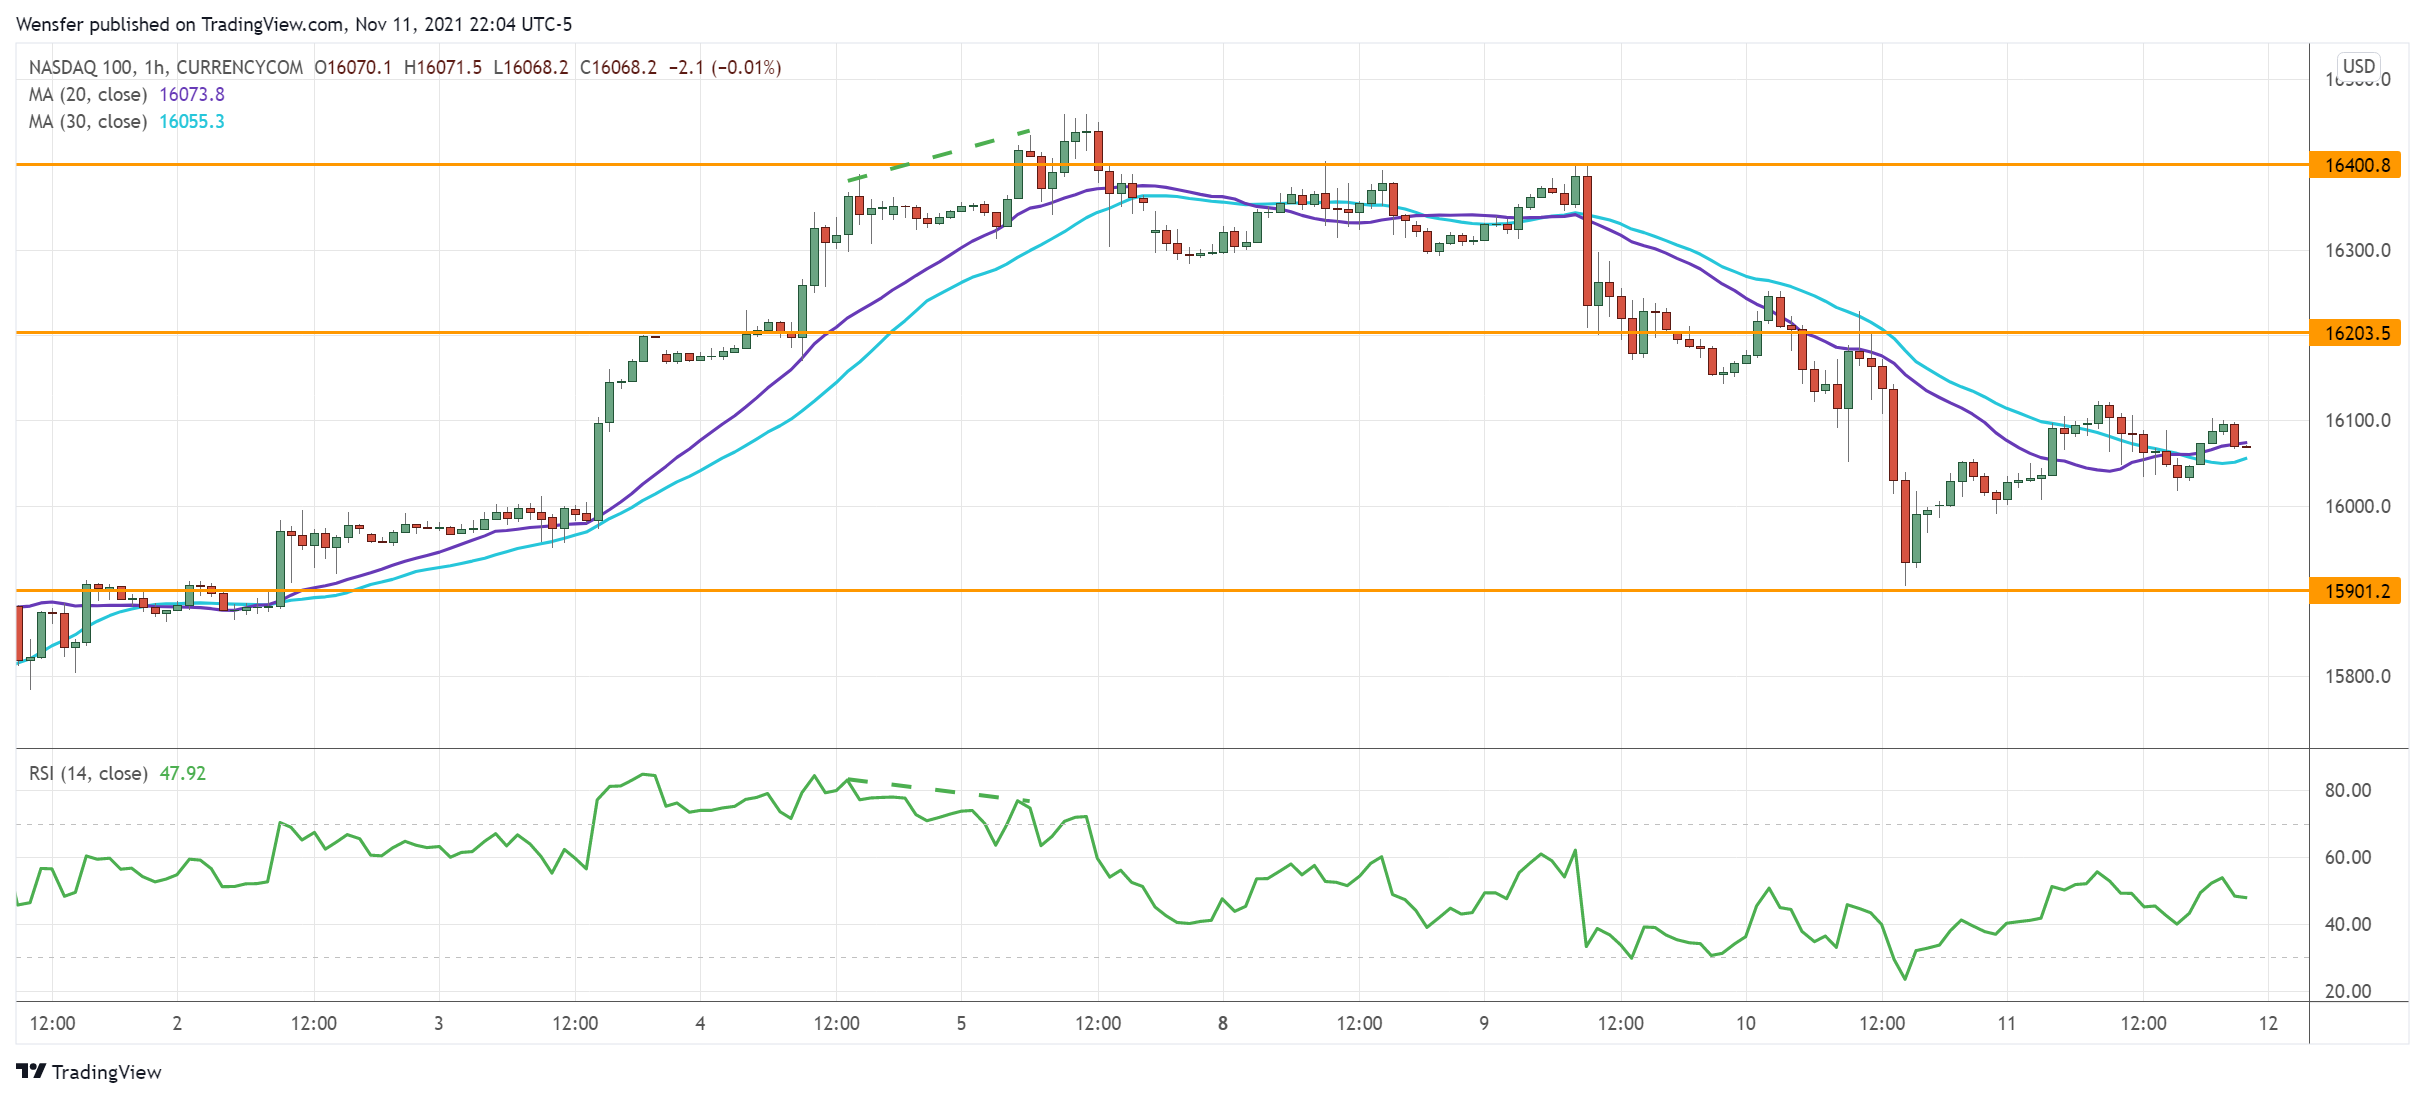
An RSI divergence showed a deceleration in the uptrend, a sign that the rally has overheated. Subsequently, a drop below 16200 has prompted leveraged buyers to exit for fear of a correction.
As the RSI inched into the oversold territory, the index saw bids near the breakout zone (15900) from earlier this month. The support-turned-resistance at 16200 is the first hurdle. Then the bulls will need to clear 16400 before the rally can resume.
AUD/USD Struggles For Support
The Australian dollar came under pressure after the unemployment rate returned above 5% last month.
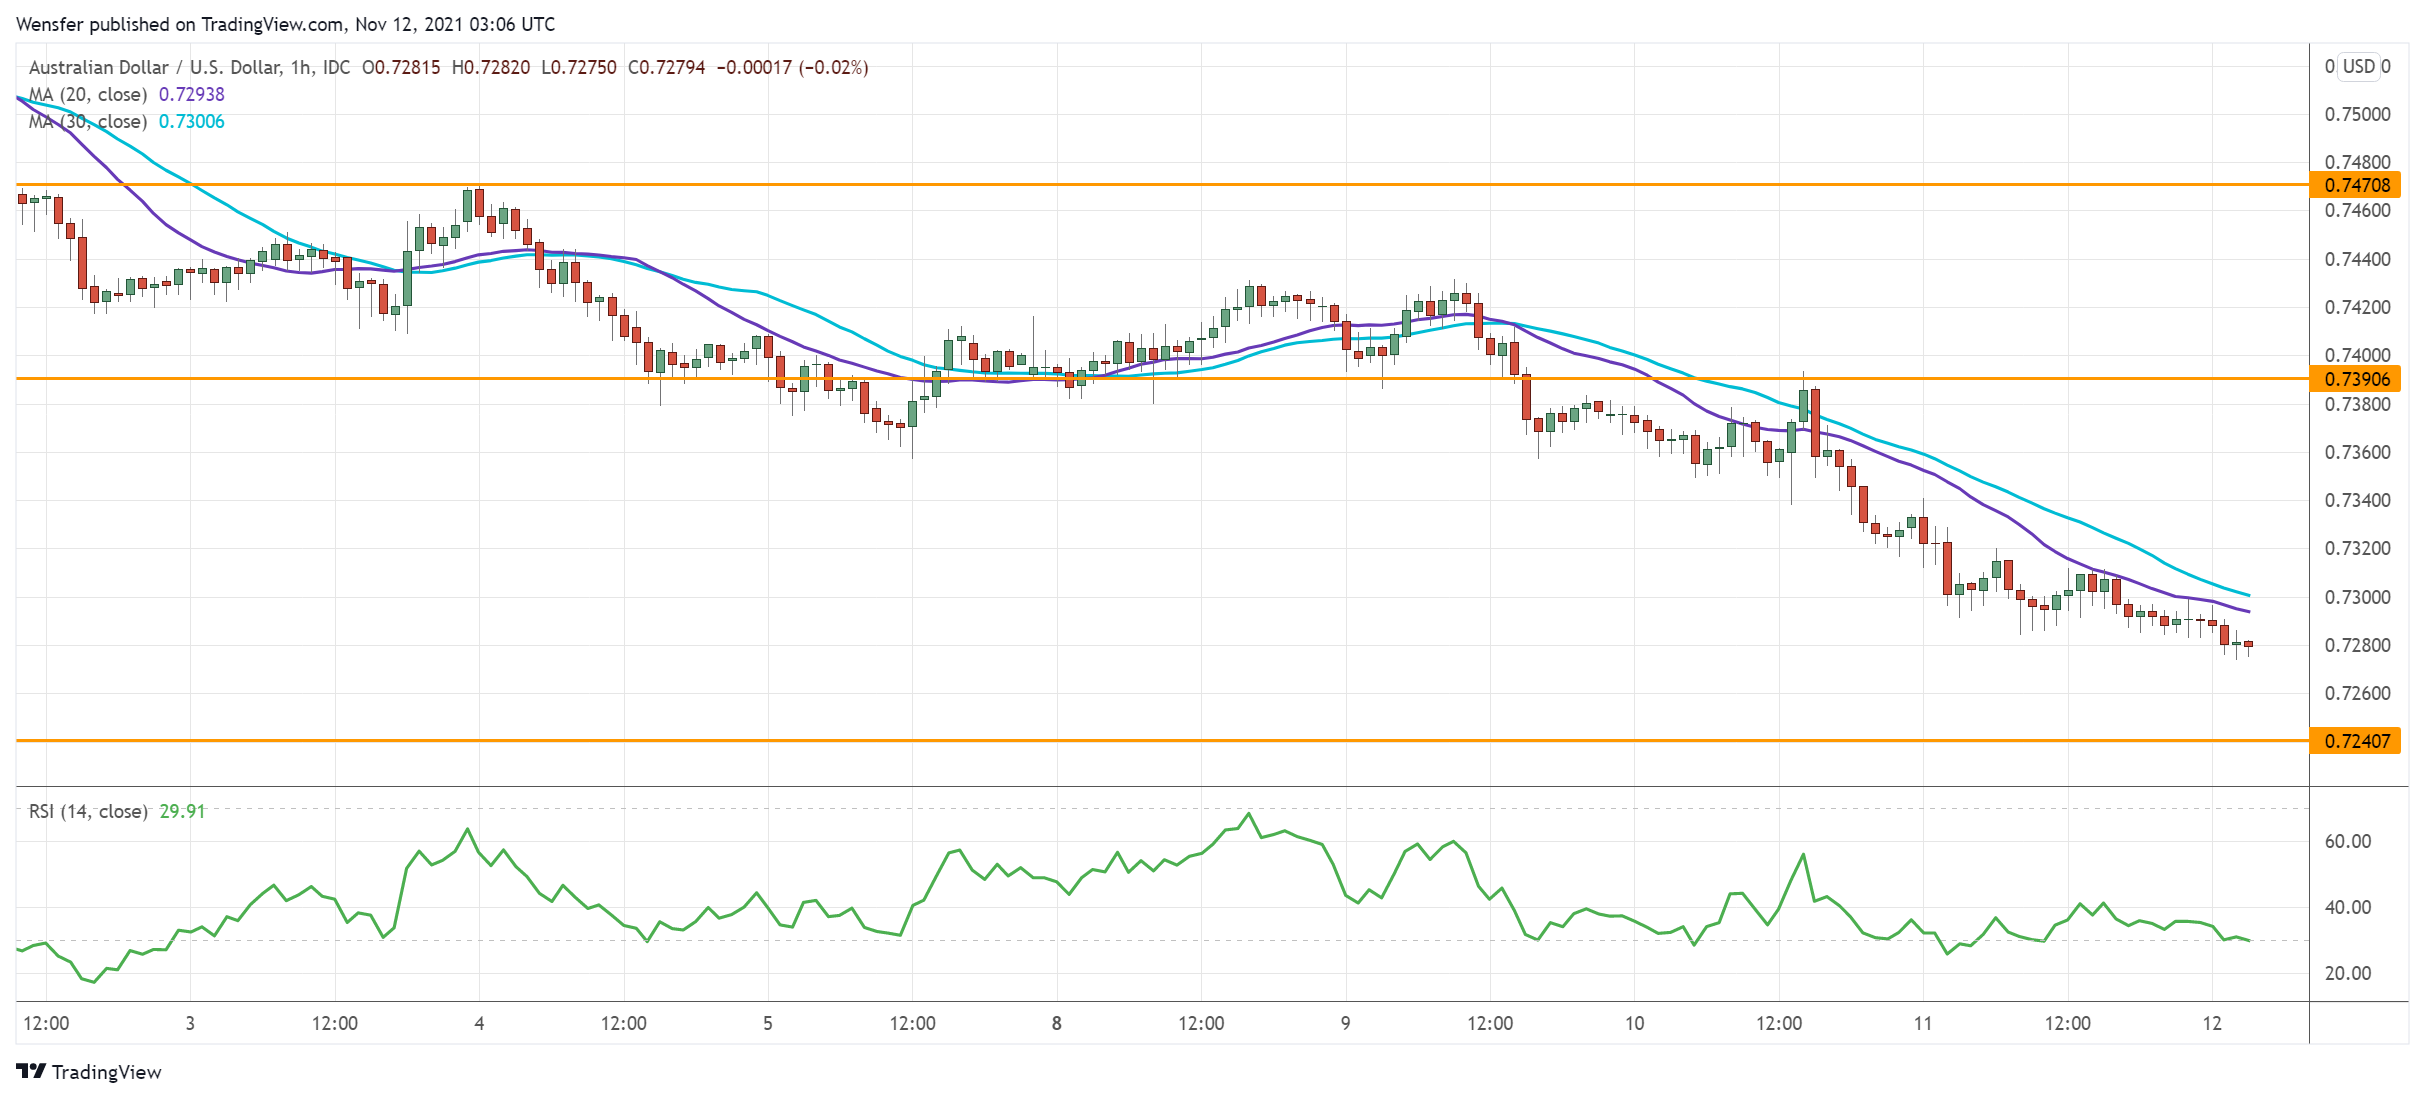
The sell-off continued after a brief pause over the 30-day moving average near 0.7390, turning the latter into a fresh resistance. The lack of support suggests increasingly downbeat sentiment.
The base of October’s bullish breakout at 0.7240 is the next support. The RSI’s oversold situation may cause a limited rebound from the round number at 0.7300, though it is likely to turn out to be a dead cat bounce.
GBP/USD Buried In Bearish Territory
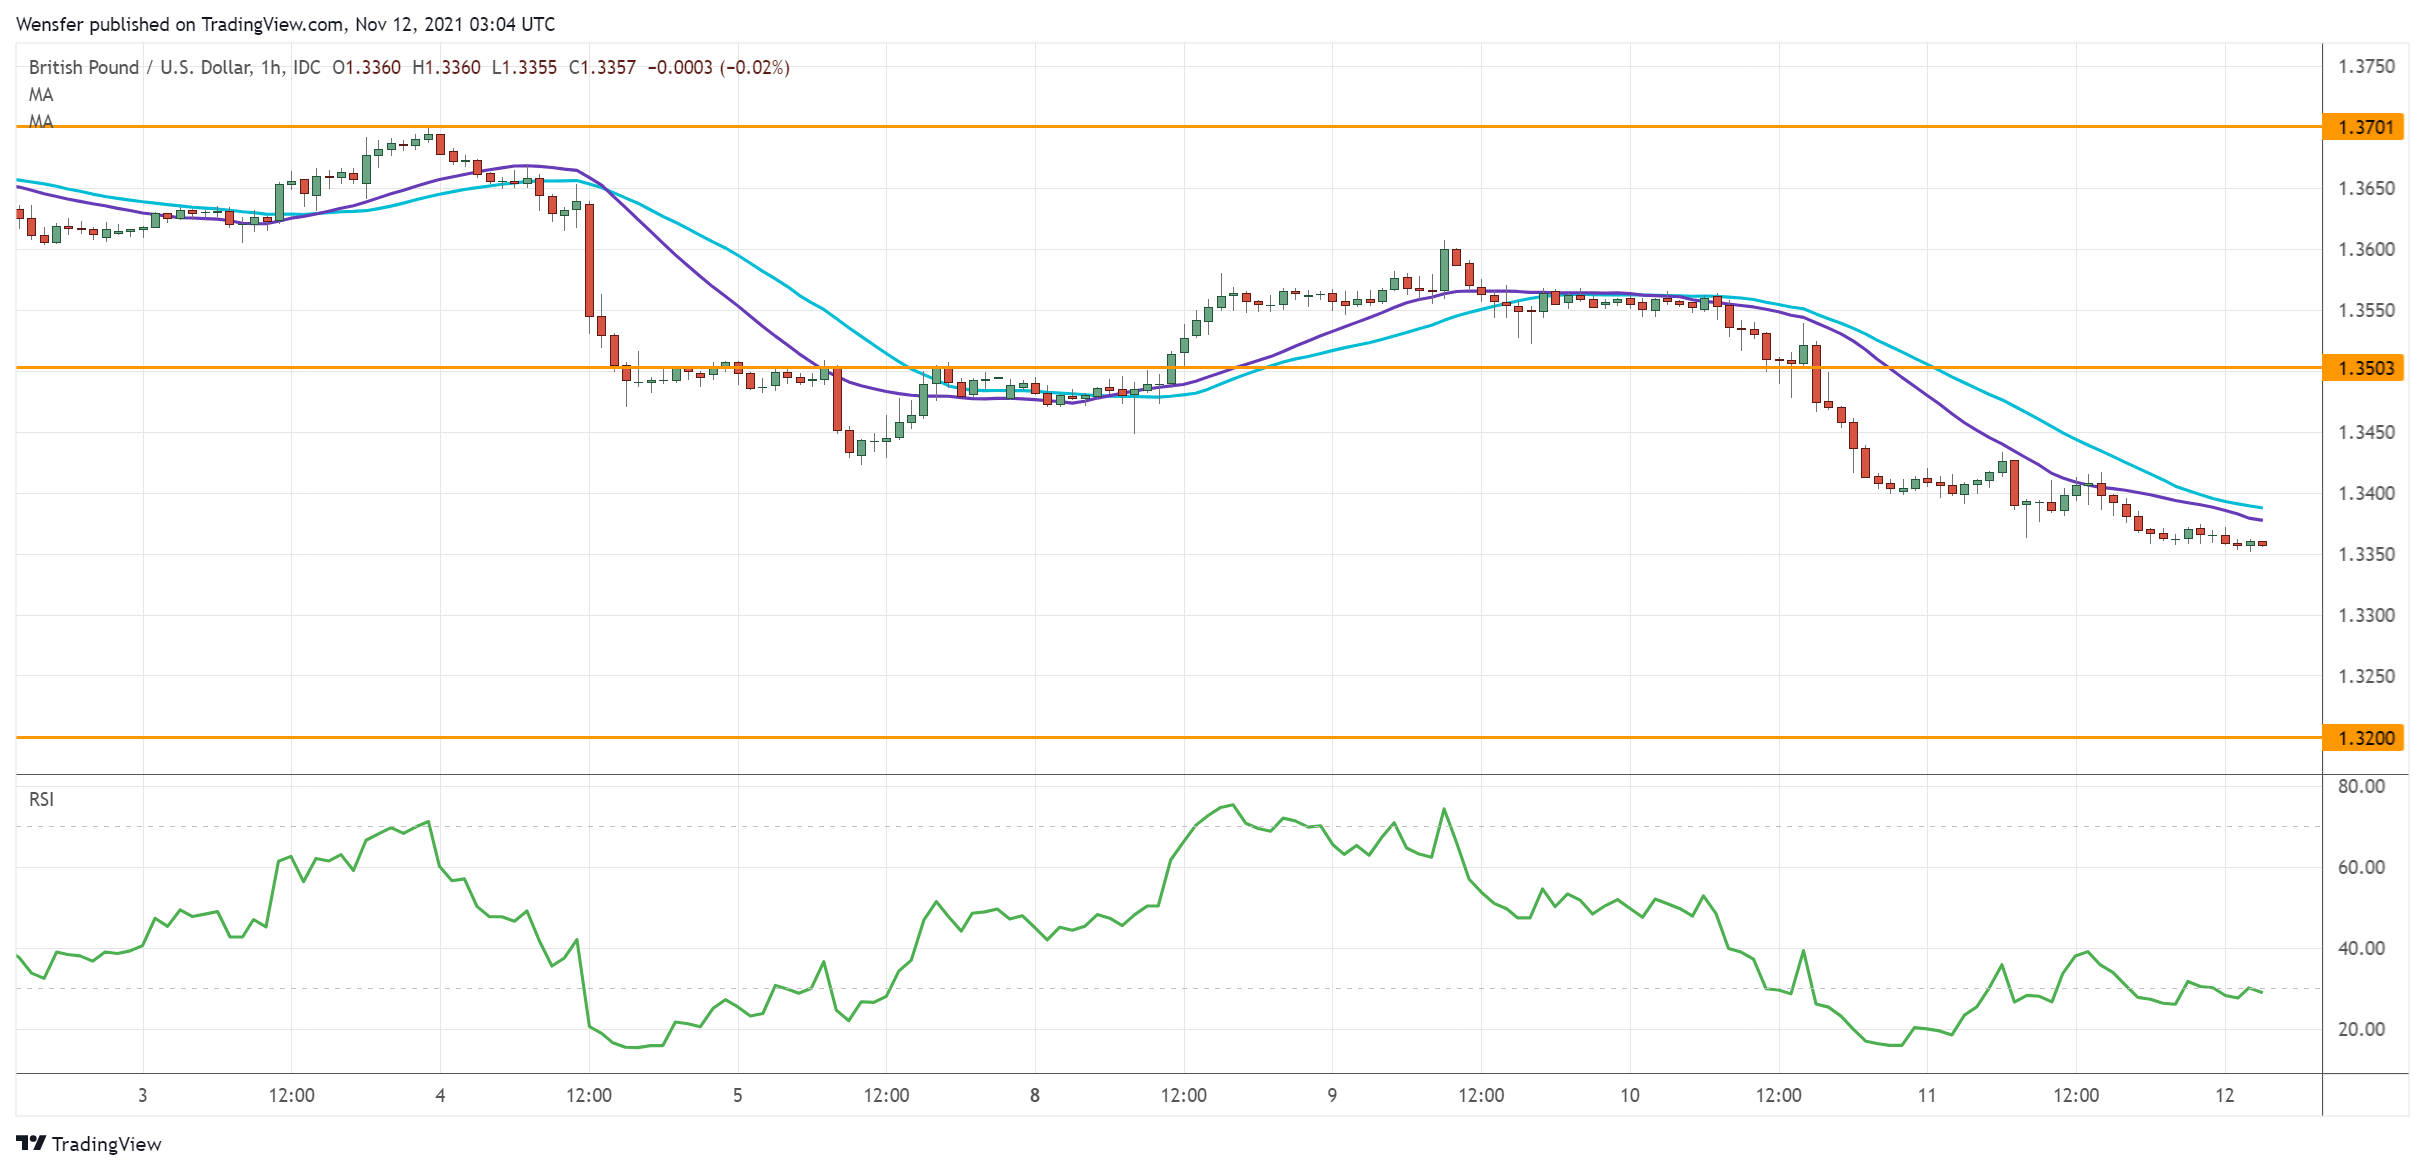
The pound continues to retreat after Britain’s growth fell short of expectations in Q3. A break below September’s low at 1.3420 has invalidated the latest rebound, putting buyers on the defensive once again.
The RSI’s double bottom in the oversold area may ease the bearish push momentarily. A bounce could be an opportunity to sell into strength.
1.3500 is the immediate resistance. On the downside, renewed momentum would drive price action towards last December’s lows around 1.3200.
The Analytical Overview Of The Main Currency Pairs
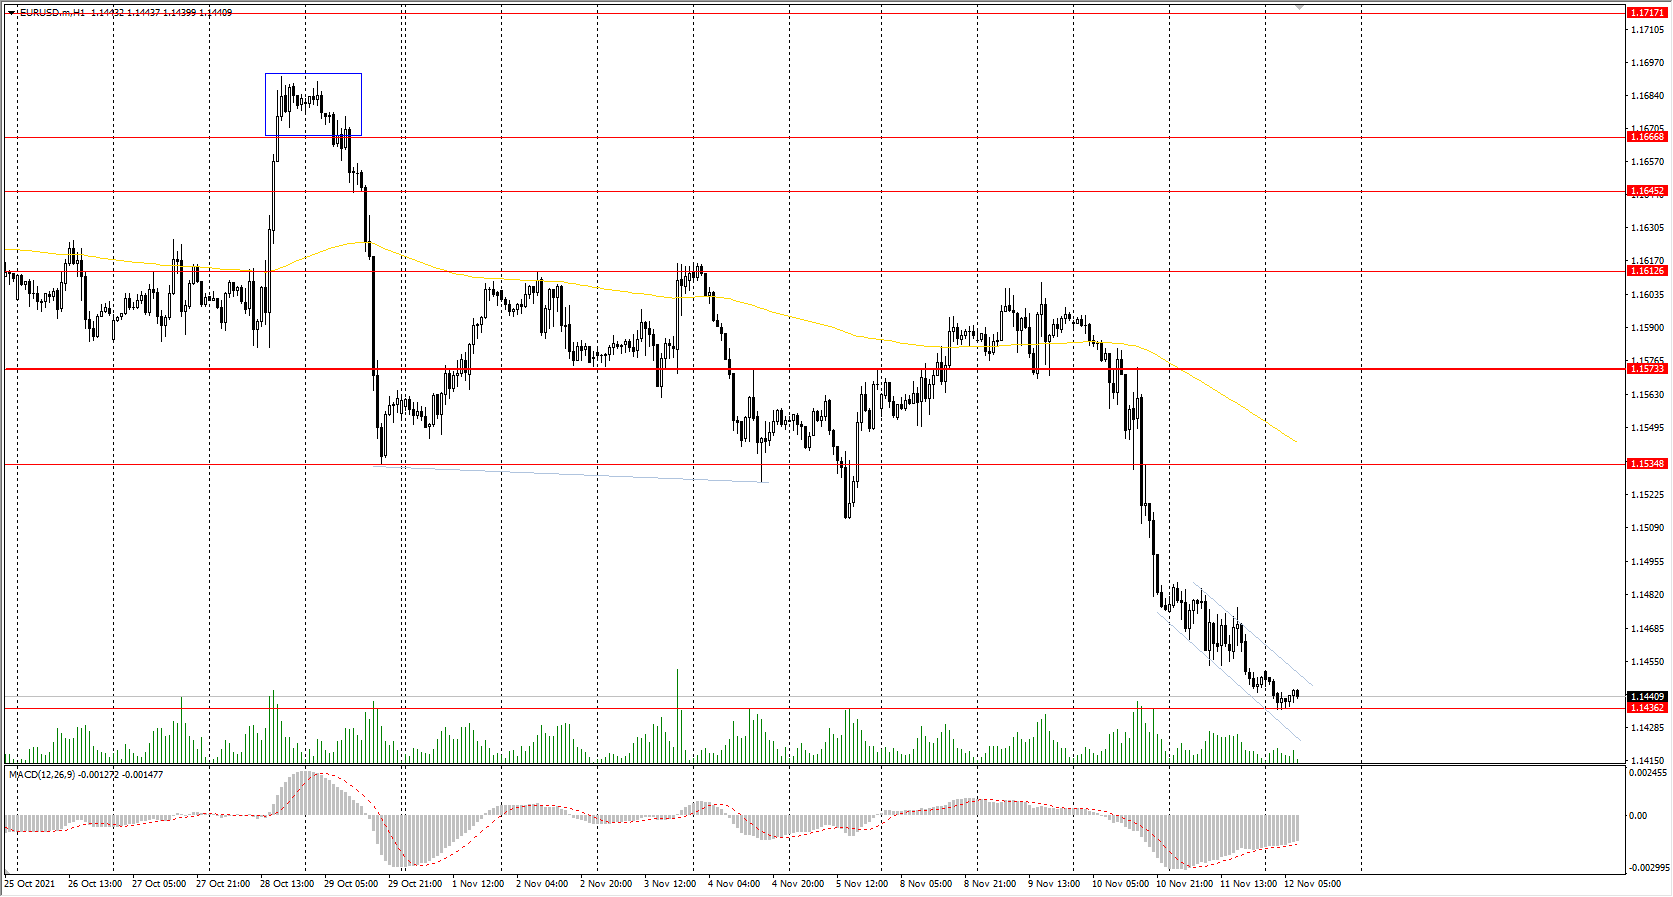
The EUR/USD currency pair
Technical indicators of the currency pair:
Prev Open: 1.1475
Prev Close: 1.1449
% chg. over the last day: -0.23%
Europe's GDP forecasts continue to fall as the economic recovery slows and the number of Covid cases reaches an all-time high. The German government's economic advisory group lowered its 2021 economic growth forecast to 2.7%. Eurozone inflation could exceed forecasts if supply chain disruptions persist.
Trading recommendations
Support levels: 1.1436
Resistance levels: 1.1535, 1.1573, 1.1613, 1.1645, 1.1667, 1.1717, 1.1772
From the technical point of view, the EUR/USD on the hour time frame is bearish. The MACD indicator has become negative, but there is a divergence on the higher time frames. Under such market conditions, traders should consider sell positions from the resistance levels near the moving average, as the price has deviated strongly from the averages. Buy trades should be considered only from the support levels of the higher time frame, given the buyer’s initiative.
Alternative scenario: if the price breaks out through the 1.1573 resistance level and fixes above, the mid-term uptrend will likely resume.
News feed for 2021.11.12:
- Eurozone Industrial Production (m/m) at 12:00 (GMT+2);
- US JOLTs Job Openings (m/m) at 17:00 (GMT+2);
- US Michigan Consumer Sentiment (m/m) at 17:00 (GMT+2);
- US FOMC Member Williams’s Speech at 19:10 (GMT+2).
The GBP/USD currency pair
Technical indicators of the currency pair:
Prev Open: 1.3403
Prev Close: 1.3365
% chg. over the last day: -0.28%
UK GDP growth for the quarter was only 1.3% (forecast 1.5%, previous 5.5%). Industrial production data also showed a decline in activity. All these factors indicate a clear slowdown in the economy.
Trading recommendations
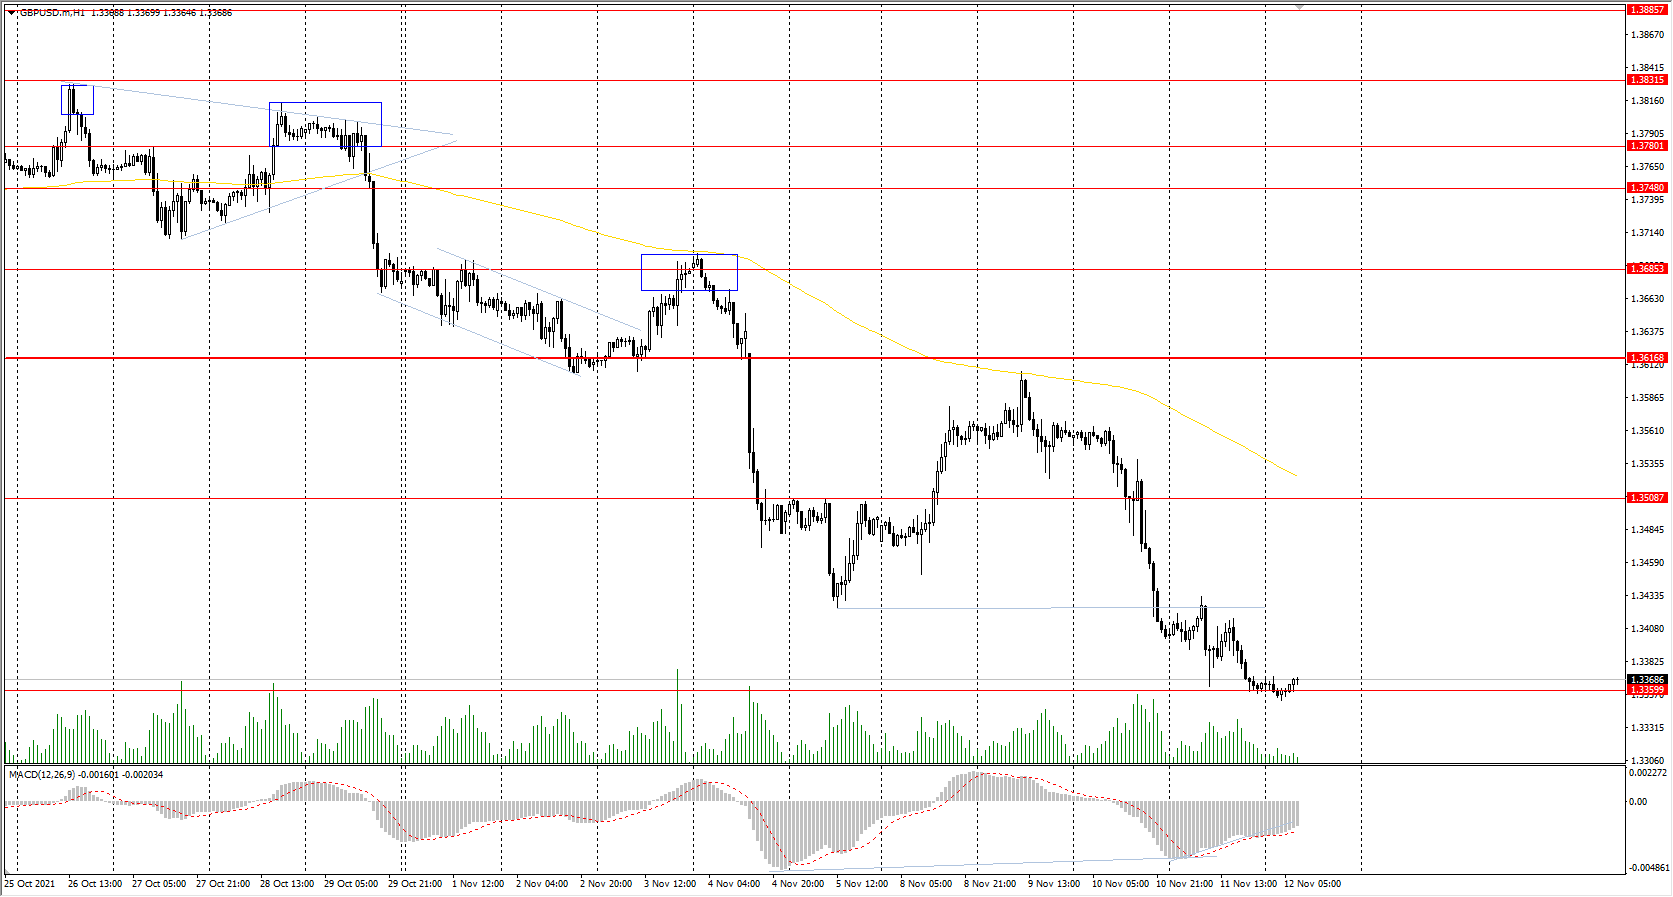
Support levels: 1.3360
Resistance levels: 1.3508, 1.3616, 1.3685, 1.3748, 1.3780, 1.3831, 1.3886
On the hourly time frame, the trend on GBP/USD is bearish. The MACD indicator has become negative, but there is a divergence on the higher time frames. Under such market conditions, traders should consider sell positions from the resistance levels near the moving average, as the price has deviated strongly from the averages. Buy trades should be considered only from the support levels of the higher time frame, given the buyer’s initiative.
Alternative scenario: if the price breaks out through the 1.3617 resistance level and consolidates above, the bullish scenario will likely resume.
The USD/JPY currency pair
Technical indicators of the currency pair:
Prev Open: 113.90
Prev Close: 114.06
% chg. over the last day: +0.14%
At the moment, there are no fundamental reasons for the USD/JPY quotes to go down in the mid-term, as the Bank of Japan has kept its monetary policy soft until the end of the year. At the same time, the Fed is already cutting QE and is likely to accelerate cuts due to a sharp rise in inflation. Also, Japan's new government will present a new tens of billions of dollars stimulus program in the coming days, which will eventually lead to a lower national exchange rate.
Trading recommendations
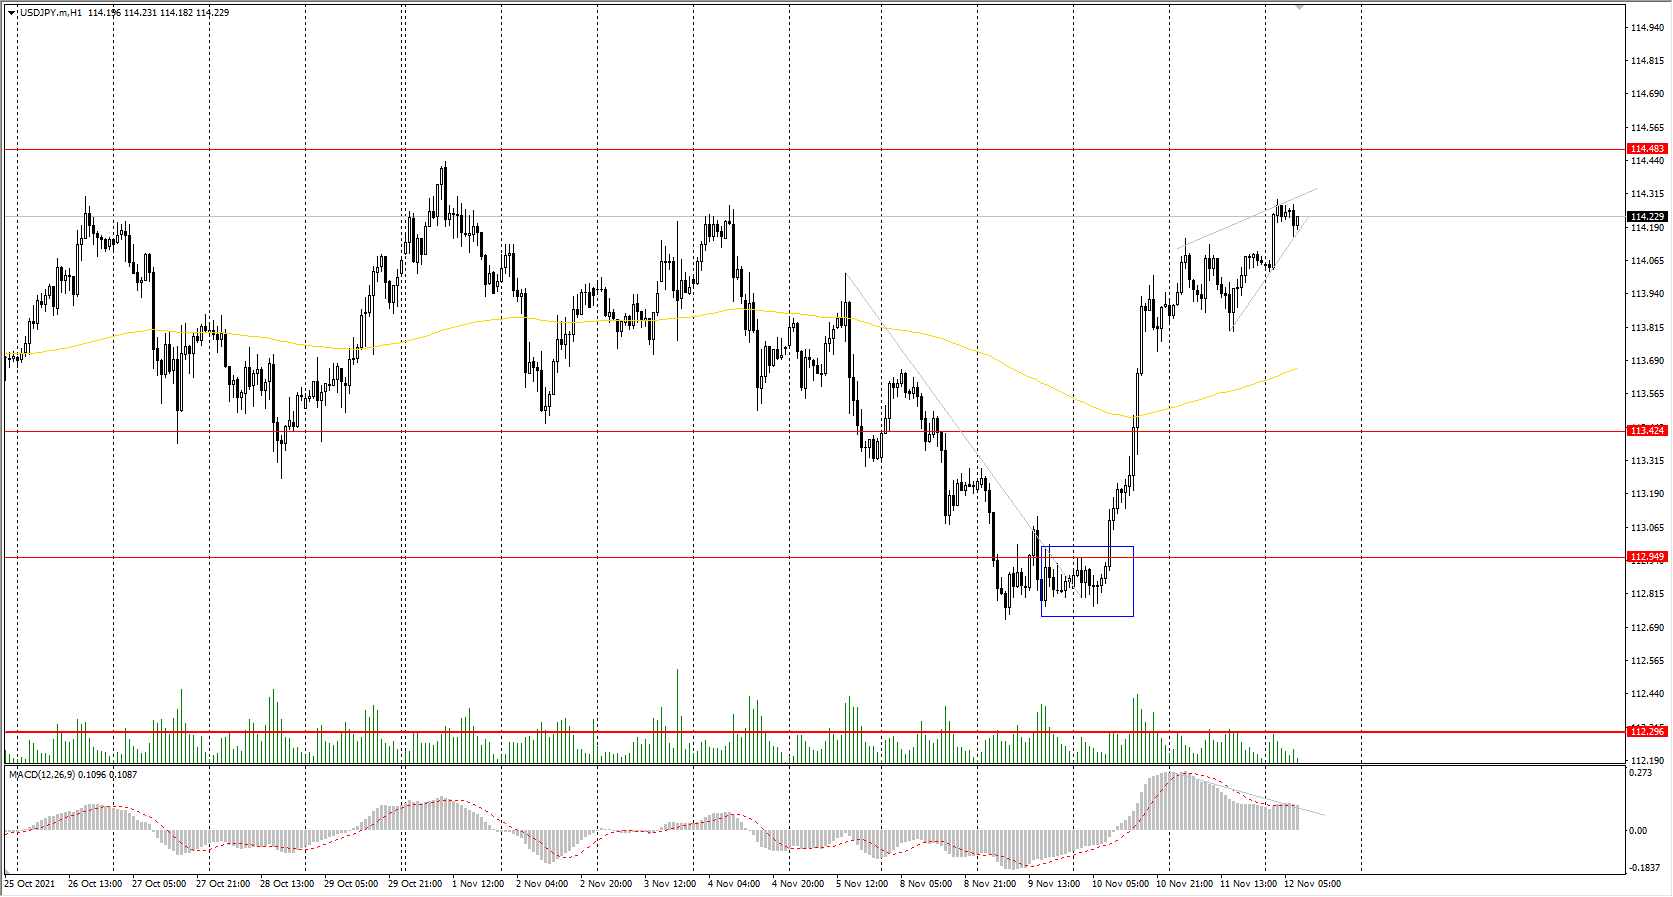
Support levels: 113.42, 112.95, 112.30, 111.53, 110.99, 110.65
Resistance levels: 114.48, 115.15
The global trend on the USD/JPY currency pair is bullish. The local trend has also changed to upward. But the MACD indicator shows a divergence, which suggests that a technical correction downwards should be expected soon. Under such market conditions, it’s better to look for buy positions from the buyers' initiative zone near the moving average. Sell positions should be considered from the resistance levels of higher time frames, given there is sellers' initiative, but only with short targets.
Alternative scenario: if the price falls below 112.30, the uptrend will likely be broken.
The USD/CAD currency pair
Technical indicators of the currency pair:
Prev Open: 1.2493
Prev Close: 1.2579
% chg. over the last day: +0.69%
The Canadian dollar is a commodity currency, so the USD/CAD currency pair highly depends on the dynamics of the dollar index and oil prices. Against the inflation growth in the USA, the dollar index is increasing, while oil quotes are decreasing. As a result, the USD/CAD are showing steady growth.
Trading recommendations
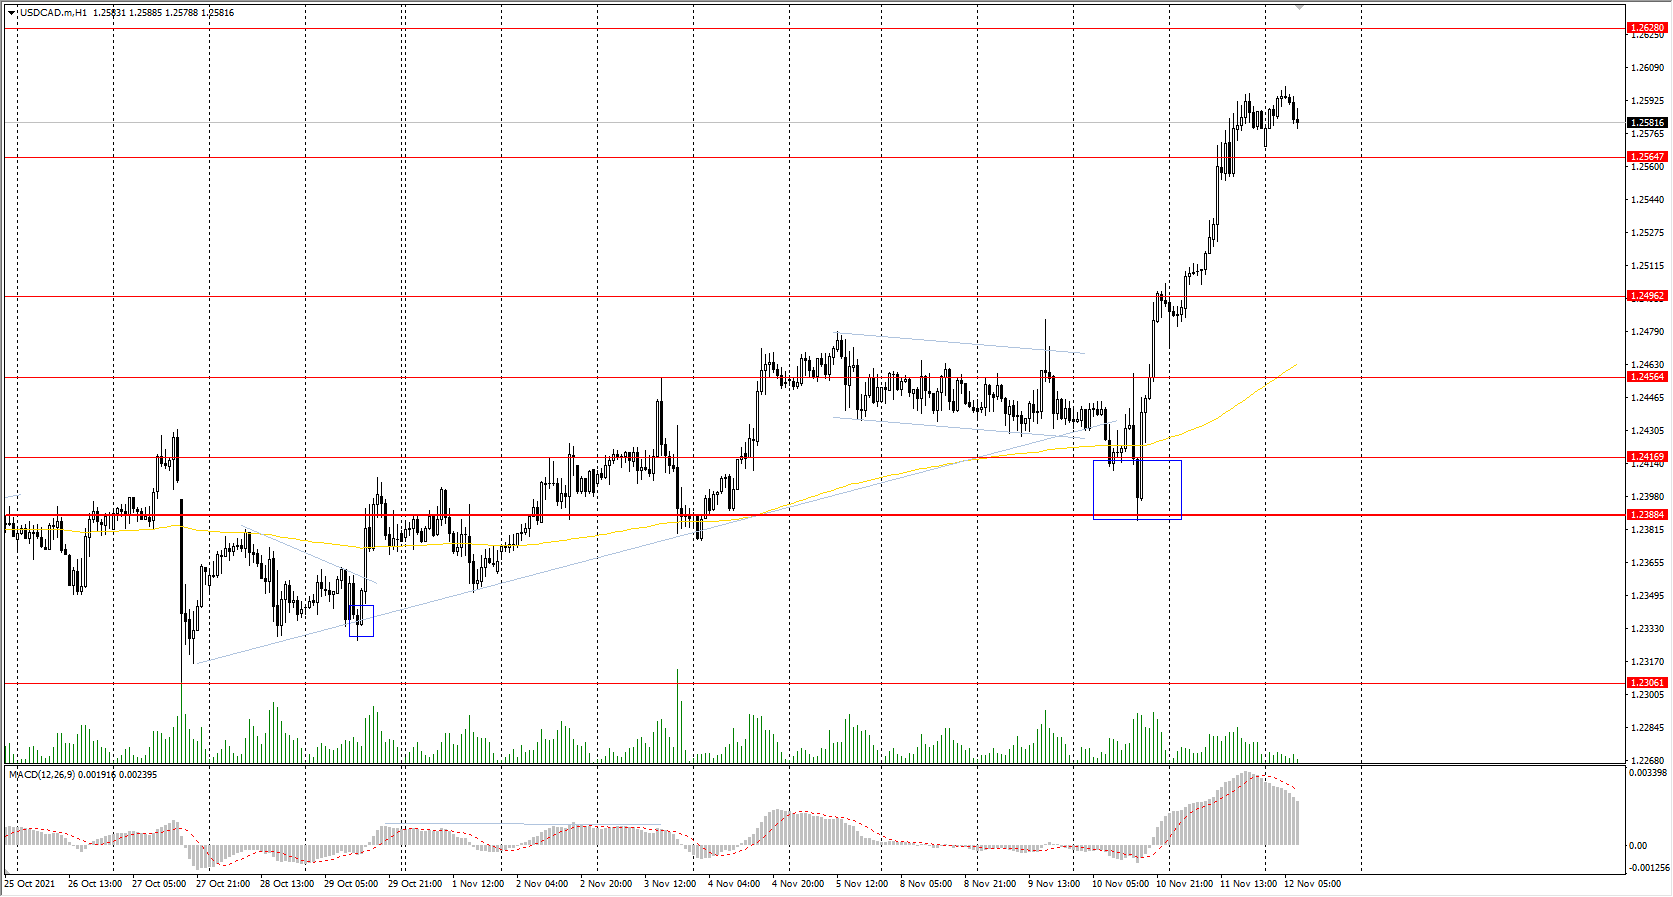
Support levels: 1.2564, 1.2496, 1.2456, 1.2417, 1.2388
Resistance levels: 1.2628, 1.2729, 1.2774
From a technical point of view, the trend of the USD/CAD currency is bullish. The MACD indicator is in the positive zone, but there are signs of overbought. Under such market conditions, it is better to look for buy trades from the support levels near the moving average, as the price has deviated strongly from its averages. Sell deals should be considered from the resistance levels of the higher time frame.
Alternative scenario: if the price breaks down through the 1.2388 support level and fixes below, the downtrend will likely resume.
Crude Oil Price Holds Steady As OPEC Downgrades Demand Estimates
US equities remained relatively calm on Thursday as investors continued to reflect on rising inflation and supply challenges. The Dow Jones declined by about 70 points while the S&P 500 and Nasdaq 100 indices rose marginally. Data published on Wednesday showed that America’s inflation jumped to the highest level since 1990. This trend was mostly because of the ongoing supply bottlenecks. Therefore, investors are generally worried about high-interest rates as the Federal Reserve attempts to tame runaway prices. Also, they are worried about the impact of these bottlenecks on earnings growth.
The price of crude oil held steady as investors reacted to the monthly report by OPEC. In the report, the cartel said that global demand will grow by about 5.7 million barrels a day this year. This was about 160,000 barrels lower than what it predicted last month. For the coming year, the cartel said that demand will be about 96.4 million barrels per day. OPEC reduced its outlook for oil demand saying that higher prices will likely cramp demand in some of the biggest economies like China and India. In the past few weeks, the Biden administration hinted that it will release oil in the strategic reserves.
The economic calendar will have minimal events today. In Switzerland, the statistics agency will publish the latest producer price index (PPI) data. Like in most countries, analysts expect that these numbers rose sharply in October. Elsewhere in Europe, Spain will publish the latest consumer inflation data while Eurostat will publish the latest industrial production numbers. In the United States, the government will release the latest job openings numbers.
EURUSD
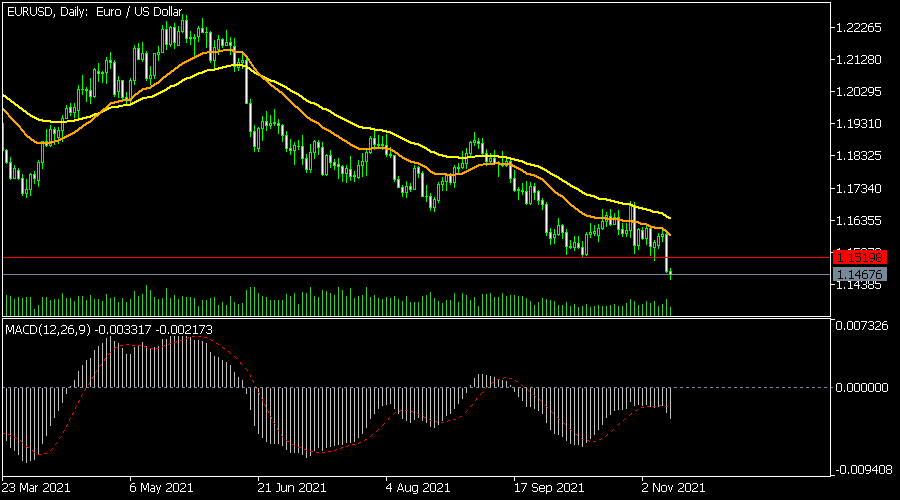
The EURUSD pair declined to the lowest level since July last year as worries of inflation rose. The pair is trading at 1.1470, which is significantly below the year-to-date high of 1.2353. It has also moved below the important support at 1.1520, which was the lowest level on October 13th. The pair has also dropped below the 25-day and 50-day moving averages and the 50% Fibonacci retracement level. Therefore, the pair will likely keep falling today.
USDCHF
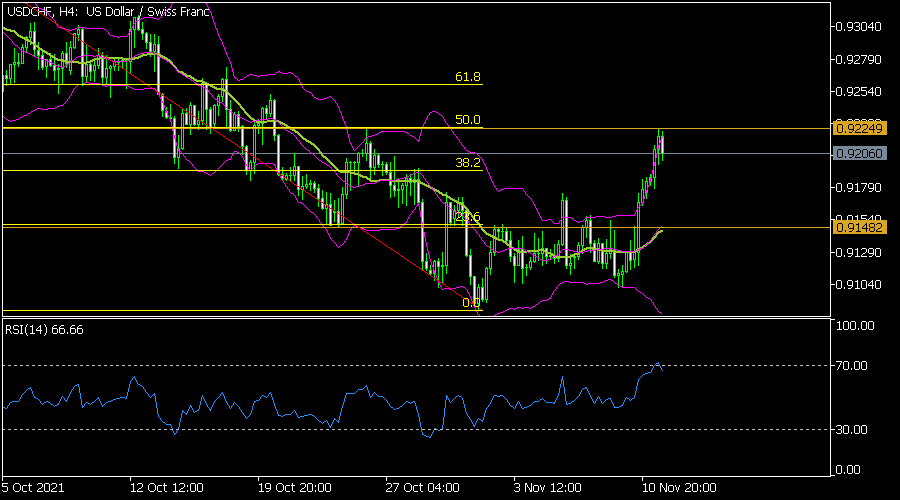
The USDCHF pair rose to a high of 0.9225 as the US dollar made a comeback. On the four-hour chart, the pair is along the upper side of the Bollinger Bands while the Relative Strength Index (RSI) has moved above the overbought level. It has moved between the 50% and 38.2% Fibonacci retracement levels. Therefore, the pair will likely keep rising as bulls target the key resistance at 0.9300.
USDCAD
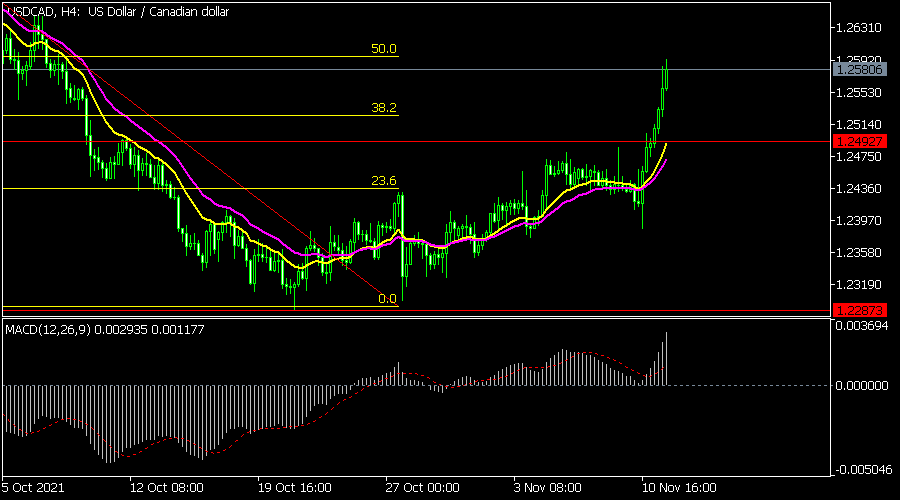
The USDCAD pair rose to the highest level since October 8 this year because of the stronger US dollar. The pair extended gains above the neckline of the inverted head and shoulders pattern. The MACD has also moved to the highest level since September this year. The pair has also risen to the 50% Fibonacci retracement level. Therefore, the pair will likely keep rising in the near term.
Daily Technical Analysis
EUR/USD
Current level - 1.1435
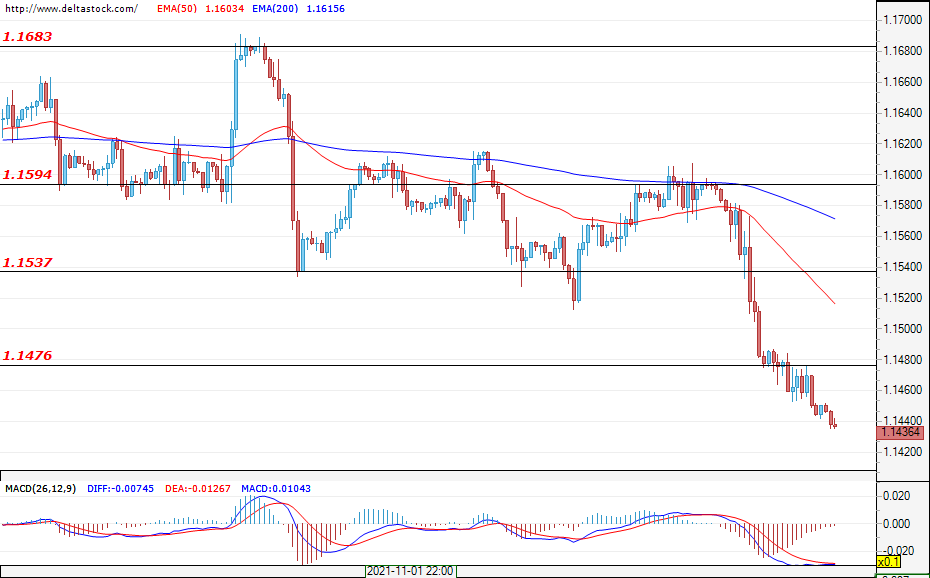
The Greenback continues to appreciate against most major currencies. Over the past session, the pair managed to form a resistance at 1.1476 and the expectations for continued declines remain unchanged. The pair is approaching the 1.1410 support coming from the higher time frames. It is possible that the market will consolidate around this area. In the event of a breach, a test of the following zones at around 1.1300 and 1.1180 can be expected. Deeper pullbacks are not ruled out due to increased volatility, but they should be limited by the resistance at around 1.1594. Until this area is violated, prices should be under the bears’ control. No significant events in the economic calendar are expected today.
| Resistance | Support | ||
| intraday | intraweek | intraday | intraweek |
| 1.1476 | 1.1600 | 1.1410 | 1.1300 |
| 1.1537 | 1.1680 | 1.1370 | 1.1180 |
USD/JPY
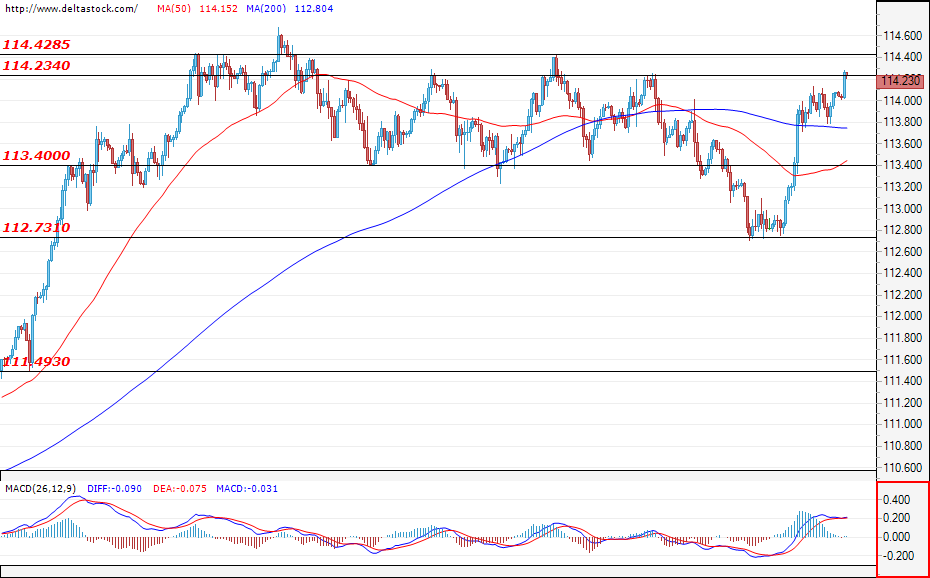
Current level - 114.23
The pair returned to its range after experiencing an increased demand for the U.S. dollar at around 112.73. The breach of 113.40 can be considered as fake and, if the zone of 114.42 is not violated, the market is expected to continue trading in the range of 113.40 - 114.42. In the event the resistance is breached, a new impulse can be expected targeting 115.50 and even 117.00.
| Resistance | Support | ||
| intraday | intraweek | intraday | intraweek |
| 114.20 | 115.50 | 113.40 | 111.50 |
| 114.40 | 117.00 | 112.73 | 111.00 |
GBP/USD
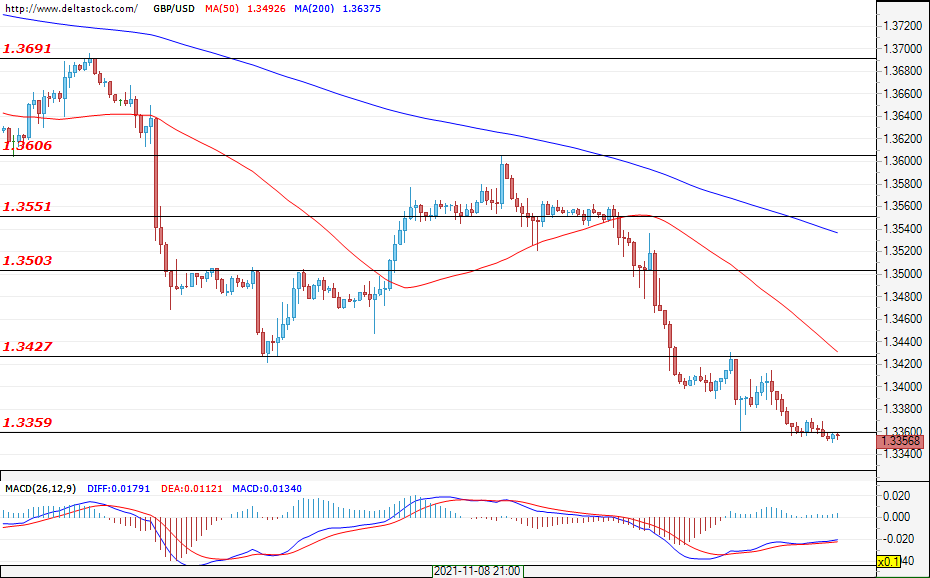
Current level - 1.3356
The Cable is in a clear downtrend and, in the early hours of today, prices gravitate around the local support of 1.3360. Due to the shrinking activity, a corrective wave with a target of around 1.3500 can be expected. The first daily resistance for the pair is 1.3427. The current expectations are for new declines and a breach of 1.3360 would pave the road towards 1.3200. A change in sentiment can only be expected if prices stay above 1.3550.
| Resistance | Support | ||
| intraday | intraweek | intraday | intraweek |
| 1.3427 | 1.3600 | 1.3360 | 1.3200 |
| 1.3550 | 1.3690 | 1.3290 | 1.3200 |
GBP/JPY Daily Outlook
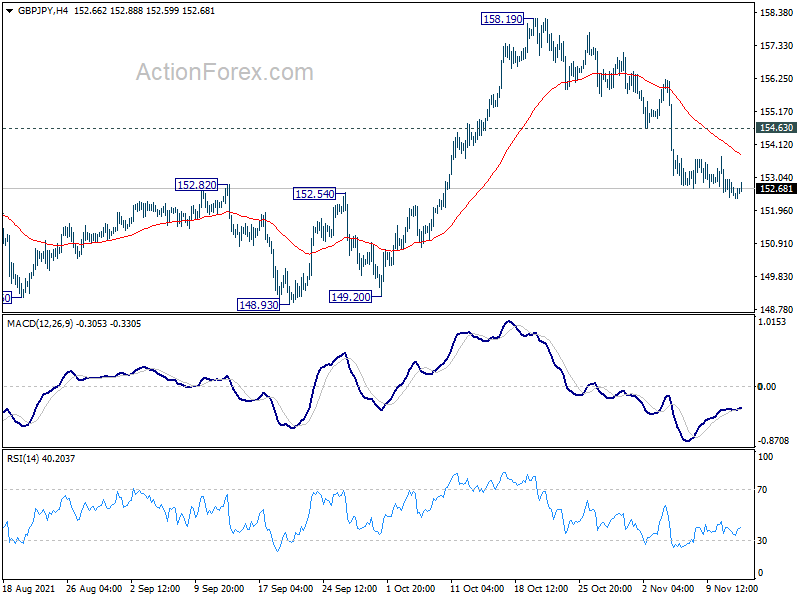
Daily Pivots: (S1) 152.25; (P) 153.00; (R1) 153.41; More...
GBP/JPY's fall from 158.19 is still in progress and deeper decline would be seen to 148.93 structural support level. On the upside, break of 154.63 minor resistance will revive near term bullishness and turn bias back to the upside for 158.19 high.
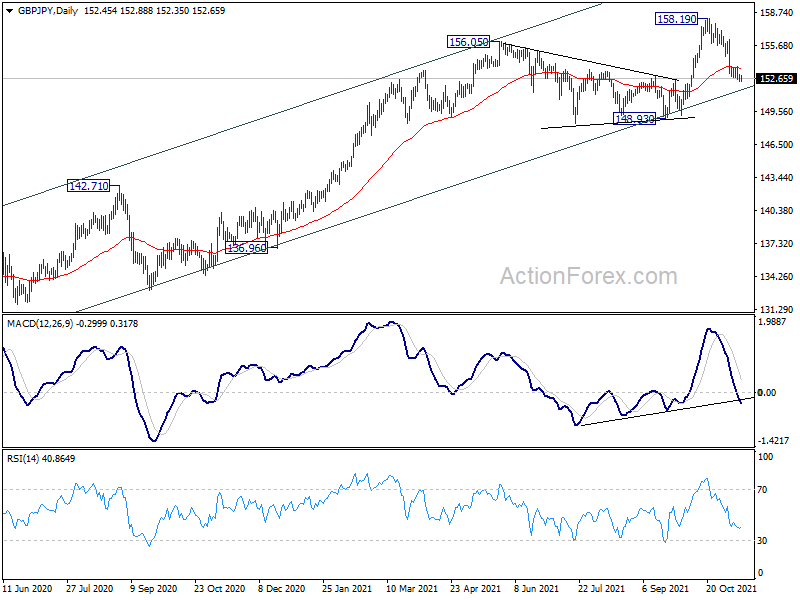
In the bigger picture, rise from 123.94 is seen as the third leg of the pattern from 122.75 (2016 low). The stay above 55 week EMA affirms medium term bullishness. Current rise should now target 61.8% retracement 195.86 (2015 high) to 122.75 at 167.93 next. In any case, outlook will remain bullish as long as 148.93 structural support hold, even in case of deep pull back.
EUR/JPY Daily Outlook
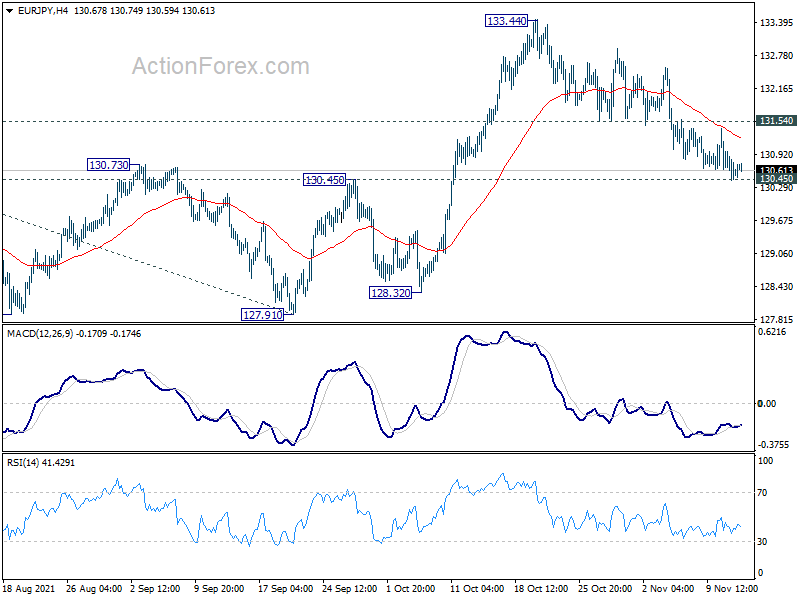
Daily Pivots: (S1) 130.35; (P) 130.68; (R1) 130.91; More....
Intraday bias n EUR/JPY remains neutral first. On the upside, break of 131.54 minor resistance will suggest that pull back from 133.44 has completed. Intraday bias will be turned back to the upside for retesting 133.44 first. However, firm break of 130.45 will dampen our bullish view and bring deeper fall back to 127.91 key support.
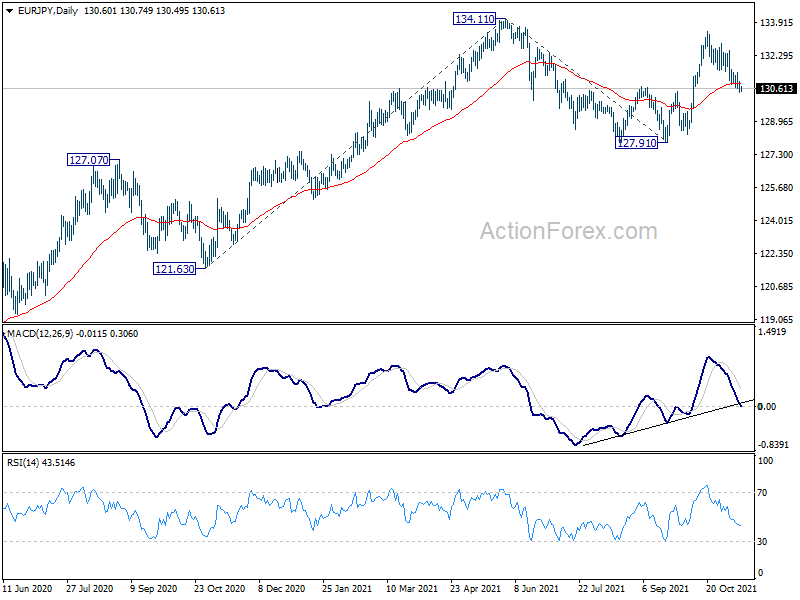
In the bigger picture, rise from 114.42 (2020 low) is still in progress and the strong support support from 55 week EMA affirms medium term bullishness. Further rise would be seen to retest 137.49 (2018 high). Decisive break there will resume the whole long term rise from 109.03 (2016 low). Next target will be 100% projection of 109.03 to 137.49 from 114.42 at 142.88. This will now remain the favored case as long as 127.91 support holds.
EUR/GBP Daily Outlook
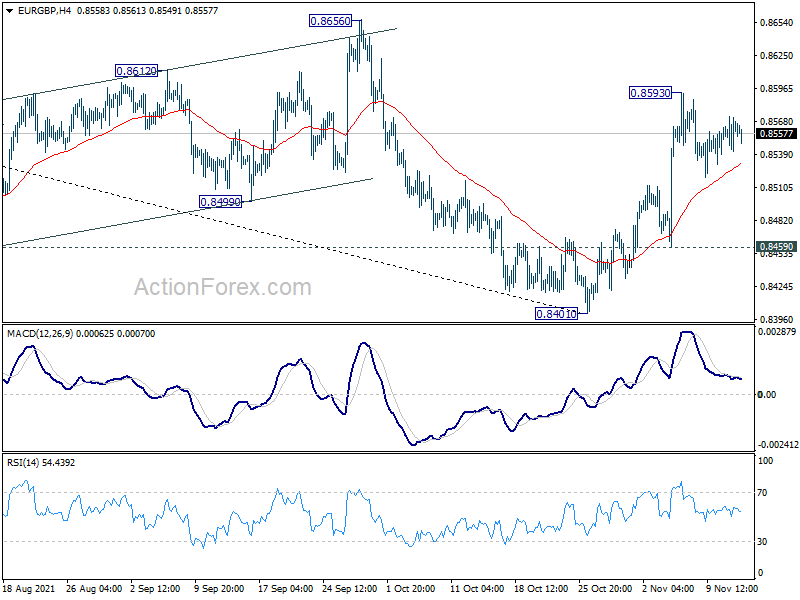
Daily Pivots: (S1) 0.8547; (P) 0.8561; (R1) 0.8578; More...
Intraday bias in EUR/GBP remains neutral at this point. On the upside, above 0.8593 will target 0.8656 resistance. Firm break there will argue that whole down trend from 0.9499 has completed. Stronger rise would be seen to 38.2% retracement of 0.9499 to 0.8401 at 0.8820. On the downside, break of 0.8459 minor support will bring retest of 0.8401 low instead.
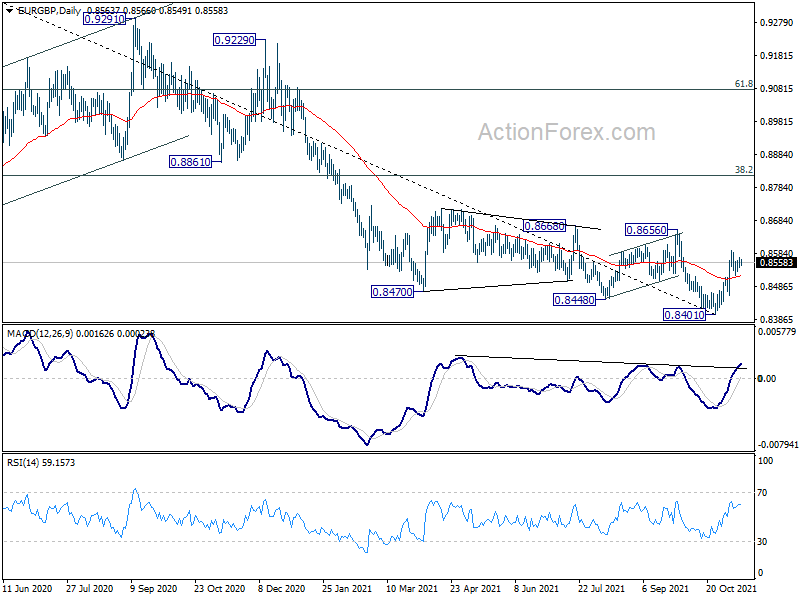
In the bigger picture, price actions from 0.9499 (2020 high) are still seen as developing into a corrective pattern. Deeper fall could be seen as long as 0.8656 resistance holds, towards long term support at 0.8276. However, firm break of 0.8656 resistance would argue that a medium term bottom was already formed. Stronger rise would be seen to 0.8861 support turned resistance to confirm completion of the corrective pattern.
EUR/AUD Daily Outlook
Daily Pivots: (S1) 1.5657; (P) 1.5696; (R1) 1.5745; More...
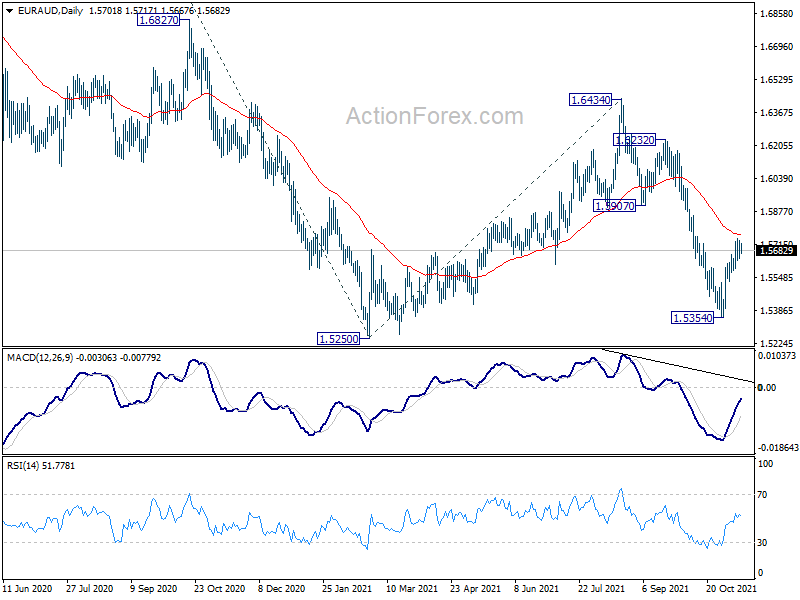
Further rise is still mildly in favor with 1.5585 minor support intact, despite loss of upside momentum. Sustained break of 55 day EMA (now at 1.5758) will argue that whole fall from 1.6434 has completed and bring stronger rally. On the downside, however, below 1.5585 minor support will turn bias back to the downside for 1.5354. Break there will target a test on 1.5250 low.
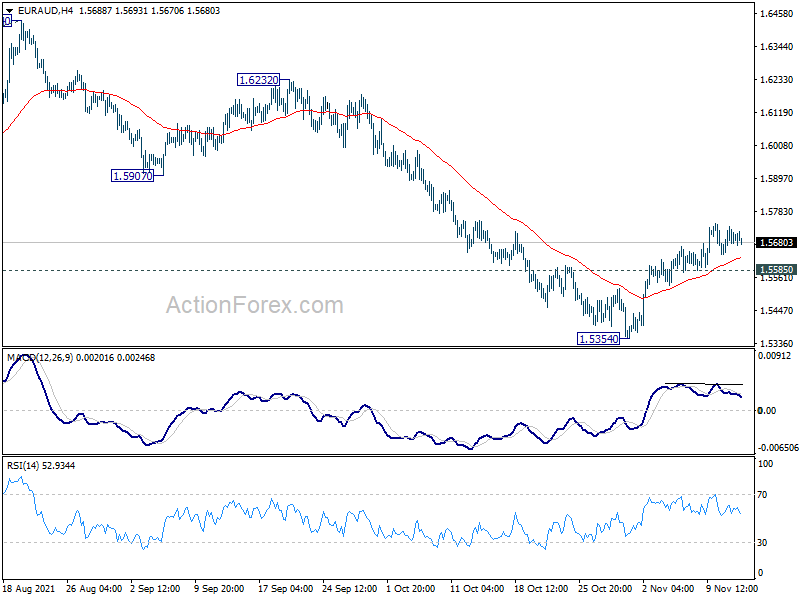
In the bigger picture, the down trend from 1.9799 (2020 high) is in progress. Firm break of 1.5250 low will confirm resumption and target 61.8% retracement of 1.1602 (2012 low) to 1.9799 at 1.4733. Sustained break there could bring more downside acceleration to 61.8% projection of 1.9799 to 1.5250 from 1.6434 at 1.3623. In any case, break of 1.6434 resistance is needed to signal medium term bottoming, or outlook will stay bearish.