Sample Category Title
Inflation In The United States Reached A Record Over The Past 30 Years
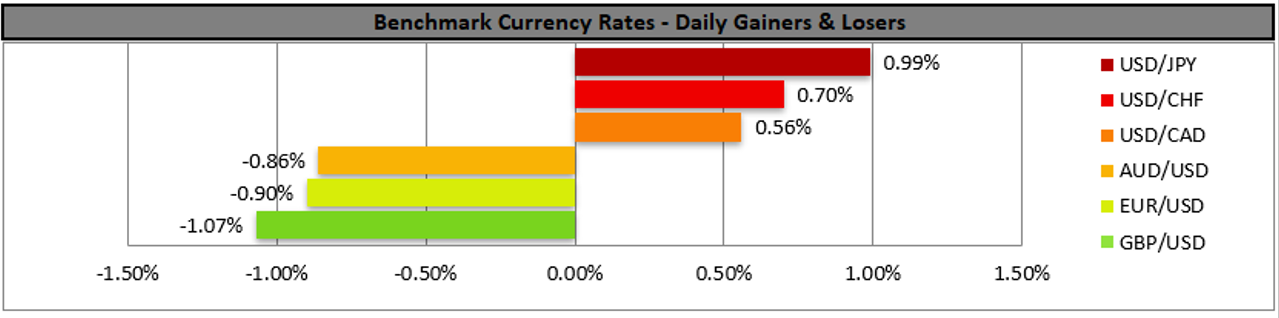
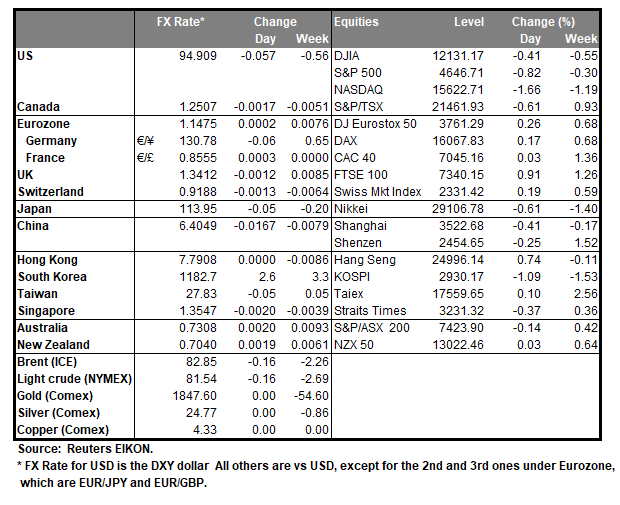
The US consumer price index increased by 0.9% to 6.2% (previous 5.4%) in annual terms, it’s well above analysts' forecasts. And this has been the highest rate of inflation since 1990. With such a sharp rise in inflation, investors began actively rebalancing portfolios into US dollars, anticipating a rate hike soon. As a result, major US stock indices fell yesterday. By the end of the day, the Dow Jones Industrial Average decreased by 0.66%, the S&P 500 decreased by 0.82%, and the Nasdaq lost 1.66%.
The biggest increases in consumer prices were for electricity (30% vs. 24.8% in September) and gasoline (49.6%). Inflation also rose for new houses (3.5% vs. 3.2%); food (5.3% vs. 4.6%, the highest rate since January 2009); new vehicles (9.8% vs. 8.7%); clothing (4.3% vs. 3.4%), and medical services (1.7% vs. 0.9%).
In his last speech, US President Joe Biden said that reducing inflation was one of his policy priorities. Now, for Biden to keep his words, the US Federal Reserve needs to accelerate cuts in the QE program and raise interest rates.
According to the US Department of Labor, the number of new jobless claims in the USA reached 267,000, while analysts expected 260,000. This was the lowest number since March 2020.
European stock indices were mostly growing yesterday. German DAX added 0.2%, British FTSE 100 increased by 0.9%, French CAC 40 added 0.03%, Spanish IBEX and Italian FTSE MIB increased by 0.7% and 0.4%, respectively. Germany's consumer price index increased by 0.5% to 4.6% level in annual terms. In the last month, energy prices in Germany rose by 18.6% in annual terms, food prices increased by 4.4%, and services prices increased by 2.4%.
Amid a surge in inflation, the US bond yields sharply increased yesterday. But surprisingly, gold prices also rose, though government bond yields usually have an inverse correlation with gold. Investors initially bought gold because Fed spokesman Clarida said Monday that the Federal Reserve has no plans to raise rates next year. But yesterday's inflation data will likely change the Fed's view.
Natural gas inventories showed an increase of 7 billion cubic meters (bcm) against an expected 10 bcm. European natural gas prices fell to their lowest level in more than a week as Russia is gradually increasing supply.
Crude oil inventories were 1 mln barrels compared to an expected 1.68 mln barrels. Despite the deficit, oil prices sharply decreased amid a sharp rise in inflation in the US yesterday.
Asian stock indices are trading flat today. Japan's Nikkei 225 index has already gained 0.6% after the market opening. Japan's stock market is rising on expectations that the country's new Prime Minister Fumio Kishida will present a new economic stimulus package in the coming days. The weakening of the national currency also supports the market.
Chinese real estate developer Evergrande has officially declared bankruptcy. Evergrande needs to pay about $7.4 billion in bonds maturing next year. But Chinese indices reacted quietly to the news. China's Shanghai Composite index increased by 1.15%, Hong Kong's Hang Seng increased by 1.09%, and China's blue-chip index added 1.61%.
Australia's unemployment rate increased to 5.2% from 4.8%. Weak labor market statistics caused the Australian ASX 200 Index to decline 0.57%.
Main market quotes:
- S&P 500 (F) 4,646.71 −38.54 (−0.82%)
- Dow Jones 36,079.94 −240.04 (−0.66%)
- DAX 16,067.83 +27.36 (+0.17%)
- FTSE 100 7,340.15 +66.11 (+0.91%)
- USD Index 94.88 +0.93 (+0.99%)
Important events for today:
- Australia Unemployment Rate (m/m) at 02:30 (GMT+2);
- Japan Industrial Production (m/m) at 04:00 (GMT+2);
- UK GDP (q/q) at 09:00 (GMT+2);
- UK Industrial Production (m/m) at 09:00 (GMT+2);
- UK Manufacturing Production (m/m) at 09:00 (GMT+2);
- ECB Economic Forecasts at 12:00 (GMT+2).
Sterling Sinks As US Inflation Soars
The British pound is steady on Thursday after a massive drop a day earlier. GBP/USD is currently trading at 1.3390, down 0.11% on the day.
US inflation sends the pound tumbling
It was a miserable Wednesday for the British pound, which fell 1.13% on the day. The catalyst for the slide was a red-hot performance from US CPI in October, which jumped 6.2% y/y, its fastest pace since 1991. The 10-year Treasury yield climbed to 1.59% on Wednesday. GBP/USD remains under pressure and fell to 1.3364 in today’s Asian session, its lowest level since December 21st.
The pound’s decline comes on the heels of last week’s fall of 1.3% after the BoE stunned the markets and did not raise interest rates, as had been widely expected. Governor Andrew Bailey had given broad hints that he would raise rates, but in the end, he voted against a rate hike. Bailey has been forced to engage ins some damage control, but it appears that the bank has a credibility problem with the markets, and the BoE is under strong pressure to raise rates at the December policy meeting. However, two key releases from Thursday’s data dump, GDP and Manufacturing Production, were soft and point to weakness in the UK recovery.
The UK released GDP for the third quarter earlier today. The reading of 1.3% was shy of the consensus of 1.5%, but the pound’s reaction has been muted. The economy continues to expand as health restrictions have been further eased, but the quarterly GDP is still 2.1% below pre-pandemic levels. The service sector has rebounded since Covid, with the main sore spots being supply chain problems and consumer weakness. Manufacturing Production came in at -0.1% in September, down from 0.3% a month earlier.
GBP/USD Technical Analysis
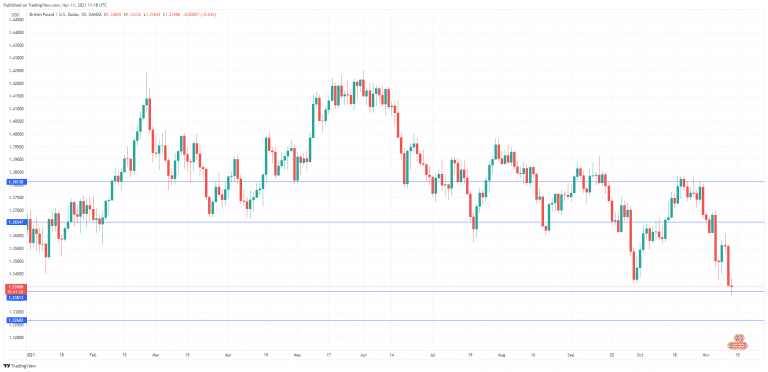
- GBP/USD is testing support at 1.3381. Below, there is support at 1.3267
- There is resistance at 1.3654 and 1.3813
Inflation UK Q3 GDP Data Misses Expectations
Notes/Observations
- Markets brace of growing risk of Fed rate increases after a bigger-than-expected rise in U.S. CPI data.
- High inflation likely to be persistent rather than transitory.
- UK Q3 GDP data keeps chance of Dec BOE rate hike.
- Biden-Xi virtual summit said to be tentatively set for Monday; Nov 15th (no confirmations).
Asia
- Australia Oct Employment Change missed expectations and likely reflected lagged recognition of Covid-19 lockdowns across the prior three months (-46.3K v +50.0Ke; Unemployment Rate: 5.2% v 4.8%e).
- Japan Oct PPI (CGPI) registered its highest annual pace since the Jan 1981 (Y/Y: 8.0% v 7.0%e).
- BOK Gov Lee noted that higher than expected CPI to continue for a while and hard to predict whether global inflation was temporary as hard to predict when global supply bottlenecks would ease; economic trend was in line with expectations with growth being steady with consumption quickly improving.
- Chin aproperty developer Evergrande [3333.HK] looked set to avert another default.
- China city of Shenyang will ease its curbs on home purchase rules (Note: later refuted).
- PBOC proposes change to debt-ratio rules to allow purchases of distressed property assets.
- China PBoC said to be considering opening a pathway for financially strained property firms to unload projects by allowing buyers to take over the assets without having the projects' associated debt affect their own debt ratio.
Europe
- ECB’s Holzmann (Austria) stated that the economic situation since the summer had deteriorated; It might take two years to reach the 2019 growth path. Inflation should be below 2% in 2023 or 2024.
Americas
- President Biden stated that Consumer prices were still too high, people were still unsettled about the economy because of higher prices.
- President Biden said to plan to sign $1.2T infrastructure bill on Monday, Nov 15th.
- Fed's Daly (non-voter, dove) stated that inflation was high; facing a challenge right now but likely a transitory period.
- US Senator Manchin (D-VW) said to possible delay Biden social spending agenda until next year over inflation worries.
Speakers/Fixed income/FX/Commodities/Erratum
Equities
- Indices [Stoxx600 +0.16% at 484.54, FTSE +0.37% at 7,366.89, DAX +0.18% at 16,096.05, CAC-40 +0.34% at 7,069.11, IBEX-35 -0.13% at 9,129.50, FTSE MIB +0.04% at 27,573.00, SMI +0.29% at 12,436.87, S&P 500 Futures +0.38%].
- Market Focal Points/Key Themes: European indices open modestly lower across the board but later turned to trade generally mixed; materials and financials sectors among the better performers; while consumer discreationary and energy sectors lagged; Poland closed for holiday; Skia acquires MBCC; Spie negotiation acquisition of Worksphere; Prophotonix to be acquried by Exaktera; Engie and Credit Agricole unit acquire Eolia; earnings expected during the upcoming US session include Deutsche Euroshop, Tapestry, Brookfield Asset Management and Pirelli.
Equities
- Consumer discretionary: Delivery Hero [DHER.DE] +2% (earnings), Burberry [BRBY.UK] -8% (earnings).
- Consumer staples: Sixt [SIX2.DE] -5% (earnings).
- Financials: Generali [G.IT] +1% (earnings).
- Healthcare: Merck KGaA [MRK.DE] -1% (earnings).
- Industrials: Siemens [SIE.DE] +2.5% (earnings; initial outlook), FLSmidth [FLS.DK] +8% (earnings; CEO to step down).
- Materials: ArcelorMittal [MT.NL] +2.5% (earnings), Johnson Matthey [JMAT.UK] -19% (trading update; CEO retires; exit business segment).
Speakers
- Sweden Central Bank (Riksbank) Gov Ingves stated that the current high level of inflation generally seen as transitory.
- German SPD leader Scholz stated that the pandemic still remained with us; needed additional measures to get through winter. Chancellor Merkel and State Premiers to meeting during week of Nov 15th to discuss the pandemic (**Reminder: Germany recently reported another COVID-19 record with almost 52K new cases for its 4th straight record high).
- EU Commission updated its Autumn Economic Forecasts which raised the EU-19 2021 inflation from 1.9% to 2.4% and raised the EU-19 2022 inflation from 1.4% to 2.2%. It set EU-19 2023 inflation at 1.4% (**Note: below ECB 2% target).
- EU Economic Commissioner Gentiloni (Italy): Economy was moving from recovery to expansion.
- EU's Dombrovskis stated that inflation should be closely monitored and policies adjusted if needed; Needed to address bottlenecks in the supply chain and surging.
- EU official noted that there was scope for finding shared solutions with the UK.
- Belarus President Lukashenko said to warn he could shutdown gas pipeline to EU; to respond robustly to any new sanction.
- US Treasury Sec Yellen said to have stressed importance of global supply chain issues revealed by the pandemic in recent meeting with Australia, New Zealand, Canada and UK counterparts.
Currencies/Fixed Income
- US Dollar Index at 15-month high in the aftermath of Wed’s US CPI data as markets reassessed its bets on an accelerated monetary tightening trajectory. Yields did climb across the front end of the curve.
- GBP/USD tested below the 1.34 for fresh 2021 lows following a slight miss in Q3 GDP data. Dealers noted that the data provided some headwinds into a Dec BOE rate hike as a slowing recovery and increasing inflation poised a troubling mix for policymakers.
- EUR/USD tested the 1.1440 in the aftermath of the US inflation data.
- USD/JPY holding above the 114.00 level by mid-session.
Economic data
- (SE) Sweden Oct PES Unemployment Rate: 3.6% v 3.7% prior.
- (TR) Turkey Sept Current Account Balance: $1.7B v $1.3Be.
- (UK) Sept Monthly GDP M/M: 0.6% v 0.4%e.
- (UK) Q3 Preliminary GDP Q/Q: 1.3% v 1.5%e; Y/Y: 6.6% v 6.8%e.
- (UK) Q3 Preliminary Private Consumption Q/Q: 2.0% v 3.1%e; Government Spending Q/Q: 0.9% v 0.7%e; Gross Fixed Capital Formation Q/Q: 0.8% v 2.4%e; Exports Q/Q: -1.9% v -1.5%e; Imports Q/Q: 2.5% v 3.4%e.
- (UK) Q3 Preliminary Total Business Investment Q/Q: 0.4% v 3.5%e; Y/Y: 0.8% v 12.9% prior.
- (UK) Sept Industrial Production M/M: -0.4% v +0.2%e; Y/Y: 2.9% v 3.1%e.
- (UK) Sept Manufacturing Production M/M: -0.1% v +0.2%e; Y/Y: 2.8% v 3.1%e.
- (UK) Sept Construction Output M/M: 1.3% v 0.2%e; Y/Y: 7.2% v 6.9%e.
- (UK) Sept Index of Services M/M: 0.7% v 0.5%e; 3M/3M: 1.6% v 1.9%e.
- (UK) Sept Visible Trade Balance: -£14.7B v -£14.4Be; Overall Trade Balance: -£2.8B v -£3.3Be; Trade Balance Non-EU: -£9.1B v -£7.4B prior.
- (ZA) South Africa Sept Total Mining Production M/M: -3.7% v -2.0% prior; Y/Y: -3.4% v +2.7%e; Gold Production Y/Y: -6.9% v +17.7% prior; Platinum Production Y/Y: -7.5% v +1.5% prior.
Fixed income Issuance
- (DK) Denmark sold total DKK3.70B in 3-month, 6-month and 9-month Bills.
- (SE) Sweden sold total SEK1.25B vs. SEK1.25B indicated in 2030 and 2032 I/L Bonds.
- (IT) Italy Debt Agency (Tesoro) sold total €5.75B vs. €4.75-5.75B indicated range in 3-year and 7-year BTP Bonds.
- Sold €2.0B vs. €1.5-2.0B indicated range in 0.0% Aug 2024 BTP; Avg Yield: -0.16% v -0.27% prior; bid-to-cover: 1.58x v 1.65x prior (Sept 14th 2021).
- Sold €3.75B vs. €3.25-3.75B indicated range in new 0.45% Nov 2029 BTP; Avg Yield: 0.60% v 0.48%..
Looking ahead
- (IE) Ireland Debt Agency (NTMA) to sell €1.0B in 2028 and 2031 IGB Bonds.
- OPEC Monthly Oil Report.
- 05:25 (EU) Daily ECB Liquidity Stats.
- 05:30 (HU) Hungary Debt Agency (AKK) to sell 12-month Bills; Avg Yield: % v 1.75% prior; bid-to-cover: 1.41x prior (Oct 28th 2021).
- 06:00 (IE) Ireland Oct CPI M/M: No est v 0.5% prior; Y/Y: No est v 3.7% prior.
- 06:00 (IE) Ireland Oct CPI EU Harmonized M/M: No est v 0.4% prior; Y/Y: No est v 3.8% prior.
- 06:00 (PT) Portugal Oct CPI M/M: No est v 0.5% prior; Y/Y: No est v 1.8% prior.
- 06:00 (PT) Portugal Oct CPI EU Harmonized M/M: No est v 0.4% prior; Y/Y: No est v 1.8% prior.
- 06:00 (IL) Israel Oct Trade Balance: No est v -$3.6B prior.
- 06:00 (ZA) South Africa Sept Manufacturing Production M/M: 1.2%e v 7.6% prior; Y/Y: -1.3%e v +1.8% prior.
- 06:45 (UK) BOE's Mann.
- 07:00 (MX) Mexico Sept Industrial Production M/M: -0.2%e v +0.4% prior; Y/Y: 4.0%e v 5.5% prior; Manufacturing Production Y/Y: 3.2%e v 6.6% prior.
- 07:00 (BR) Brazil Sept Retail Sales M/M: -0.6%e v -3.1% prior; Y/Y: -4.1%e v -4.1% prior.
- 07:00 (BR) Brazil Sept Broad Retail Sales M/M: 0.0%e v -2.5% prior; Y/Y: -2.9%e v 0.0% prior.
- 08:00 (RU) Russia Gold and Forex Reserve w/e Nov 5th: No est v $623.2B prior.
- 08:00 (RU) Russia Sept Trade Balance: $18.5Be v $17.1B prior; Exports: $44.7Be v $43.2B prior; Imports: $26.7Be v $26.0B prior.
- 08:00 (UK) Daily Baltic Dry Bulk Index.
- 08:15 (IE) ECB's Lane (Ireland, chief economist).
- 10:00 (CO) Colombia Sept Manufacturing Production Y/Y: 16.0%e v 22.9% prior.
- 10:00 (CO) Colombia Sept Retail Sales Y/Y: 19.0%e v 32.0% prior.
- 14:00 (MX) Mexico Central Bank (Banxico) Interest Rate Decision: Expected to raise the Overnight Rate by 25bps to 5.00%.
- 14:00 (AR) Argentina Oct National CPI M/M 3.4%e v 3.5% prior; Y/Y: 52.0%e v 52.5% prior.
- 14:00 (CO) Colombia Sept Industrial Production Y/Y: No est v 15.5% prior.
- 16:00 (KR) South Korea Oct Import Price Index M/M: No est v 2.4% prior; Y/Y: No est v 26.8% prior.
- 16:00 (KR) South Korea Oct Export Price Index M/M: No est v 1.0% prior; Y/Y: No est v 20.2% prior.
- 16:30 (NZ) New Zealand Oct Manufacturing PMI: No est v 51.4 prior.
- 18:00 (PE) Peru Central Bank (BCRP) Interest Rate Decision: Expected to raise Reference Rate by 50bps to 2.00%.
- 21:30 (JP) Japan to sell 3-Month Bills.
- 22:00 (CN) China to sell 30-year Upsize Bond.
- 23:00 (MY) Malaysia Q3 GDP Q/Q: -0.6%e v -2.0% prior; Y/Y: -1.9%e v +16.1% prior.
- 23:00 (MY) Malaysia Q3 Current Account Balance (MYR): 16.5Be v 14.4B prior.
Aussie Dips Below 73 On Soft Jobs Report
The losses continue to mount for the Australian dollar, which is down for a third straight day. AUD/USD is currently trading at 0.7295, down 0.44% on the day.
Australia’s October employment report was soft, with total employment declining and the unemployment rate rising. The economy shed 46.3 thousand jobs, marking a third straight decline. Unemployment rose to 5.2%, up sharply from 4.6%. The markets gave a thumb down to the news, sending the Australian dollar below the symbolic 0.73 level.
Although the job numbers were bad, they are reflective of the lockdowns which have now been lifted in Sydney and Melbourne. As the economy continues to re-open, we can expect employment numbers to rebound and the unemployment rate to decline.
Inflation is on the rise, which may force the RBA to bring forward its guidance on rate hikes. Core CPI has broken above 2%, the RBA’s lower limit of its inflation target. As well, the Melbourne Institute consumer inflation expectations for November surged to 4.6% y/y, the third straight month above the 4% level. If inflation and inflation expectations continue to climb, the RBA will find it difficult to convince the markets that inflation is transitory and may have to make a hawkish shift. The central bank meets next on December 7th and we could see the bank scale back QE, perhaps from the current AUD 4 billion to AUD 3 billion. If the economy continues to improve, QE could be further scaled back early next year and terminated by mid-2022.
US inflation hits 31-year high
In the US, inflation continues to surge higher. CPI for October rose 6.2% y/y, above expectations and the largest gain since 1990. This sent US 10-year Treasury yields higher and boosted the US dollar, as the data will put pressure on the Fed to raise interest rates sooner than expected, and to accelerate the tapering announced last just last week. The prolonged surge in inflation has become a major headache for the Federal Reserve, and its stance that inflation is transitory is becoming more hollow as PPI and CPI remain red-hot.
AUD/USD Technical
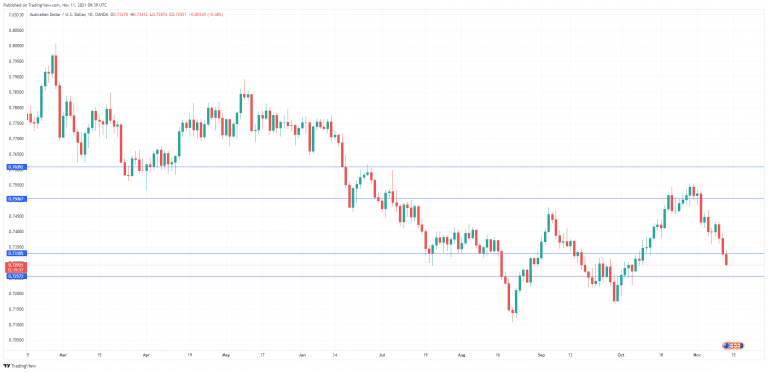
- There is resistance at 0.7506 and 0.7609
- AUD/USD has broken below support at 0.7330. Below, there is support at 0.7257, which has held since early October
The Analytical Overview Of The Main Currency Pairs
The EUR/USD currency pair
Technical indicators of the currency pair:
Prev Open: 1.1592
Prev Close: 1.1476
% chg. over the last day: -1.16%
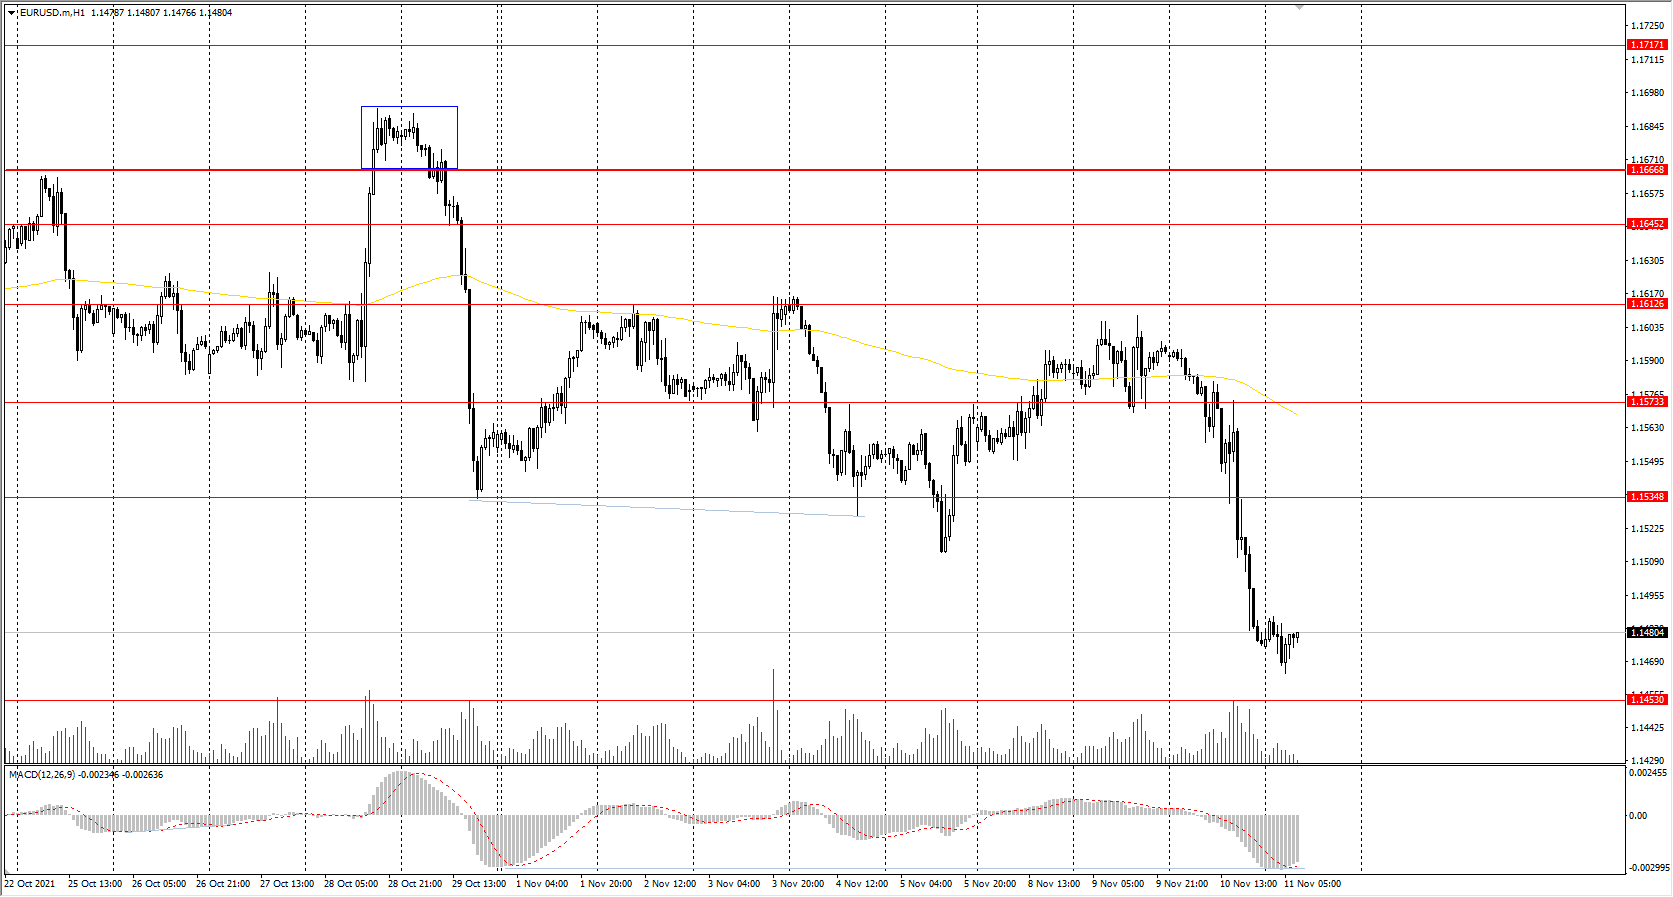
The consumer price index in Germany increased to 4.6% in annual terms. And with a sharp rise in inflation in the US, the dollar index sharply increased, which had a negative impact on the European currency. It’s a bank holiday in the United States today, which will allow the market to calm down a bit, and the volatility in the American session will sharply decrease.
Trading recommendations
Support levels: 1.1453
Resistance levels: 1.1535, 1.1573, 1.1613, 1.1645, 1.1667, 1.1717, 1.1772
From the technical point of view, the EUR/USD on the hour time frame is bearish. The MACD indicator has become negative, but there is a divergence on the higher time frames. Under such market conditions, traders should consider sell positions from the resistance levels near the moving average, as the price has deviated strongly from the averages. Buy trades should be considered only from the support levels of the higher timeframe, given the buyer’s initiative.
Alternative scenario: if the price breaks out through the 1.1573 resistance level and fixes above, the mid-term uptrend will likely resume.
News feed for 2021.11.11:
- ECB Economic Forecasts at 12:00 (GMT+2).
The GBP/USD currency pair
Technical indicators of the currency pair:
Prev Open: 1.3556
Prev Close: 1.3402
% chg. over the last day: -1.14%
According to Uswitch, more than half of UK households will be unable to pay their winter energy bills and are at risk to have their heating turned off. The fuel supply crisis and high gas prices have hit consumers hard. The Bank of England's borrowing data shows a surge in consumer lending. All of this suggests that consumer inflation will continue to rise through the winter. And this is a serious reason for the Bank of England to raise interest rates.
Trading recommendations
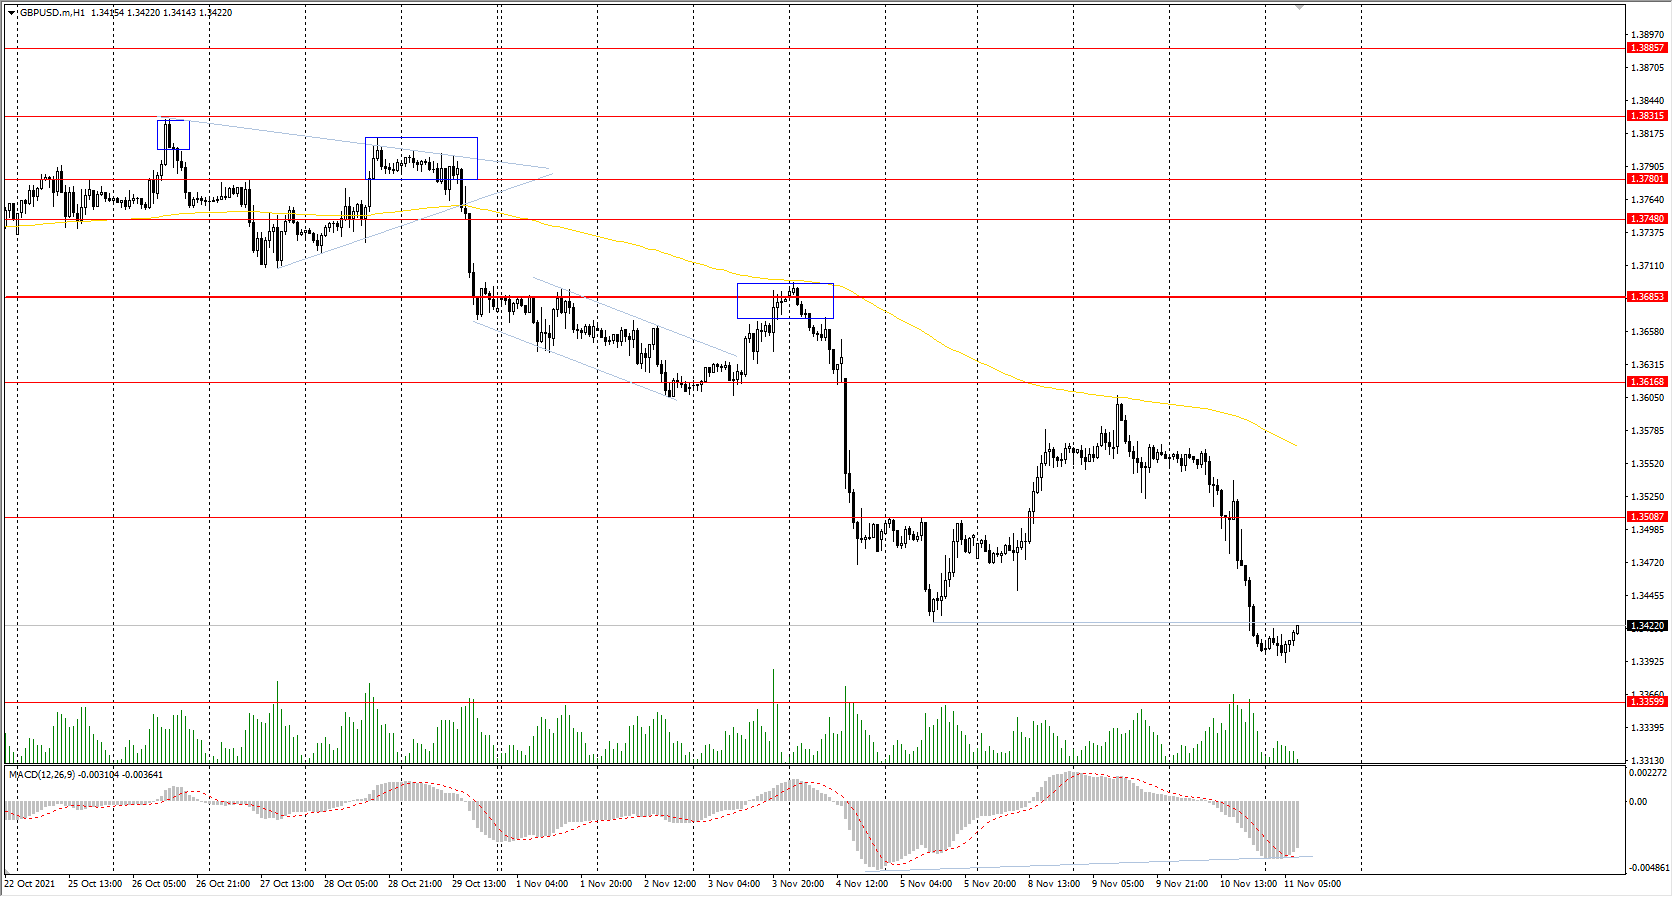
Support levels: 1.3360
Resistance levels: 1.3508, 1.3616, 1.3685, 1.3748, 1.3780, 1.3831, 1.3886
On the hourly time frame, the trend on GBP/USD is bearish. The MACD indicator has become negative, but there is a divergence on the higher time frames. Under such market conditions, traders should consider sell positions from the resistance levels near the moving average, as the price has deviated strongly from the averages. Buy trades should be considered only from the support levels of the higher timeframe, given the buyer’s initiative.
Alternative scenario: if the price breaks out through the 1.3617 resistance level and consolidates above, the bullish scenario will likely resume.
News feed for 2021.11.11:
- UK GDP (q/q) at 09:00 (GMT+2);
- UK Industrial Production (m/m) at 09:00 (GMT+2);
- UK Manufacturing Production (m/m) at 09:00 (GMT+2).
The USD/JPY currency pair
Technical indicators of the currency pair:
Prev Open: 112.83
Prev Close: 113.90
% chg. over the last day: +0.95%
At the moment, there are no fundamental reasons for the USDJPY quotes to go down in the mid-term. It's caused by that the Bank of Japan has kept its monetary policy soft until the end of the year. In addition, the Fed has been already cutting QE and is likely to accelerate cuts due to a sharp rise in inflation.
Trading recommendations
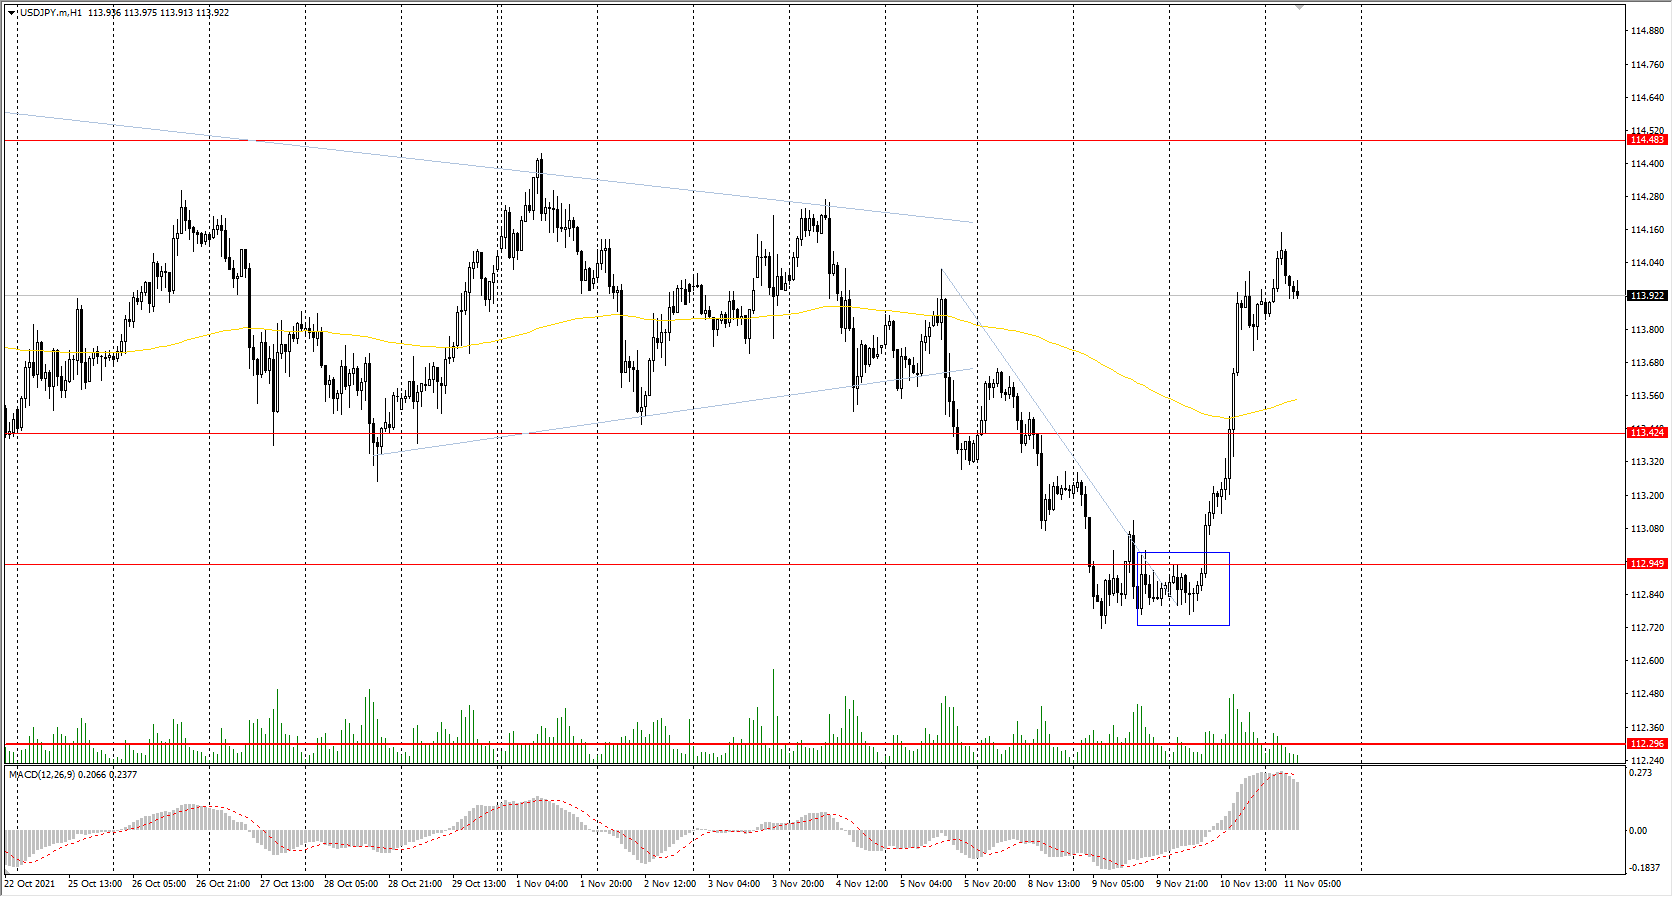
Support levels: 113.42, 112.95, 112.30, 111.53, 110.99, 110.65
Resistance levels: 114.48, 115.15
The global trend on the USD/JPY currency pair is bullish. The local trend has also changed to upward. Under such market conditions, it’s better to look for buy positions from the buyers' initiative zone around the moving average. Sell positions should be considered from the resistance levels of higher time frames, given there is sellers' initiative.
Alternative scenario: if the price falls below 112.30, the uptrend will likely be broken.
News feed for 2021.11.11:
- Japan Industrial Production (m/m) at 04:00 (GMT+2).
The USD/CAD currency pair
Technical indicators of the currency pair:
Prev Open: 1.2436
Prev Close: 1.2493
% chg. over the last day: +0.46%
The Canadian dollar is a commodity currency, so the USD/CAD currency pair highly depends on the dynamics of the dollar index and oil prices. Yesterday, the dollar index sharply increased against the background of the inflation growth in the USA, which led to the sharp growth of USD/CAD quotes. In the medium term, only a sharp increase in oil prices or an increase in interest rates by the Bank of Canada can neutralize the growth of USD/CAD quotes.
Trading recommendations
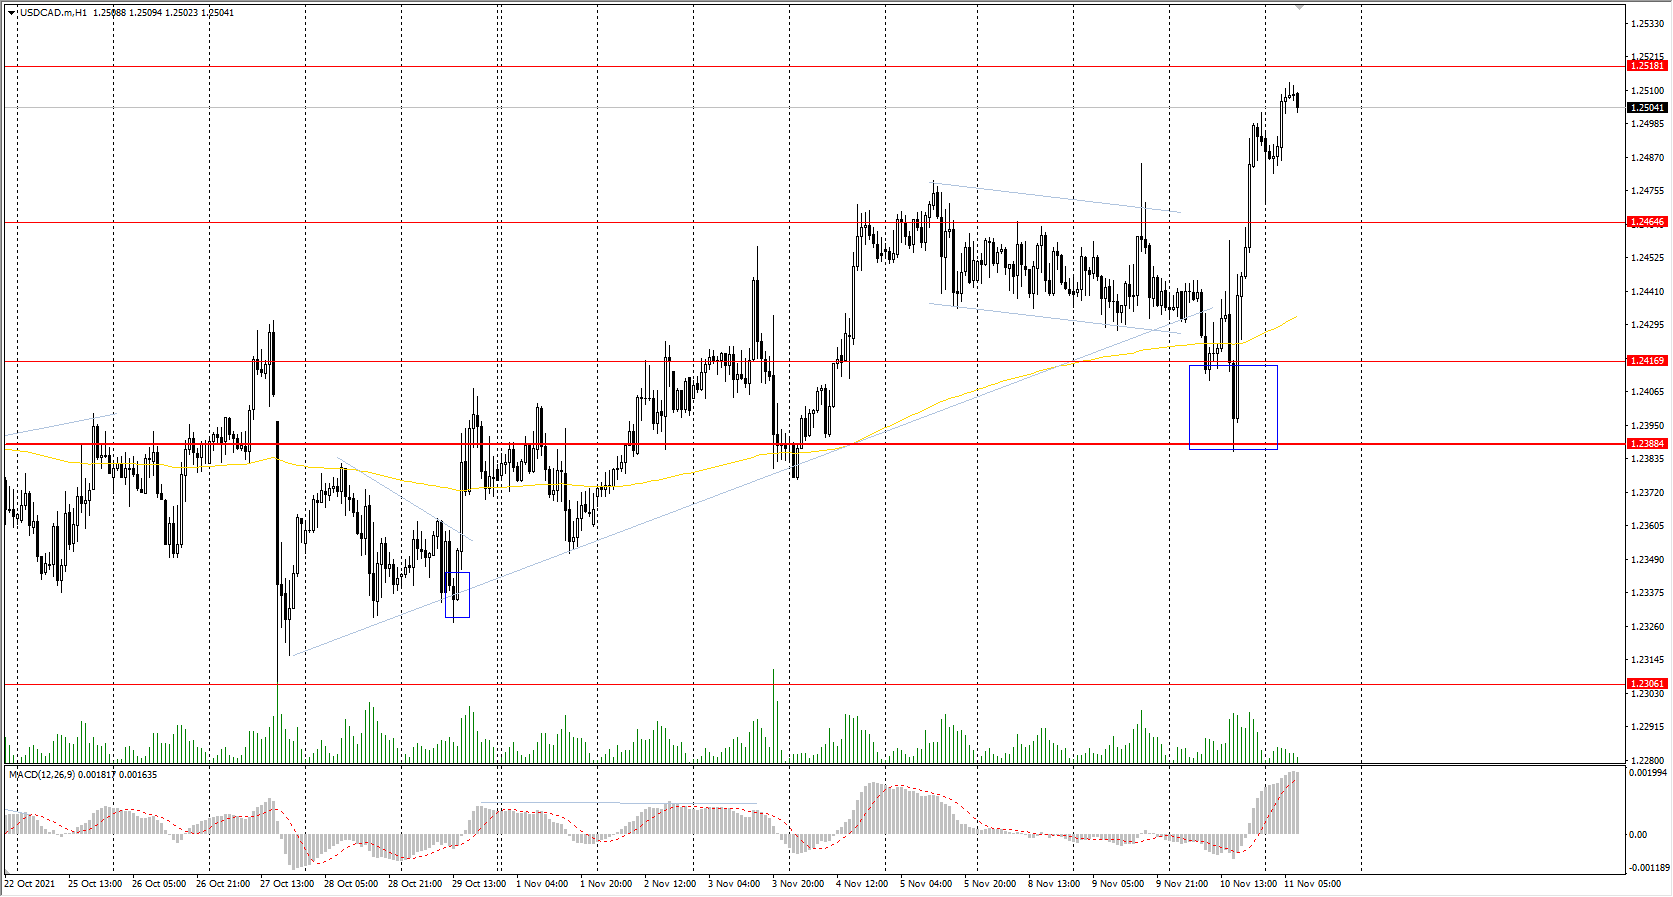
Support levels: 1.2465, 1.2417, 1.2388, 1.2306, 1.2260
Resistance levels: 1.2518, 1.2565, 1.2628, 1.2729, 1.2774
From a technical point of view, the trend of the USD/CAD currency is bullish. The MACD indicator has become positive, with no signs of reversal. Under such market conditions, it is better to look for buy trades from the support levels, given there is the buyers' initiative. Sell deals should be considered from the resistance levels of the higher time frame.
Alternative scenario: if the price breaks down through the 1.2388 support level and fixes below, the downtrend will likely resume.
USD Rallies On Accelerating CPI Rates
The USD rallied against a number of its counterparts yesterday and the USD Index reached levels not seen since July last year, as October’s CPI rates accelerated beyond the market’s expectations. On a monthly level the headline CPI rate reached 0.9% mom, while on a yearly level it reached 6.2% yoy, a level not seen since November 1990 underscoring the inflationary pressures the US economy is going through currently. Also the weekly initial jobless claims figure dropped to a new post pandemic low, underscoring the tightening of the US employment market. Market pressure intensified on the Fed to tighten its monetary policy at a faster pace in order to curb the red hot inflation. San Francisco Fed President Daly had stated earlier in the week that she expects supply chain constraints to be maintained yet price pressures to moderate as we get through the pandemic, yet the Fed’s perception of the “temporary” nature of inflation seems to weaken. US Stockmarkets retreated also highlighting market expectations for the Fed to act. On the other hand, gold prices also gained substantially as the precious metal is used for hedging purposes against high inflation.
Gold’s price jumped yesterday breaking the 1833 (S1) and the 1851 (R1) at some point aiming for the 1870 level at some point, before correcting lower and stabilising somewhat during today’s Asian session. We tend to maintain a bullish outlook for the precious metal, given also that the RSI indicator below our 4-hour chart is at the reading of 70 confirming the bullish sentiment of the market, yet may also imply that gold is overbought and a correction lower may take place. Should the shiny metal find fresh new buying orders along its path, we may see it breaking the 1851 (R1) resistance line and aim for the 1870 (R2) level. Should a correction lower take place, we may see gold’s price aiming if not breaking the 1833 (S1) support line.
Pound traders eye GDP release today
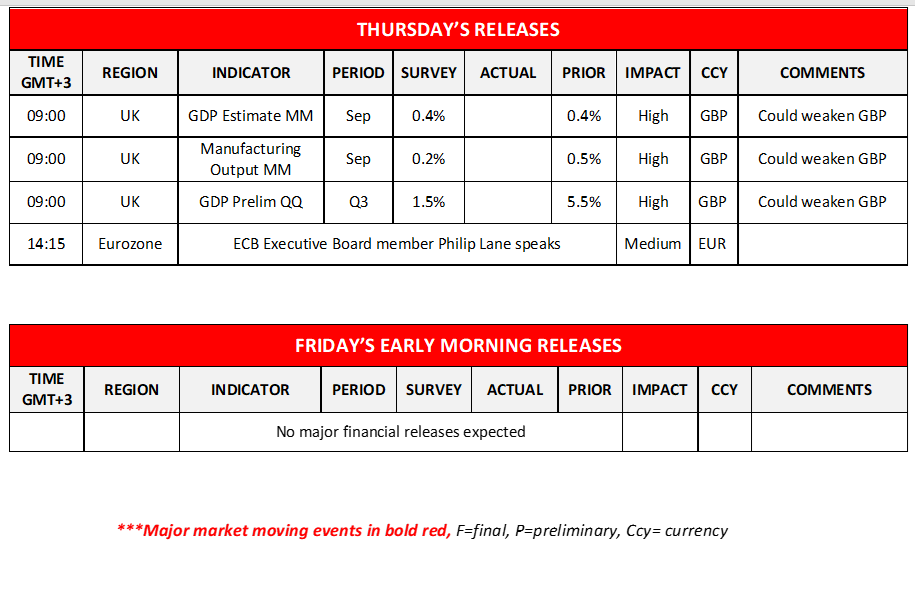
The pound retreated against the USD yesterday but also against EUR, JPY and CHF in a sign of the sterling’s weakness. On the monetary level, there seem to be expectations by the market for the BoE to maintain rates unchanged in its next meeting which could weigh on the pound, yet the majority of the market seems to price in that the bank will actually proceed with a rate hike. On a fundamental level, the tensions in the relationship of the UK with the EU could weigh on the pound should they escalate further. As for financial releases today, we highlight the release of the GDP rates for Q3 and September. The month-on-month rate is expected to remain unchanged at 0.4% mom if compared to August’s reading, while on a quarter-on-quarter level the rate is expected to slow down to 1.5% qoq in Q3, if compared to Q2’s 5.5% qoq. Both rates could weigh on the pound as in September the growth of the UK economy seemed to have failed to accelerate while on a quarterly level the UK economy has performed even worse, slowing the pace of growing. On a second note the manufacturing output growth rate is expected to slow down and reach 0.2% mom if compared to August’s 0.5%mom, intensifying worries for the UK economy.
GBP/USD dropped yesterday breaking just below the 1.3430 (R1) support line, now turned to resistance . We tend to maintain a bearish outlook for the pair given also that the RSI indicator below our 4-hour chart is at the reading 30 which on the one hand confirms the bearish sentiment yet please note that a correction higher could be performed as the pair is near oversold levels. Should the bears actually maintain control over the pair we may see cable aiming if not breaching the 1.3290 (S1) support line. Should a correction higher be actually performed and the bulls take over, we may see the pair breaking the 1.3430 (R1) resistance line and take aim of the 1.3600 (R2) resistance level.
XAU/USD H4 Chart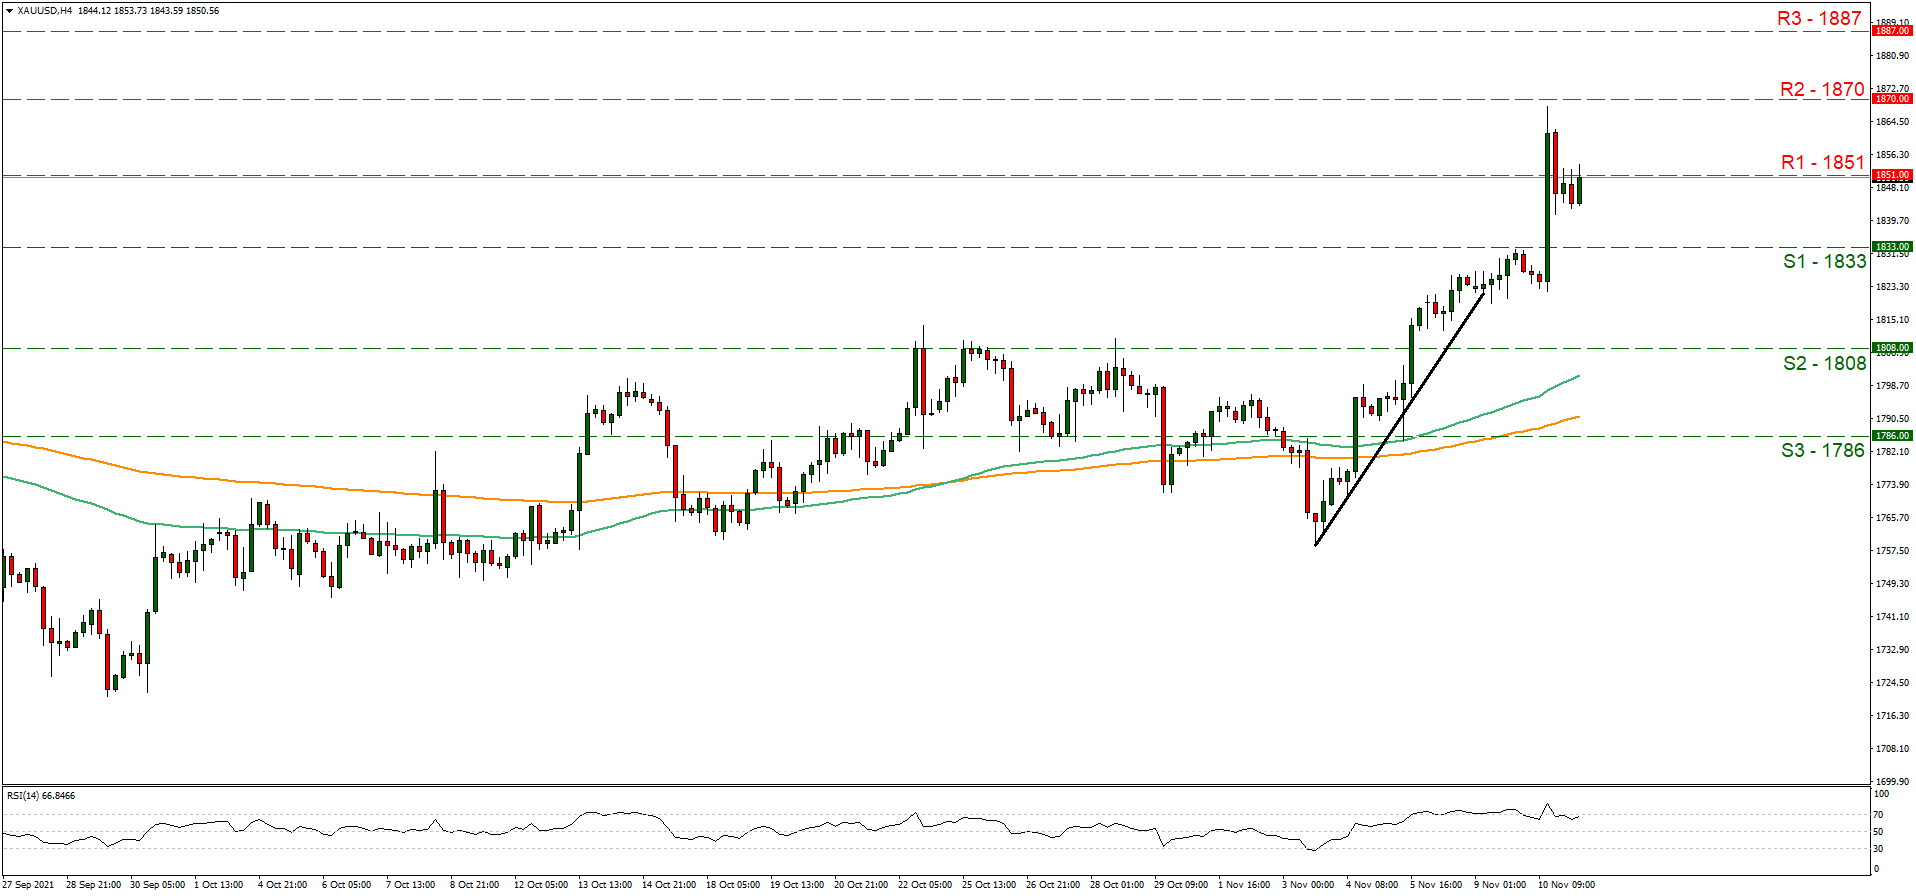
Support: 1833 (S1), 1808 (S2), 1786 (S3)
Resistance: 1851 (R1), 1870 (R2), 1887 (R3)
GBP/USD H4 Chart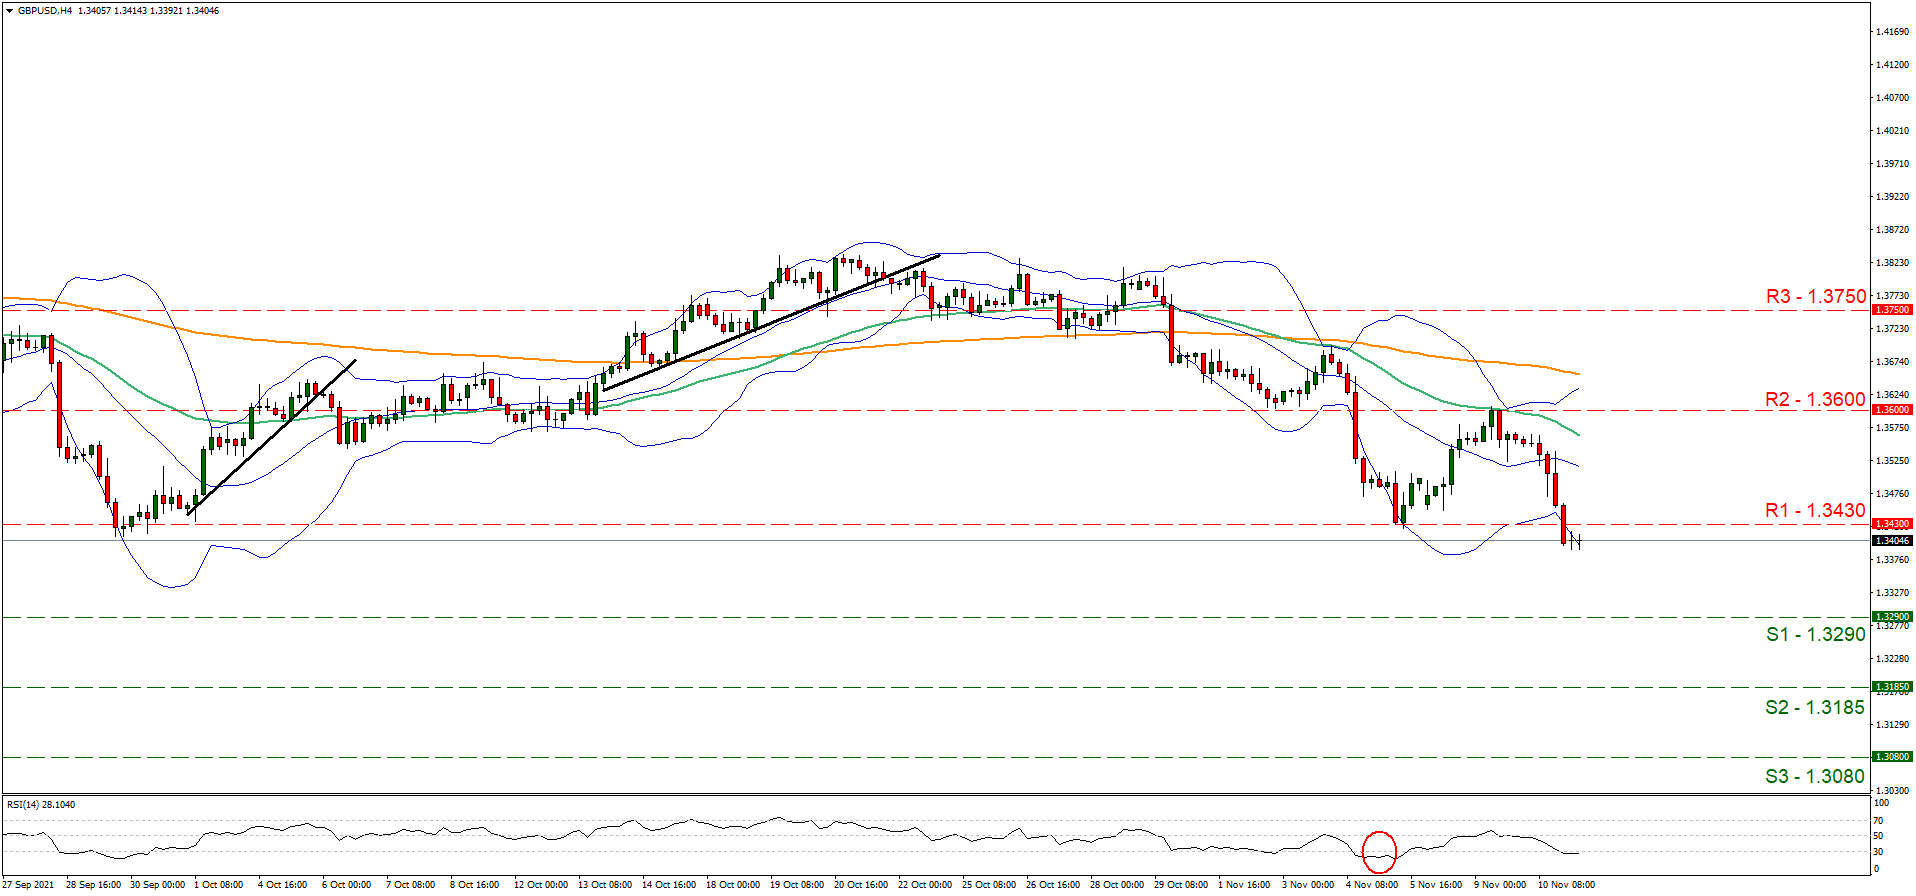
Support: 1.3290 (S1), 1.3185 (S2), 1.3080 (S3)
Resistance: 1.3430 (R1), 1.3600 (R2), 1.3750 (R3)
Dollar Storms Higher As Hot Inflation Reignites Fed Bets
- US inflation comes in hot, pouring fuel on Fed rate hike expectations
- Dollar hits new highs for the year against euro and sterling
- Stock market feels the heat, gold turns into an inflation hedge
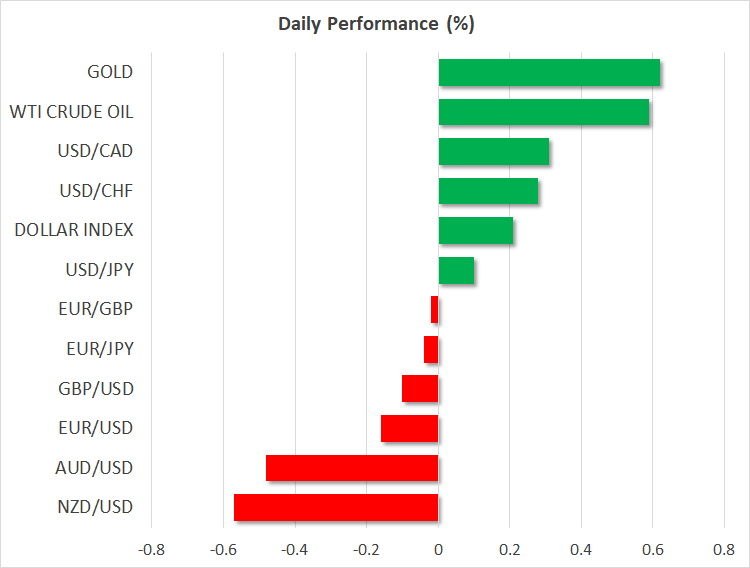
Markets reprice Fed
Another shocking acceleration in US inflation unleashed havoc across global markets yesterday. The annual CPI rate clocked in at 6.2%, overcoming even the most aggressive forecasts. It was the usual suspects such as energy prices and used cars driving inflation higher again, although rents and medical care also fired up, signaling that price pressures are broadening out.
The dollar, Treasury yields, and inflation expectations all charged higher amid bets that the Fed will expedite its normalization plans. Money markets currently point to two rate increases for next year and a 50% chance for a third. An awful 30-year bond auction that saw very poor demand added fuel to these moves.
The question now is whether the Fed will speed up the tapering of its asset purchases in the coming months to address intensifying inflationary pressures and consequently open the door for a rate hike next summer. Any signs that this is under consideration could put more wind into the sails of the mighty dollar.
Euro and sterling battered, stocks retreat
In the broader FX sphere, the euro and British pound took the most damage from the dollar’s resurgence. Euro/dollar and sterling/dollar both fell to new lows for the year in the aftermath, with the pound in particular suffering a double whammy as risk sentiment soured as well.
With Brexit risks back on the radar and the markets pricing in more than four rate increases from the Bank of England next year, there is still plenty of scope for disappointment in sterling.
Stock markets absorbed the initial acceleration in inflation relatively well, but the disappointing Treasury auction opened up another can of worms by catapulting yields even higher. That dealt a heavy blow to the yield-sensitive Nasdaq, which lost 1.7% as tech and growth names came under fire.
That said, the mood has improved today, with a little help from reports that Chinese authorities could take steps to stop the fire sale in the nation’s high yield bond market. Beijing is apparently prepared to relax the rules around how much leverage property developers can take on, allowing distressed companies some breathing room.
Gold shines,
The most striking move yesterday was in gold. Whenever there was a similar inflation shock this year, the precious metal got smashed as the dollar and yields went higher on expectations for faster Fed rate increases. That pattern broke yesterday, with bullion storming higher alongside the reserve currency and yields.
One way of reading this is that gold has turned into an inflation hedge again. To be more precise, gold is benefiting from ‘real’ Treasury yields hitting record lows. With inflation firing up, traders are hedging that exposure by piling into inflation-protected bonds, driving real yields lower and putting the shine back into the precious metal.
In the energy arena, oil prices took a sharp hit yesterday, virtually erasing all their gains for the week. The drop likely reflects the trifecta of rising inventories, fears that premature Fed tightening could choke the recovery in demand, and speculation that Biden may release the strategic reserves after all following his vow to fight inflation.
The US bond market will remain closed today in observance of the Veterans Day holiday, although the stock market will be open for business.
US 30 Index Retreats From All-Time Highs, Bullish Outlook Maintained
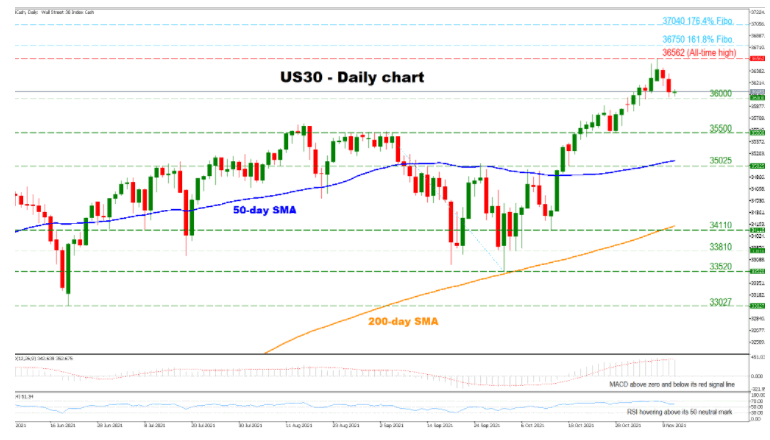
The US 30 stock index pushed back from its all-time highs at 36562 amid weakened positive momentum. However, the overall bullish outlook is still maintained as the price is trading well above its 50- and 200-day simple moving average (SMA).
The weakened positive momentum and the minor price depreciation are also supported by the short-term momentum indicators, as the RSI has decreased slightly over the past sessions, although it’s still above its 50 neutral mark, while the MACD is found above zero but below its red signal line.
If the price breaks above its all-time high at 36,562, the positive momentum of the index might be reinforced. Overcoming this level, the price would enter uncharted waters, possibly testing the 161.8% Fibonacci extension of the September 3 to October 1 downleg at 36,750 before targeting the 176.4% Fibonacci extension at 37,040.
On the flip side, should the price break below the 36000 support, the bears might then aim for the strong 35500 level. A further descending movement from this point could pave the way towards the congested region, which encapsulates the 50-day SMA currently at 35100, and the 35025 level. Breaching this obstacle could change the positive outlook of the index to neutral.
In brief, the overall outlook for the US 30 stock index is bullish, with a weakened positive momentum. However, this might change if the price breaks below the 50-day SMA, turning its outlook to neutral, while breaking above the November 8 all-time high could reinforce the pair’s positive momentum.
AUDUSD’s Decline Gets Snagged At The Ichimoku Cloud
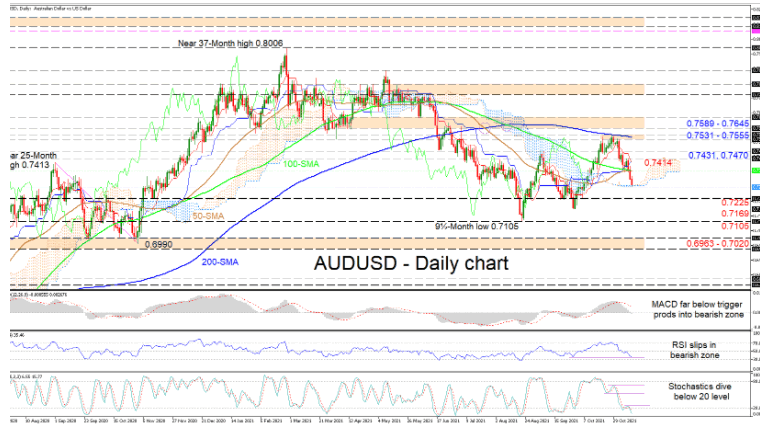
AUDUSD sellers managed to seize command in the pair two days ago and successfully push the price back underneath the 50- and 100-day simple moving averages (SMAs). The bears are currently attempting to extend this recent drop in the price below the Ichimoku cloud, around the 0.7283 level. The 200-day SMA has aimed slightly lower showing price's preference to the downside, while the negative bearing of the 100-day SMA and the deflection off it by the 50-day SMA, together suggest that the bullish drive is not substantial enough to overwhelm the negative trend.
The short-term oscillators are skewed to the downside. The MACD has distanced itself below its red trigger line and has just dipped below the zero threshold, while the RSI is falling in bearish territory. The strong negative charge exhibited in the stochastic oscillator is promoting further negative price action.
Should sellers manage to stay in control and drive the price below the Ichimoku cloud at 0.7283, bearish limitations could then transpire from the 0.7225 barrier and the neighbouring 0.7169 low. If the decline gains extra downward momentum, the 9½-month trough from August 20 may come into focus. In the event bearish forces continue to overwhelm, the next support could develop in the region of 0.6963-0.7020.
However, if the cloud suppresses the negative powers and buyers find positive traction, the merged 50- and 100-day SMAs at 0.7370 may provide the first border for buyers to overcome. Pushing higher, the converged Ichimoku lines could delay the test of the 0.7431 and 0.7470 nearby highs. Conquering these obstacles, buyers may then propel the price to challenge the 0.7531-0.7555 resistance ceiling, reinforced by the 200-day SMA. Successfully reviving upside impetus would then turn traders' focus to the 0.7589-0.7645 resistance barricade.
Summarizing, AUDUSD is exhibiting a strong bearish tone below the SMAs and the 0.7431 high. A decline below the 0.6963-0.7020 support would be needed to definitively bolster negative tendencies. Yet, a jump above the 0.7589-0.7645 boundary is essential to strengthen the bullish bias.
AUDJPY Stumbles Around 3½-Year Highs
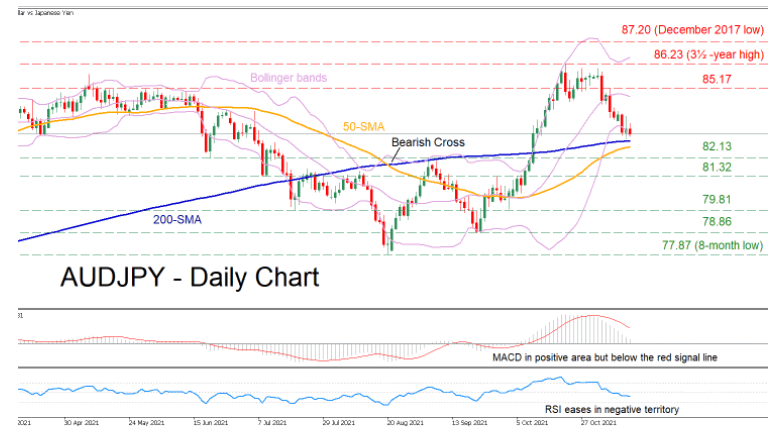
AUDJPY has been ramping up since the price encountered strong support at the 8-month low of 77.87 in mid-August. However, the pair has been giving up ground lately after its recent rally halted at the 3½-year high of 86.23. As the price is heading to test its 50- and 200-day simple moving averages (SMAs), its immediate bias seems negative.
This recent pullback is likely to continue as the short-term oscillators indicate that the positive forces are fading. The MACD histogram is above zero but below its red signal line, while the RSI is flatlining in the negative area.
Should the selling pressure intensify, the initial hurdle might be found at the 82.13 level, which has provided both support and resistance in recent months. If sellers manage to conquer this barricade, then the next challenge could be the 81.32 level. Crossing below this support level, the price might then halt its decline at 79.81 or even lower at the 78.86 region.
Alternatively, should the bulls retake control, the first resistance barrier might be met at the 85.17 level. If the price ascents higher, the next obstacle could be the 3½-year high of 86.23. Higher up, the next barrier for buyers may be the December 2017 low of 87.20.
Overall, AUDJPY has been in an upward move since mid-August. Although the pair has lost ground recently, only a clear move below 77.87 would alter the medium-term outlook to negative.