Sample Category Title
AUD/USD Daily Report
Daily Pivots: (S1) 0.7389; (P) 0.7460; (R1) 0.7500; More...
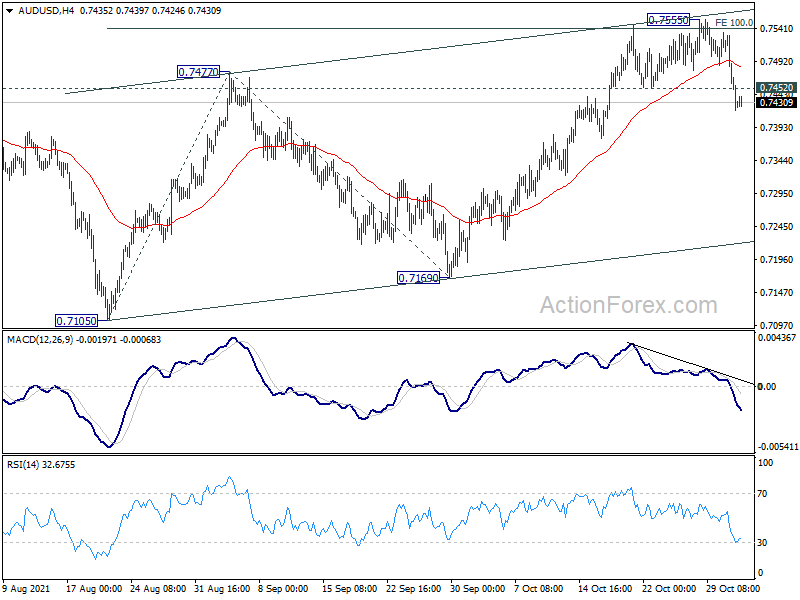
Break of 0.7452 support suggests that short term topping at 0.7555. Intraday bias in AUD/USD is turned back to the downside for 55 day EMA (now at 0.7393). Sustained break there will argue that rebound from 0.7105 is complete with three waves up to 0.7555. That would also argue that fall from 0.8006 is ready to resume through 0.7105 low. On the upside, break of 0.7555 will turn bias back to the upside and resume the rebound instead.
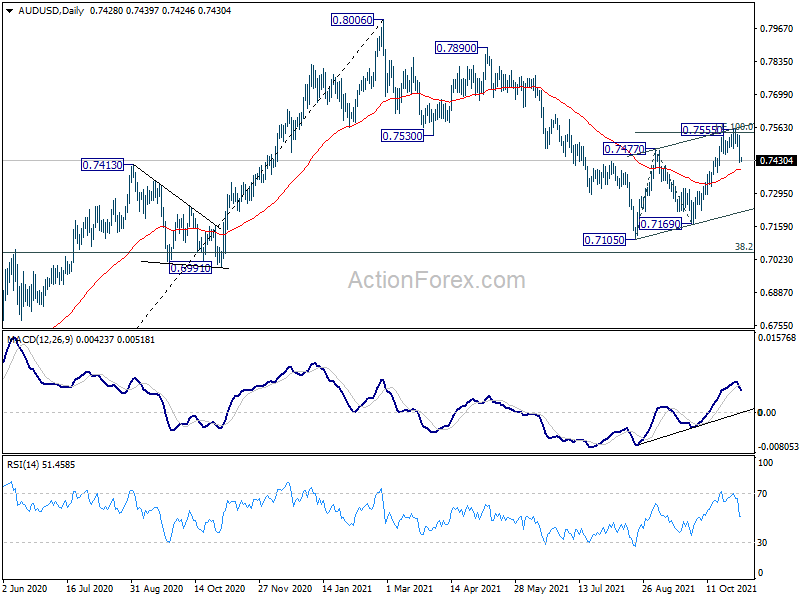
In the bigger picture, with 0.6991 cluster support (38.2% retracement of 0.5506 to 0.8006 at 0.7051) intact, we're seeing price action from 0.8006 as a correction only. That is, up trend from 0.5506 low would resume after the correction completes. In that case, main focus will be 0.8135 key resistance (2018 high). Sustained break there will carry larger bullish implications. However, sustained break of 0.6991 will argue that the whole medium term trend has indeed reversed.
USD/CAD Daily Outlook
Daily Pivots: (S1) 1.2377; (P) 1.2401; (R1) 1.2434; More...
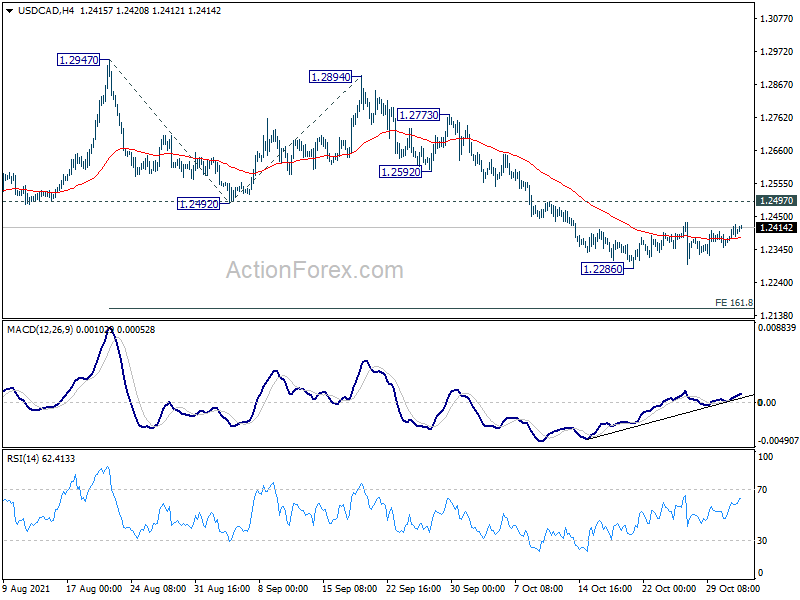
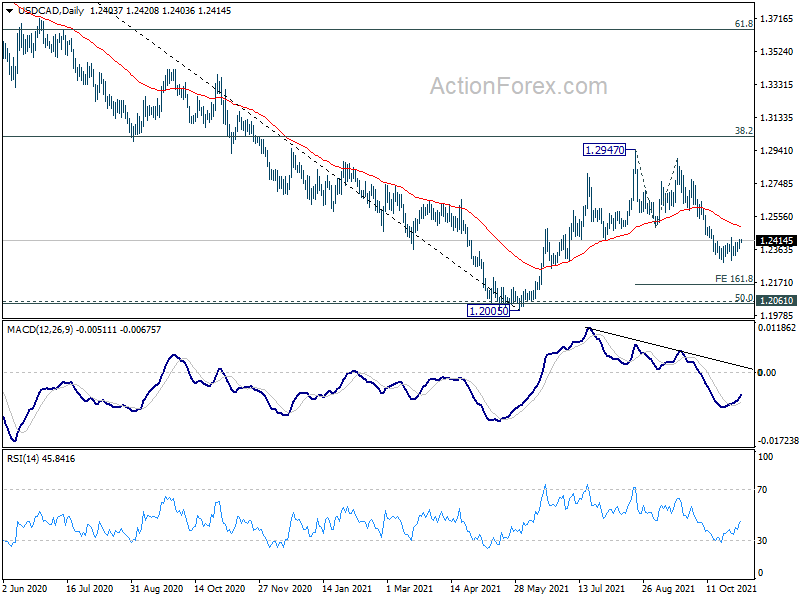
Intraday bias in USD/CAD remains neutral as consolidation from 1.2286 is still extending. Outlook is unchanged that in case of stronger recovery, upside should be limited by 1.2497 resistance. On the downside, break of 1.2286 will resume the fall from 1.2947 to 161.8% projection of 1.2947 to 1.2492 from 1.2894 at 1.2158 next. However, firm break of 1.2497 will turn bias back to the upside for stronger rebound.
In the bigger picture, the rejection by 38.2% retracement of 1.4667 to 1.2005 at 1.3022 argues that rebound from 1.2005 is merely a corrective rise, which is complete. More importantly, the down trend from 1.4667 (2020 high) is not over yet. Sustained break of 1.2005 will extend the down trend to next long term fibonacci level at 61.8% retracement of 0.9406 to 1.4689 at 1.1424. In any case, outlook will not turn bullish as long as 1.2947 resistance holds.
Dollar Mixed as Markets Turn Cautious ahead of FOMC Tapering
Overall markets are quite mixed for now. While US indexes surged to new record highs overnight, positive sentiment was not carried forward to Asia. Major pairs and crosses are also stuck in range. It seems that traders and investors have turned into cautious mode, awaiting Fed's tapering decision. For now, Euro and Swiss Franc are the stronger ones for the week. Aussie and Kiwi are the weaker ones despite solid job data from New Zealand. The greenback is mixed, together with Yen and Canadian.
Technically, Dollar's outlook is rather mixed for the moment. The fall in GBP/USD suggests that rebound from 1.3410 might have completed at 1.3833, as a corrective move. That aligns GBP/USD with EUR/USD's near term bearish outlook. But more downside is still in favor in USD/CHF with 0.9174 minor resistance holds. AUD/USD's pull back doesn't warrant near term reversal yet. USD/CAD also also struggling in tight range with bears bias. We'd be cautious in trading Dollar's post-FOMC reaction today, and pay attention to the bigger picture of all mostly traded pairs before making a judgement.
In Asia, at the time of writing, Hong Kong HSI is down -0.91%. China Shanghai SSE is down -0.38%. Singapore Strait Times is down -0.37%. Japan is on holiday. Overnight, DOW rose 0.39%. S&P 500 rose 0.37%. NASDAQ rose 0.34%. 10-year yield dropped -0.026 to 1.549.
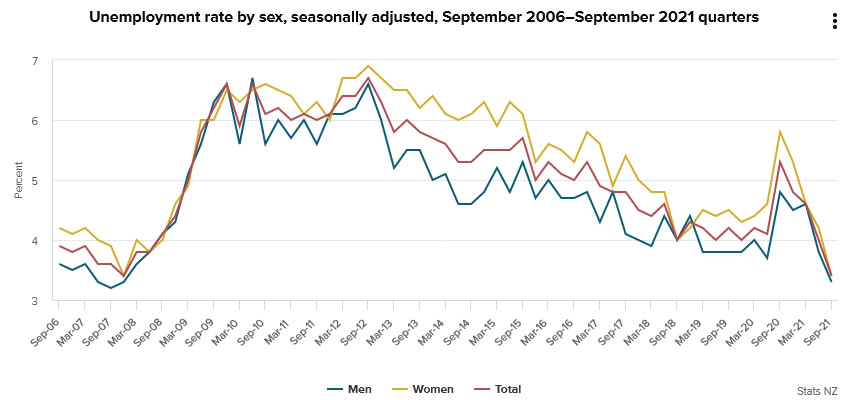
New Zealand unemployment dropped to record low 3.4% in Q3
New Zealand employment rose 2.0% qoq in Q3, much better than expectation of 0.4% qoq. Growth was largely driven by full-time jobs, which increased 2.3% qoq or 50k, while part-time jobs dropped slightly. Unemployment rate dropped sharply from 4.0% to 3.4%, better than expectation of 3.9%. The total employment matched the lowest level on record, reached last time in 2007. Labor force participation rate rose 0.7% to 71.2%.
"The fall in the unemployment rate is in line with reports of difficulty finding workers and high labour turnover, and continued travel restrictions on international arrivals, which put pressure on domestic labour supply," work and wellbeing statistics senior manager Becky Collett said.
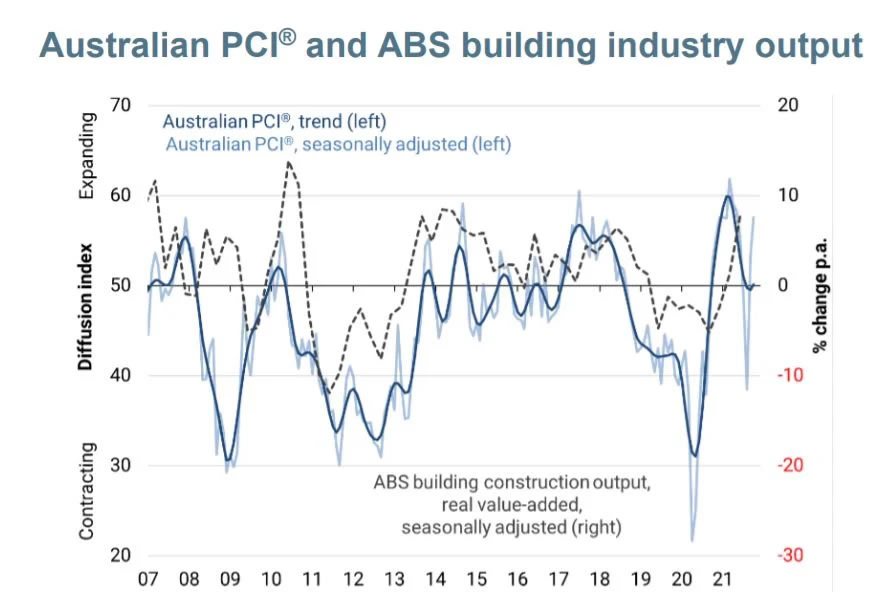
Australia AiG construction rose to 57.6, healthy leap in activity
Australia AiG Performance of Construction rose 4.3 pts to 57.6 in October. Looking at some details, activity rose 15.4 to 65.2. Employment dropped -0.2 to 56.8. New orders dropped -0.2 to 58.7. Supplier deliveries dropped -1.3 to 41.3. Input prices dropped -1.2 to 97.2. Selling prices dropped -0.5 to 78.3. Average wages dropped -1.5 to 75.1.
Ai Group Head of Policy, Peter Burn, said: "The healthy leap in activity levels across the Australian construction sector in October is a taste of what is expected to be a strong rebound for the broader economy over the next few months as New South Wales, Victoria and the ACT, liberated from COVID restrictions, catch up with the rest of the country and as barriers to the movement of people within Australia are removed."
Also released building permits dropped -4.3% mom in September, versus expectation of -2.0% mom.
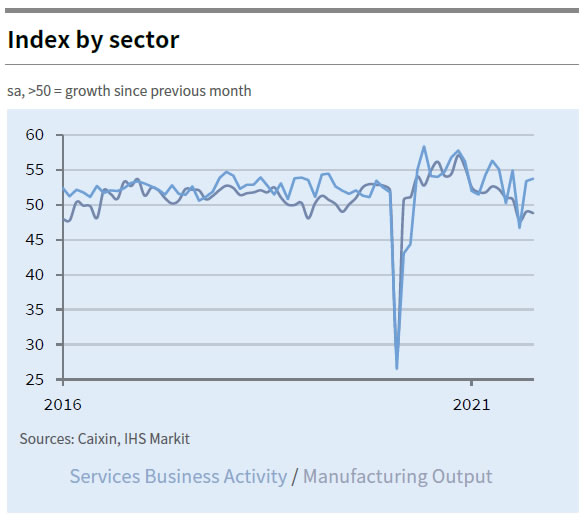
China Caixin PMI services rose to 53.8, composite rose to 51.5
China Caixin PMI Services rose to 53.8 in October, up from 53.4, above expectation of 53.6. PMI Composite ticked up to 51.5, from 51.4.
Wang Zhe, Senior Economist at Caixin Insight Group said: "As the number of new Covid-19 cases dropped from late September to the middle of October, related disruption faded and market demand recovered while supply was relatively weak. Manufacturing was significantly weaker than services.
"Supply strains became the paramount factor affecting the economy. Shortages of raw materials and soaring commodity prices, combined with electricity supply problems, created strong constraints for manufacturers. Those factors also had a significant impact on services enterprises.
"Input costs for manufacturers have risen much faster than their output prices for several months. The growth rate of input costs for service providers was also higher than that for prices they charged, putting pressure on downstream enterprises."
Fed to announce tapering, some previews
FOMC monetary policy decision is the major focus today, as Fed should finally make a formal announcement on QE tapering. As the September minutes indicates, the pace would be "monthly reductions in the pace of asset purchases, by US$10B in the case of Treasury securities and US$5B in the case of agency mortgage-backed securities (MBS)". The would eventually lead to completion of entire asset purchases by mid -2022. But, a hawkish surprise – monthly reduction at a faster pace – cannot be ruled out given the inflationary pressure.
Also, September's dot plot revealed that half of the members had anticipated a rate hike in 2022. Meanwhile, the market has priced in futures have priced in over 60% of a rate hike by June next year. But Fed Chair Jerome Powell would likely reiterate that decision on interest rate is complete separated from that of asset purchases. There wouldn't be any new hint on the timing of rate hike until December's dot plot.
Suggested readings on Fed
- FOMC Preview – Tapering to Formally Begin
- FOMC Preview: It's Time To Taper
- Fed Research Preview: Tapering, Yes, But How Fast?
- October Flashlight for the FOMC Blackout Period
Also featured
Eurozone will release unemployment rate in European session while UK will release PMI services final. US will release ADP employment, ISM services and factory orders too.
USD/CAD Daily Outlook
Daily Pivots: (S1) 1.2377; (P) 1.2401; (R1) 1.2434; More...
Intraday bias in USD/CAD remains neutral as consolidation from 1.2286 is still extending. Outlook is unchanged that in case of stronger recovery, upside should be limited by 1.2497 resistance. On the downside, break of 1.2286 will resume the fall from 1.2947 to 161.8% projection of 1.2947 to 1.2492 from 1.2894 at 1.2158 next. However, firm break of 1.2497 will turn bias back to the upside for stronger rebound.
In the bigger picture, the rejection by 38.2% retracement of 1.4667 to 1.2005 at 1.3022 argues that rebound from 1.2005 is merely a corrective rise, which is complete. More importantly, the down trend from 1.4667 (2020 high) is not over yet. Sustained break of 1.2005 will extend the down trend to next long term fibonacci level at 61.8% retracement of 0.9406 to 1.4689 at 1.1424. In any case, outlook will not turn bullish as long as 1.2947 resistance holds.
Economic Indicators Update
| GMT | Ccy | Events | Actual | Forecast | Previous | Revised |
|---|---|---|---|---|---|---|
| 21:30 | AUD | AiG Performance of Construction Index Oct | 57.6 | 53.3 | ||
| 21:45 | NZD | Employment Change Q3 | 2.00% | 0.40% | 1.00% | |
| 21:45 | NZD | Unemployment Rate Q3 | 3.40% | 3.90% | 4.00% | |
| 21:45 | NZD | Labour Cost Index Q/Q Q3 | 0.70% | 0.80% | 0.90% | |
| 00:30 | AUD | Building Permits M/M Sep | -4.30% | -2.00% | 6.80% | 7.60% |
| 01:45 | CNY | Caixin Services PMI Oct | 53.8 | 53.6 | 53.4 | |
| 09:00 | EUR | Eurozone Unemployment Rate Sep | 7.40% | 7.50% | ||
| 09:30 | GBP | Services PMI Oct F | 58 | 58 | ||
| 12:15 | USD | ADP Employment Change Oct | 400K | 568K | ||
| 13:45 | USD | Services PMI Oct F | 58.2 | 58.2 | ||
| 14:00 | USD | ISM Services PMI Oct | 62 | 61.9 | ||
| 14:00 | USD | ISM Services Employment Index Oct | 53.3 | 53 | ||
| 14:00 | USD | Factory Orders M/M Sep | -0.10% | 1.20% | ||
| 14:30 | USD | Crude Oil Inventories | 1.9M | 4.3M | ||
| 18:00 | USD | Fed Interest Rate Decision | 0.25% | 0.25% | ||
| 18:30 | USD | FOMC Press Conference |
Market Morning Briefing: Aussie Is Holding Below 0.7550
STOCKS
Dow and Dax have limited scope on the upside and could see some profit taking soon. Dow and Dax can fall from 36100 and 16000/400 respectively. Nikkei can test 30000 while Shanghai has already broken below 3500 which if sustains can drag the index to 3400 soon. Nifty ad Sensex are likely to be ranged within 17600-18000/200 and 60000-61000 respectively.
Dow (36052.63, +138.79, +0.39%) has broken the resistance at 36000 but could face some profit taking near 36100 and fall in the near term. View would turn bullish on a break above 36100, if seen.
DAX (15954.45, +148.16, +0.94%) has risen sharply today and has broken the resistance at 15900. While above 15900 a test of 16000/16400 is possible before we see a dip from there in the medium term. On Dax also some profit taking can be expected within 16000-16400 range.
Nikkei (29520.90, -126.18, -0.43%) is closed today for cultural day. While above 29500, the view remains bullish to see a rise towards 30000/31000 eventually.
Shanghai (3491.04, -14.58, -0.42%) has fallen finally breaking below 3500 contrary to our expectation. While below 3500, view is bearish for a fall towards 3400 if an immediate rise is not seen.
Nifty (17888.95, -40.70, -0.23%) went up to test 18012.25 before falling down from there; the index can consolidate between 17600-18000 before we see a rise above 18000.
Sensex (60029.06, -109.40, -0.18%) closed above 60000 yesterday. While above 60000 the view remains bullish to see 61000/62000 on the upside if the index does not fall back below 60000 immediately.
COMMODITIES
Markets await the US API weekly crude inventory report today and OPEC meeting due tomorrow to see how the crude prices move. Gold has fallen and could remain within 1810-1760 while Silver can fall to 23 or 22.50 if it does not bounce back immediately. A broader range of 22.50/23-25 may hold for the coming weeks. Copper is bullish while above crucial support at 4.30.
Brent (83.38) and WTI (82.36) have dipped ahead of the OPEC meeting due tomorrow. The OPEC has rejected Biden’s call to raise oil production faster and help reduce gasoline prices which are at multi-year highs of $3.70 per gallon. The OPEC members and allies are not in favour of this and instead would want a gradual increase in oil production as they think markets are well balanced. Oil prices also trade lower as analysts expect a rise in API weekly inventory report by 1.6mln barrels. We need to see if the oil prices falls below 83 after the OPEC meet tomorrow or continues to hold higher.
Gold (1782.90) and Silver (23.47) have fallen sharply on rise in US Dollar. While Gold could possibly trade within a broad range of 1810-1760, Silver has broken below 23.50 and if it does not bounces back immediately, it may fall to 23 or even to 22.50 before a bounce is seen from there.
Copper (4.3560) has fallen to test support at 4.30 which if holds can produce a bounce towards 4.50/55 in the near term. View is bulish to see a rebound while above 4.30.
FOREX
Dollar Index trades higher but needs to rise beyond 94.30/60 to become more bullish for the near term. Euro can fall eventually to 1.15-1.14 in the next few weeks. EURJPY is ranged within 133.50-131.50 while Aussie and Pound are bearish for a fall towards 0.7399/75 and 1.3550 respectively. Dollar Yen can remain within 113-115 region while USDINR can fall towards 74.50/40 while below 74.75/70. Markets await FOMC meeting tonight and US NFP data on Friday.
Dollar Index (94.06) has risen but needs to break above 94.3-94.60 in order to turn further bullish on the upside. While below 94.60, we may expect a range of 94.60-93 to hold.
Euro (1.1583) rose slightly to 1.1614 yesterday but has fallen again below 1.16. View is bearish for a fall to 1.15-1.14 over the next few weeks.
EURJPY (131.82) is holding within 131.50 and 133.50 and unless a break on either side is seen, it would be difficult to say which way it would move in the longer run. Watch price action within the mentioned range.
Aussie (0.7428) is holding below 0.7550 and has fallen sharply. A further fall towards 0.7399-0.7375 looks possible in the near term.
Pound (1.3626) needs to hold above 1.36 to bounce back to 1.37 in the near term. 1.36-1.3550 is an immediate support below current levels from where a corrective bounce looks likely.
Dollar-Yen (113.84) is in a sideways range of 113-115 which is likely to hold for some more sessions before a break on either side is seen.
USDCNY (6.3996) may remain ranged within 6.3750/38-6.42 for the near term.
USDINR (74.6825) has broken below 74.75/70 and while that sustains, there is scope for a fall towards 74.50/40 before any rebound is seen from there. View is bearish just now while below 74.75/70. On the upside, 75.00/25 is a strong resistance.
INTEREST RATES
US Treasury Yields have come-off sharply at the near-end (2Yr and 5Yr) while those at the far-end (10Yr and 30Yr) remain stable ahead of the US Federal Reserve meeting outcome tonight. For now, a broad range of trade looks possible and will have to see on which side the yields breakout. The German Yields are coming down across tenors as expected except the 30Yr which is also likely to fall in the coming days as it has a key resistance ahead. The 10Yr and 5Yr GoI have come down within their range. The sideways consolidation is likely to continue for some more time.
The US 2Yr (0.45%) and the 5Yr (1.15%) Treasury yields have come down sharply while the 10Yr (1.55%) and the 30Yr (1.95%) remain stable ahead of the US Federal Reserve meeting outcome tonight. 1.55%-1.5% on the 10Yr and 1.9%-1.85% on the 30Yr are key support which have to be broken to mark a reversal and see a fresh fall. On the upside, 1.7%-1.75% (10Yr) and 2.2% (30Yr) are the resistances that have to be broken to see a strong rally.
The German 2Yr (-0.68%), 5Yr (-0.48%) and the 10Yr (-0.17%) yields have declined sharply while the 30Yr (0.17%) remains stable and higher. The 10Yr is coming down towards the lower end of its -0.1%/-0.2% range. We expect it to break below -0.2% and fall to -0.3% and -0.4% in the coming weeks. The 30Yr has resistance at 0.2% which is likely to hold and trigger a pull-back towards 0.1%-0.05% in the coming weeks.
The India 10Yr GoI (6.3599%) has come-off yesterday and can oscillate within the 6.3%-6.4% range for some mor time. From a bigger picture 6.43%-6.45% will be a crucial resistance. While that holds, a fall to 6.2% and lower levels over the medium-term will be on the cards. A break below 6.3% will pave way for that fall.
The 5Yr (5.7296%) GoI has stuck in between 5.7% and 5.78%. A breakout on either side of this range will give a clear cue on whether the yield can move up to 5.82%-5.85% or fall to 5.66% and lower.
Crude Oil Price Faces Key Resistance Near $85
Key Highlights
- Crude oil price is struggling to settle above $84.00.
- It broke a major bullish trend line with support near $83.15 on the 4-hours chart of XTI/USD.
- EUR/USD is still trading well below the 1.1650 resistance zone.
- GBP/USD is slowly moving lower below 1.3720.
Crude Oil Price Technical Analysis
Crude oil price started a steady increase above $80.00 against the US Dollar. The price surpassed the $82.00 resistance to move into a positive zone.
Looking at the 4-hours chart of XTI/USD, the price even settled above $82.50, the 100 simple moving average (4-hours, red) and the 200 simple moving average (4-hours, green).
The price gained pace above the $84.00 level, but it struggled to clear the $85.00 resistance. A high was formed near $85.16 before there was a downside correction. There was a break below the $84.50 support zone.
The price traded the 50% Fib retracement level of the upward move from the $81.74 swing low to $85.16 high. There was also a break below a major bullish trend line with support near $83.15 on the same chart.
An immediate support on the downside is near the $82.50 level. The first major support is near $82.20. Any more losses could open the doors for a move towards the $81.50 support.
On the upside, an initial resistance is near the $83.50 level. The next major resistance is near the $84.00 level, above which the price could rise towards the $85.00 level.
Looking at EUR/USD, the pair failed to recover above 1.1650 and it remains at a risk of more downsides. Besides, GBP/USD could extend losses below 1.3600.
Economic Releases to Watch Today
- US Services PMI for Oct 2021 – Forecast 58.2, versus 58.2 previous
- US ISM Services Index for Oct 2021 – Forecast 62.0, versus 61.9 previous
- US ADP Employment Change for Oct 2021 - Forecast 400K, versus 568K previous.
Elliott Wave View: DAX Finishing Wave 5
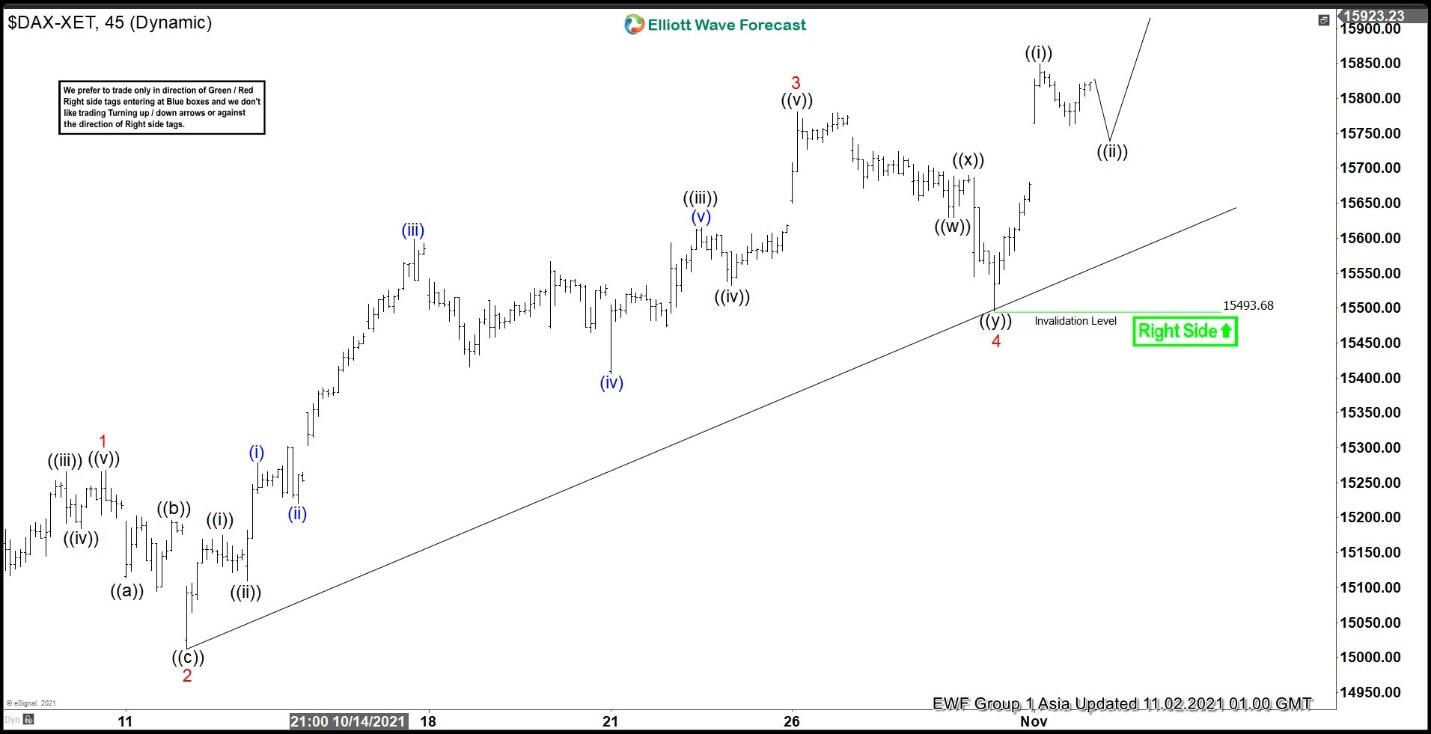
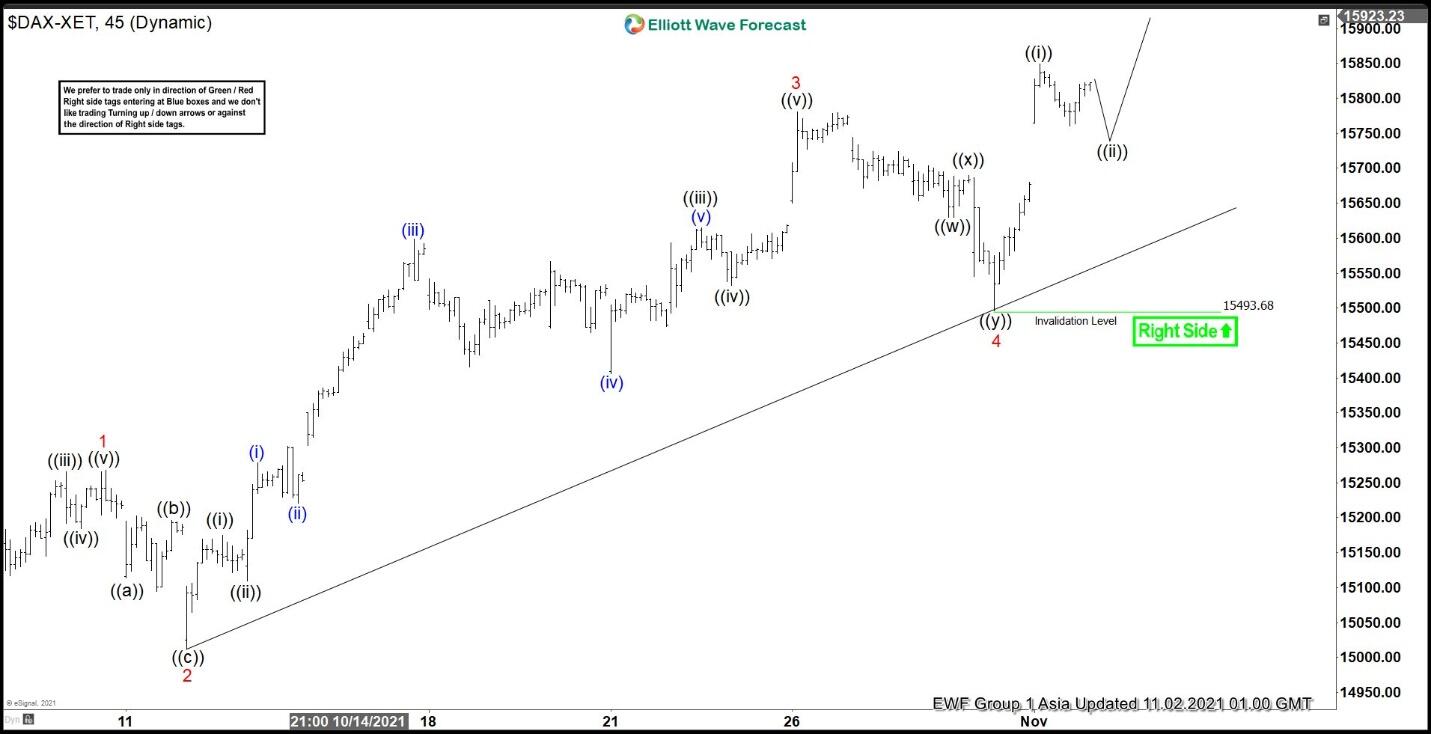
Short-term Elliott wave view in DAX suggests the rally from October 6, 2021 low is in progress as a 5 waves impulse. Up from there, wave 1 ended at 15267.92 and pullback in wave 2 ended at 15012.07. The Index then extended higher in wave 3 towards 15781 with internal subdivision as 5 waves in lesser degree. Up from wave 2, wave ((i)) ended at 15174.29 and pullback in wave ((ii)) ended at 15019.61. Index then extends higher in wave ((iii)) towards 15614.76, dips in wave ((iv)) ended at 15531.95, and final leg higher wave ((v)) of 3 ended at 15781.
Wave 4 pullback ended at 15495.51 with internal as a double three. Down from wave 3, wave ((w)) ended at 15629.33, wave ((x)) ended at 15690.23, and wave ((y)) ended at 15493.68. Index has resumed higher in wave 5 with internal as another impulse. Up from wave 4, wave ((i)) ended at 15849.40 and dips in wave ((ii)) ended at 15760.35. Index could be doing a nest within wave ((iii)) and near term, expect wave (i) of ((iii)) to end soon and Index to pullback in wave (ii) of ((iii)) before turning higher again. Near term, as far as pivot at 15493.68 low stays intact, expect dips to find support in 3, 7, or 11 swing for further upside.
DAX 45 Minutes Elliott Wave Chart
Fed to announce tapering, some previews
FOMC monetary policy decision is the major focus today, as Fed should finally make a formal announcement on QE tapering. As the September minutes indicates, the pace would be "monthly reductions in the pace of asset purchases, by US$10B in the case of Treasury securities and US$5B in the case of agency mortgage-backed securities (MBS)". The would eventually lead to completion of entire asset purchases by mid -2022. But, a hawkish surprise – monthly reduction at a faster pace – cannot be ruled out given the inflationary pressure.
Also, September's dot plot revealed that half of the members had anticipated a rate hike in 2022. Meanwhile, the market has priced in futures have priced in over 60% of a rate hike by June next year. But Fed Chair Jerome Powell would likely reiterate that decision on interest rate is complete separated from that of asset purchases. There wouldn't be any new hint on the timing of rate hike until December's dot plot.
Suggested readings on Fed
China Caixin PMI services rose to 53.8, composite rose to 51.5
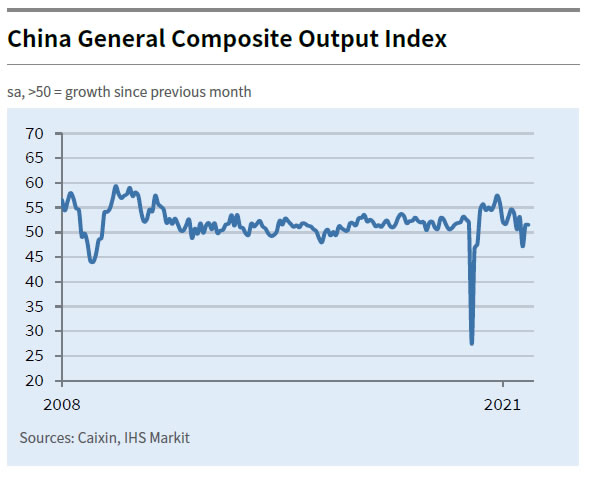
China Caixin PMI Services rose to 53.8 in October, up from 53.4, above expectation of 53.6. PMI Composite ticked up to 51.5, from 51.4.
Wang Zhe, Senior Economist at Caixin Insight Group said: "As the number of new Covid-19 cases dropped from late September to the middle of October, related disruption faded and market demand recovered while supply was relatively weak. Manufacturing was significantly weaker than services.
"Supply strains became the paramount factor affecting the economy. Shortages of raw materials and soaring commodity prices, combined with electricity supply problems, created strong constraints for manufacturers. Those factors also had a significant impact on services enterprises.
"Input costs for manufacturers have risen much faster than their output prices for several months. The growth rate of input costs for service providers was also higher than that for prices they charged, putting pressure on downstream enterprises."
New Zealand unemployment dropped to record low 3.4% in Q3
New Zealand employment rose 2.0% qoq in Q3, much better than expectation of 0.4% qoq. Growth was largely driven by full-time jobs, which increased 2.3% qoq or 50k, while part-time jobs dropped slightly. Unemployment rate dropped sharply from 4.0% to 3.4%, better than expectation of 3.9%. The total employment matched the lowest level on record, reached last time in 2007. Labor force participation rate rose 0.7% to 71.2%.
"The fall in the unemployment rate is in line with reports of difficulty finding workers and high labour turnover, and continued travel restrictions on international arrivals, which put pressure on domestic labour supply," work and wellbeing statistics senior manager Becky Collett said.
Australia AiG construction rose to 57.6, healthy leap in activity
Australia AiG Performance of Construction rose 4.3 pts to 57.6 in October. Looking at some details, activity rose 15.4 to 65.2. Employment dropped -0.2 to 56.8. New orders dropped -0.2 to 58.7. Supplier deliveries dropped -1.3 to 41.3. Input prices dropped -1.2 to 97.2. Selling prices dropped -0.5 to 78.3. Average wages dropped -1.5 to 75.1.
Ai Group Head of Policy, Peter Burn, said: "The healthy leap in activity levels across the Australian construction sector in October is a taste of what is expected to be a strong rebound for the broader economy over the next few months as New South Wales, Victoria and the ACT, liberated from COVID restrictions, catch up with the rest of the country and as barriers to the movement of people within Australia are removed."