Sample Category Title
USD/CHF Mid-Day Outlook
Daily Pivots: (S1) 0.9063; (P) 0.9118; (R1) 0.9146; More....
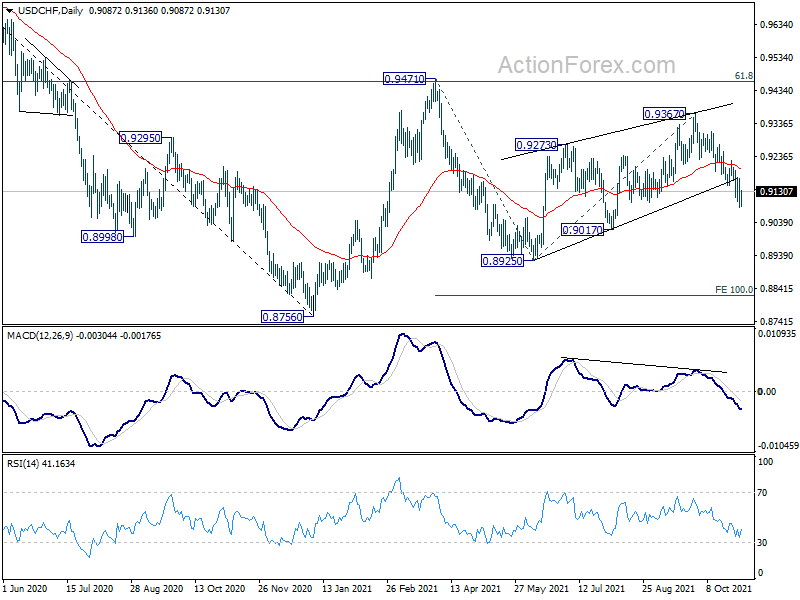
As long as 0.9174 resistance holds, fall from 0.9367 is still in progress for 0.9017 support first and then 0.8925. On the upside, however, break of 0.9174 resistance will indicate short term bottoming and turn bias back to the upside for stronger rebound instead.
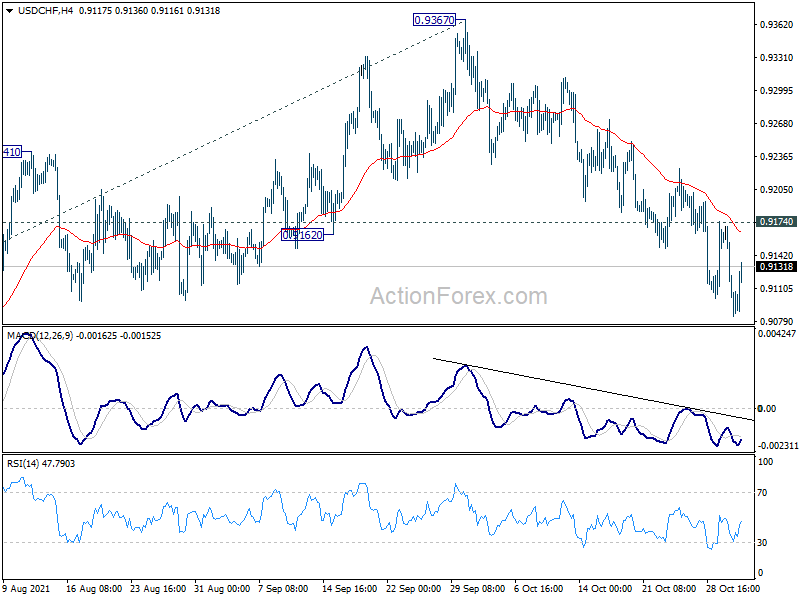
In the bigger picture, the corrective structure of the rebound from 0.8925 argues that fall from 0.9471 is not complete yet. It could either be the second leg of pattern from 0.8756 (2021 low), or resuming larger down trend from 1.0237 (2018 high). We'd pay attention to the downside momentum and assess the odds later. But for now, medium term outlook will be neutral at best as long as 0.9471 resistance holds.
USD/JPY Mid-Day Outlook
Daily Pivots: (S1) 113.81; (P) 114.13; (R1) 114.31; More...
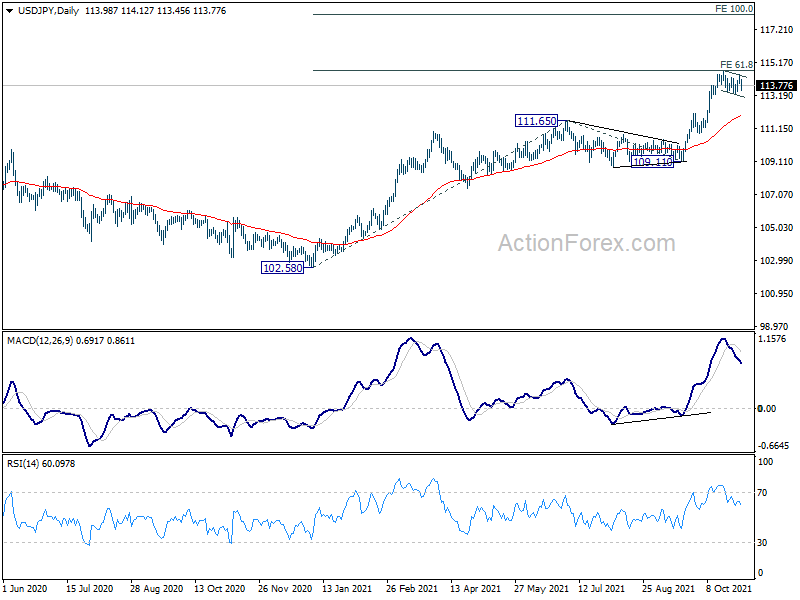
USD/JPY is staying in range of 113.24/114.69 and intraday bias remains neutral first. On the upside, firm break of 114.69 will resume the larger up trend to 100% projection of 102.58 to 111.65 from 109.11 at 118.18 next. Break of 113.24 will bring deeper pull back, but downside should be contained above 112.07 resistance turned support to bring rebound.
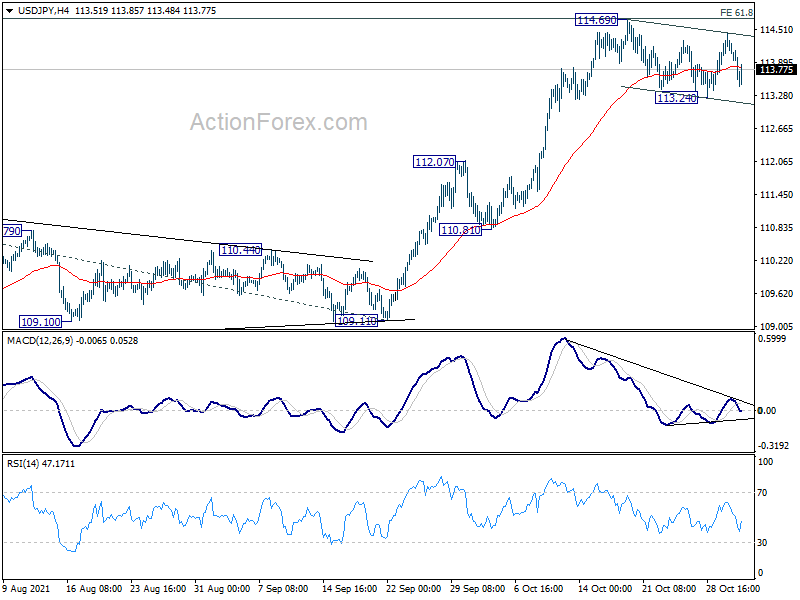
In the bigger picture, corrective decline from 118.65 (2016 high) should have completed at 101.18 already. Rise from the 102.58 is seen as the third leg of the up trend from 101.18. Next target is 114.54 resistance and then 118.65 high. This will now be the preferred case as long as 109.11 support hold, even in case of deep pull back.
Yen Extended Rebound as German Yield Dives, But Lacks Follow Through Buying
Yen extended rebound in European session following the sharp fall in benchmark Germany yield. But struggling to extend gain as markets enter into US session. Overall markets are mixed as investors are probably turning cautious ahead tomorrow's FOMC policy decision. As for today, Aussie remains the worst performing one after post RBA selloff, followed by Kiwi, and Swiss Franc. On the other hand, Yen is strongest, followed by Dollar and then Euro.
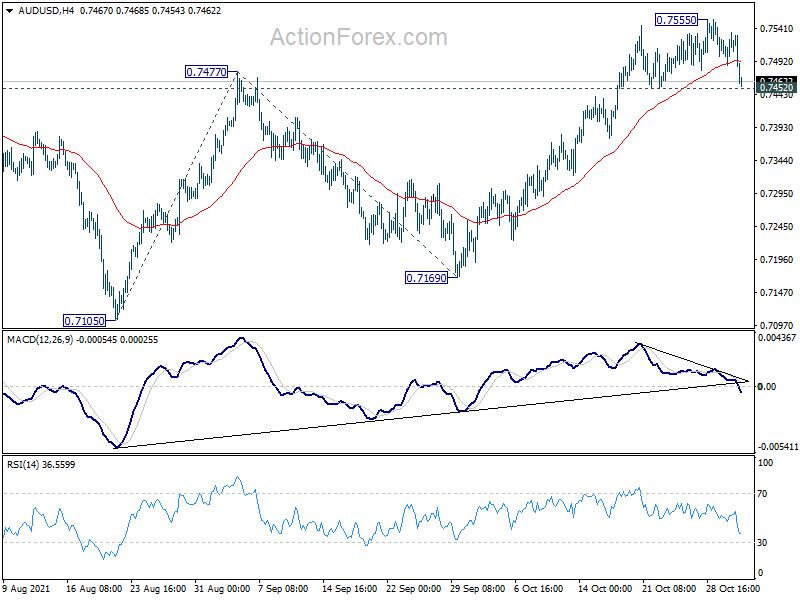
Technically, we'd pay attention to whether Aussie's selloff would extend further. AUD/USD is currently pressing 0.7452 minor support while AUD/JPY is pressing 84.59. Break of these levels will extend the near term correction lower. However, rebound from current levels would keep the consolidations brief, with breaks of 0.7555 and 86.24 highs sooner rather than later.
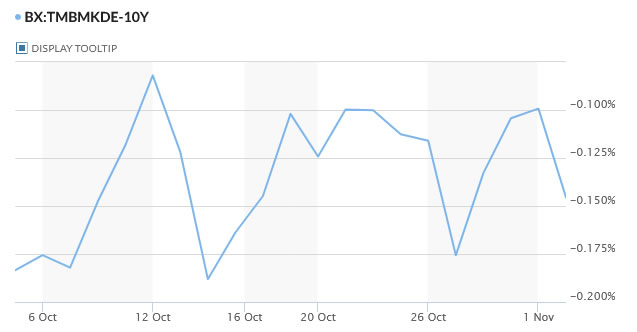
In Europe, at the time of writing, FTSE is down -0.52%. DAX is up 0.70%. CAC is up 0.27%. Germany 10-year yield is down -0.047 at -0.146. Earlier in Asia, Nikkei dropped -0.43%. Hong Kong HSI dropped -0.22%. China Shanghai SSE dropped -1.10%. Singapore Strait Times rose 0.41%. Japan 10-year JGB yield dropped -0.0125 to 0.084.
Eurozone PMI manufacturing finalized at 58.3, worsening supply chain situation
Eurozone PMI Manufacturing was finalized at 58.3 in October, slightly down from September's 58.6. But that's still the lowest level since February. Readings of individual states remained generally strong: Netherlands at 62.5, Ireland at 62.1, Italy at 61.1, Austria at 60.0, Greece at 58.9, Germany at 57.8. Spain at 57.4, France at 53.6.
Chris Williamson, Chief Business Economist at IHS Markit said: "Eurozone manufacturers reported a worsening of the supply chain situation in October, which curbed production growth sharply during the month... These shortages have... pushed inflationary pressures to new survey highs, raising further questions about just how transitory the recent spike in inflation will be. Business confidence also lost some ground to hit a one-year low in October, as increasing numbers of producers grew concerned about the supply situation and the impact of rising costs and prices, adding to the indications that manufacturers face some challenging months ahead."
Germany PMI Manufacturing was finalized at 57.8 in October, down from September's 58.4, lowest level in nine months. Markit said that material shortages restrained output and new orders. Surging input costs drove record rise in factory gate charges. There was further slowdown in job creation as optimism waned.
France PMI Manufacturing was finalized at 53.6 in October, down from September's 55.0, hitting the lowest level since January. Markit said output level declined as firms struggled to secure necessary materials. Demand conditions showed signs of weakening amid supply constraints. Lead times lengthened at near-record pace and cost inflation were at decade high.
Swiss CPI rose to 1.2% yoy in Oct, retail sales rose 2.5% yoy in Sep
Swiss CPI came in at 0.3% mom, 1.2% yoy in October, above expectation of 0.1% mom, 1.1% yoy. Annual rate also accelerated from September's 0.9% yoy. The 0.3% increase compared with the previous month is due to several factors including rising prices for heating oil. Gas also recorded a price increase, as did fuel. In contrast, prices for salads and fruiting vegetables decreased.
Retail sales rose 2.5% yoy in September, above expectation of 1.4% yoy.
RBA abandons yield curve control, hints on earlier hike
RBA kept cash rate target unchanged at 0.10% as widely expected today. The asset purchase program, however, will continue at AUD 4B per week until at least February 2022. However, without much surprise, it discontinue 0.10% target for April 2024 government bonds, effectively abandoning yield curve control.
As for forward guidance, RBA maintain that cash rate won't be raised until actual inflation is "sustainably within the 2 to 3 per cent target range". But now, it forecasts inflation to be no higher than 2.50% at the end of 2023, hinting that rate hike could come earlier than that.
In the new economic projection, RBA expects GDP growth to b 3% in 2021, 5.50% in 2022, and 2.50% in 2023. Unemployment rate is expected to trend lower to 4.25% at the end of 2022 and 4.00% at the end of 2023. Inflation is projected to be at 2.25% over 2021 and 2022, and pick up to 2.20% over 2023.
USD/JPY Mid-Day Outlook
Daily Pivots: (S1) 113.81; (P) 114.13; (R1) 114.31; More...
USD/JPY is staying in range of 113.24/114.69 and intraday bias remains neutral first. On the upside, firm break of 114.69 will resume the larger up trend to 100% projection of 102.58 to 111.65 from 109.11 at 118.18 next. Break of 113.24 will bring deeper pull back, but downside should be contained above 112.07 resistance turned support to bring rebound.
In the bigger picture, corrective decline from 118.65 (2016 high) should have completed at 101.18 already. Rise from the 102.58 is seen as the third leg of the up trend from 101.18. Next target is 114.54 resistance and then 118.65 high. This will now be the preferred case as long as 109.11 support hold, even in case of deep pull back.
Economic Indicators Update
| GMT | Ccy | Events | Actual | Forecast | Previous | Revised |
|---|---|---|---|---|---|---|
| 21:45 | NZD | Building Permits M/M Sep | -1.90% | 3.80% | ||
| 23:50 | JPY | Monetary Base Y/Y Oct | 9.90% | 12.30% | 11.70% | |
| 23:50 | JPY | BoJ Minutes | ||||
| 03:30 | AUD | RBA Rate Decision | 0.10% | 0.10% | 0.10% | |
| 07:30 | CHF | Real Retail Sales Y/Y Sep | 2.50% | 1.40% | 0.50% | 0.80% |
| 07:30 | CHF | CPI M/M Oct | 0.30% | 0.10% | 0.00% | |
| 07:30 | CHF | CPI Y/Y Oct | 1.20% | 1.10% | 0.90% | |
| 08:45 | EUR | Italy Manufacturing PMI Oct | 61.1 | 59.7 | 59.7 | |
| 08:50 | EUR | France Manufacturing PMI Oct F | 53.6 | 53.5 | 53.5 | |
| 08:55 | EUR | Germany Manufacturing PMI Oct F | 57.8 | 58.2 | 58.2 | |
| 09:00 | EUR | Eurozone Manufacturing PMI Oct F | 58.3 | 58.5 | 58.5 | |
| 12:30 | CAD | Building Permits M/M Sep | 4.30% | 2.20% | -2.10% |
USD/CAD Finds Support In Trend Line
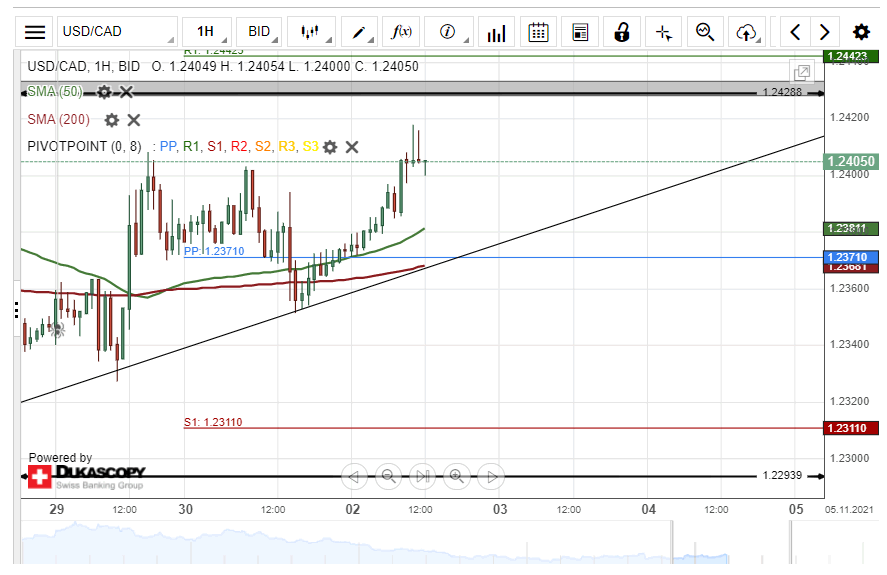
On Monday, the resistance of the 1.2400 held and caused a decline of the USD/CAD. However, during the mid-day hours of the day the rate found support in the ascending trend line of the October 27 and 29 low levels. The trend line provided enough support for a follow up surge to pass the 1.2400 mark.
If the surge of USD/CAD continues, it could aim at the late October high level at 1.2430. A passing of this resistance might result in a test of the weekly R1 simple pivot point at 1.2442.
Meanwhile, a decline of the pair could look for support in the 55-hour SMA at 1.2380, the weekly simple pivot point at 1.2371, the 200-hour SMA at 1.2370 and the supporting trend line of the recent low levels.
RBA Review – Ending Yield Curve Control and Pushed Forward First Rate Hike to 2023
The RBA tilted modestly to the hawkish side by formally ending the yield curve control and adjusting its forward guidance on the first rate hike. Policymakers remained optimistic over the economic outlook and were not very concerned about inflation. Aussie plunged as Governor Philip Lowe indicated that a lift-off in 2022 was "extremely unlikely". The focus has now turned to the updated economic projections due this Friday.
Economic Developments
The central bank remained optimistic over the economic outlook. It was confident that “setback to the economic expansion in Australia is expected to be only temporary”. Meanwhile, “as vaccination rates increase further and restrictions are eased, the economy is expected to bounce back”. On the flip side, it continued to warn of the “uncertainty about the timing and pace of the bounce-back”, adding that the recovery “is likely to be slower than that earlier in the year”. On the economic projections, the central bank forecast that GDP growth would reach +3% and +5.5% in 2021 and 2022, respectively, before easing to +2.5% in 2023. The job market will remain resilient with the unemployment rate down to 4.25% by end-2022 and 4% by end-2023.
On inflation, the central bank described that the core inflation was “still low”. However, it warned that “a further, but only gradual, pick-up in underlying inflation is expected”. The staff projected that underlying inflation would be about +2.25% in this year and in 2022, before climbing slightly higher to +2.5% in 2023. With inflation hovering about the midpoint of RBA’s target, the prospect of a rate hike does not seem to be imminent.
Monetary Policy
While leaving the cash rate target unchanged at 0.1%, the RBA formally scrapped yield curve control- a policy that targets the 3-yield AGB yields at 0.1%. At the press conference, Governor Philip Lowe stressed that the move was due to "risk management" considerations and did not "reflect a view that the cash rate will be increased before 2024”.
On the forward guidance, the central bank reaffirmed that it would not raise the policy rate until “actual inflation is sustainably within the 2 to 3% target range”. The members projected that it’s “possible” in 2023, earlier than previous estimate that “this condition will not be met before 2024”. As he Lowe suggested, "it is still entirely possible that the cash rate will remain at its current level until 2024. But it is also possible that an earlier move will be appropriate. Given this, the Board judged that there were more costs than benefits in seeking to anchor the yield on the April 2024 bond at 10 bps”. Concerning market expectations of a rate hike next year, Lowe noted that it's "extremely unlikely" and current market pricing as "a complete over-reaction to the latest inflation data". While acknowledging that "some other central banks are raising rates", Lowe suggested Australia's situation is different due to the longstanding relatively weaker wage dynamics and less exposure to pressures to rising global energy costs.The RBA maintained the QE purchases at AUD4B/week until at least mid February 2022.
Oil Looks To OPEC+, Gold Rises
Oil faces challenges this week
Oil’s rally resumed overnight on a modest scale as physical buyers continued to appear on the dip and the US dollar weakened. Oil looks very much like it is going to range trade ahead of the OPEC+ meeting on Thursday although pre-meeting rumours will lead to some intraday volatility. Brent crude rose 1.10% to USD 84.50, and WTI rose 0.65% to USD 83.80 a barrel. In Asia, both contracts have moved another 0.50% higher to USD 84.90 and USD 84.15 a barrel.
The oil rally faces some headwinds this week and I note that Brent crude its downside breakout on Friday from a technical perspective. Although I do not believe OPEC+ will succumb to pressure and raise production quotas by more than the previously agreed 400k barrels, they have surprised markets before. If they do raise production, the kneejerk sell-off could see oil fall by up to 10%.
Brent crude has resistance at USD 85.10 a barrel and then USD 86.00 a barrel. Support is at USD 82.20, and fail could see it retest USD 80.00 a barrel. WTI looks more constructive, holding trendline support, today at USD 82.10 a barrel. It has resistance at USD 84.75 and then USD 85.50 a barrel. Below USD 82.10, USD 80.50 is a critical area of support, followed by USD 79.50.
Gold rises on weaker US dollar
Gold recouped some losses overnight thanks to a weaker US dollar. Gold rose 0.55% to USD 1793.00 before easing slightly to USD 1791.50 in Asia. With a heavy week of data and event risk ahead, the balance of probabilities has now shifted back to the downside for gold, unless the US dollar was, for some reason, to collapse this week. Time and again, gold investors have shown little to no appetite or ability to wear even the slightest pain on long positions above USD 1800.00 an ounce.
Gold now has resistance in the USD 1810.00 to USD 1815.00 an ounce region, with the far more formidable, and critical, USD 1832.00 to USD 1835.00 remaining far from reach for now. On the downside, gold fell through its one-month trendline support at USD 1787.60 on Friday, and its 100 and 200-day moving averages. The long capitulation saw gold fall to USD 1772.00 an ounce intra-day on Friday, and that forms initial support now. That is followed by USD 1760.00 and USD 1745.00 an ounce.
NZD/JPY Bullish SHS Pattern: Uptrend Continues After Retracement
NZD/JPY technical analysis
- NZD/JPY is in uptrend.
- Market is having a retracement.
- M L3 camarilla pivot is support.
- Uptrend i expected to continue.
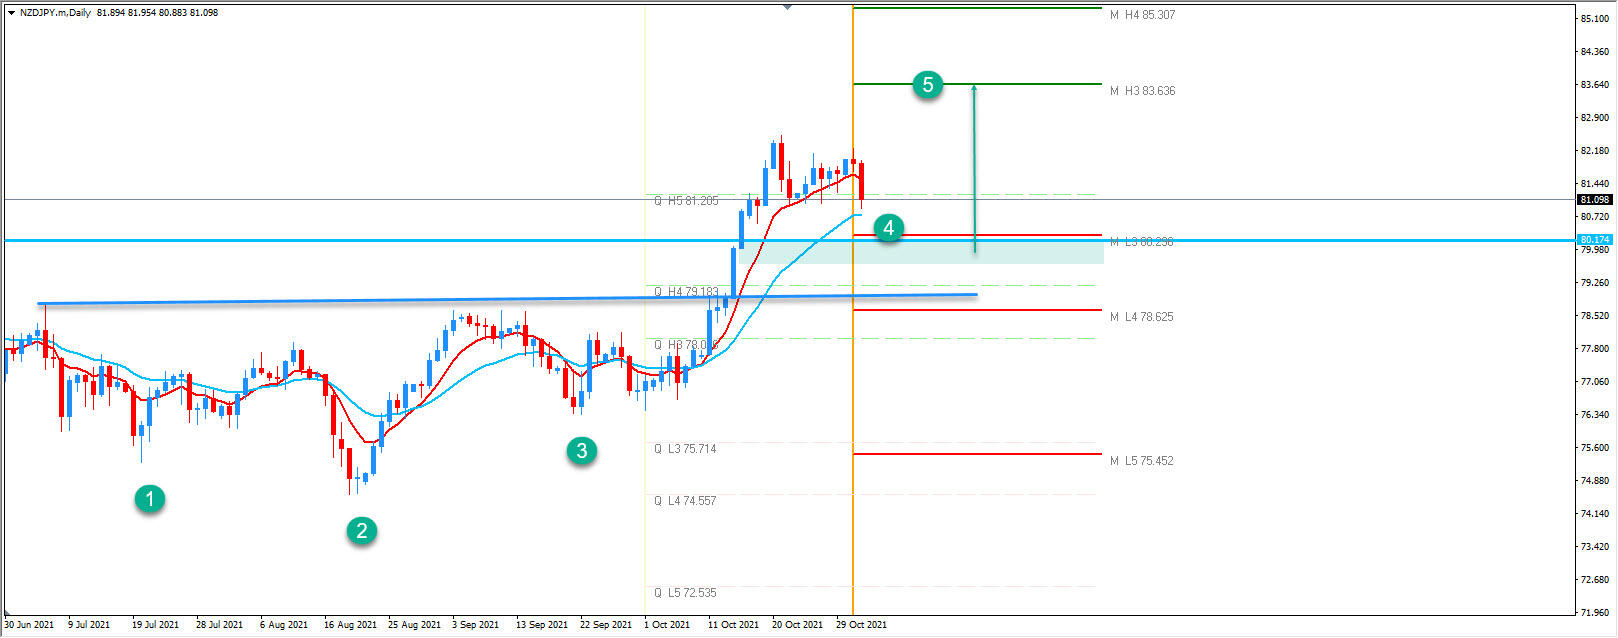
- Left shoulder.
- Head.
- Right shoulder.
- Bouncing zone.
- Target.
The price is bullish. However, the pair is retracing and we could estimate the end of a retracement currently around the M L3 camarilla pivot -80.29. However, the JPY is getting strong and this could be only due to the ADP and NFP this week. Positioning is done at important s/r levels prior to the NFP as all JPY and USD markets will be affected. If the daily shows a reversal pattern at the bottom, look for buying the dip. Targets are 81.20 followed by 82.20 and 83.63.
GBP/JPY Breaks Pattern
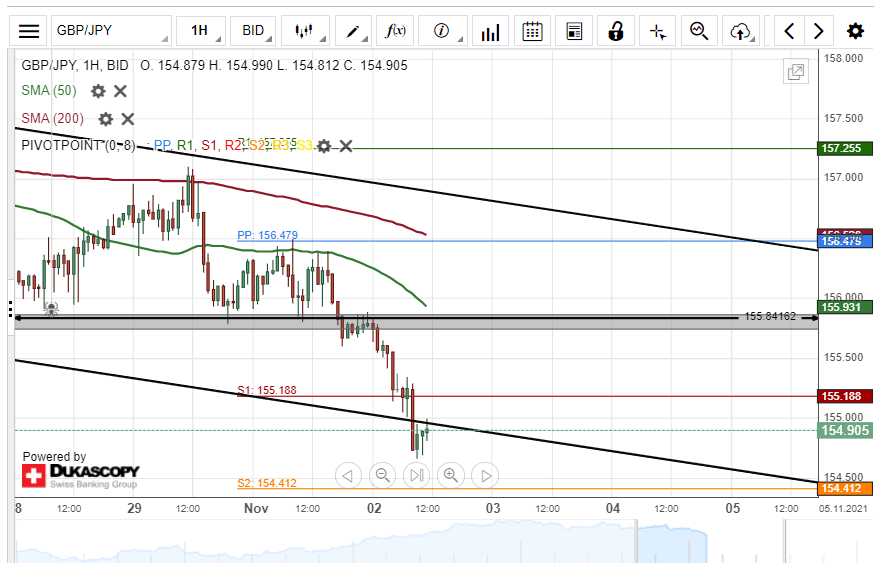
On Tuesday morning, the GBP/JPY currency exchange rate passed below the lower trend line of the channel down pattern, which guided the rate throughout the second part of October.
If the breaking of the pattern would be followed up by a decline, the rate could look for support in the 154.50 level and the weekly S2 simple pivot point at 154.41.
However, a recovery of the rate might find resistance in the weekly S1 simple pivot point at 155.19. Above the pivot point, the 155.73/155.90 zone could act as resistance. In addition, the 55-hour SMA might strengthen the resistance.
AUD/USD Drops Due To Central Bank
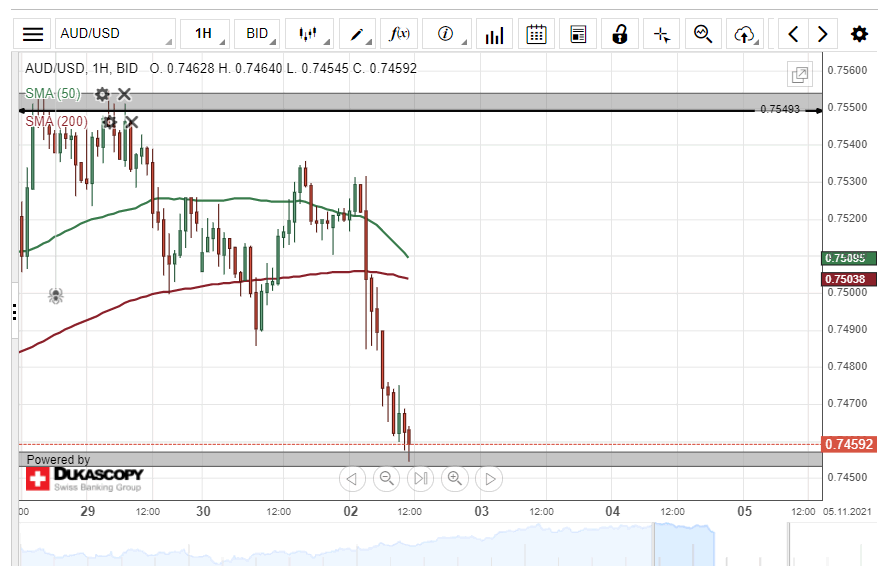
On November 2, the Reserve Bank of Australia published its Rate Statement. On the announcement, at 03:30 GMT, the AUD/USD increased volatility by bouncing around in a 28 pip range before declining 34 base points. During the seven hours following the announcement, the rate had already lost 64 base points.
At mid-day on Tuesday, the currency exchange rate's decline had paused at the late October low level zone at 0.7453/0.7458.
If the AUD/USD passes the October low level zone, it could look for support in the 0.7430/0.7440 zone, which has been providing both resistance and support in the past.
A potential recovery of the pair might reach the 0.7500 mark. This level has impacted the rate on its own. However, on Tuesday, the 0.7500 mark was expected to be strengthened by the 55 and 200-hour simple moving averages.
EUR/JPY Pierces Support Zone
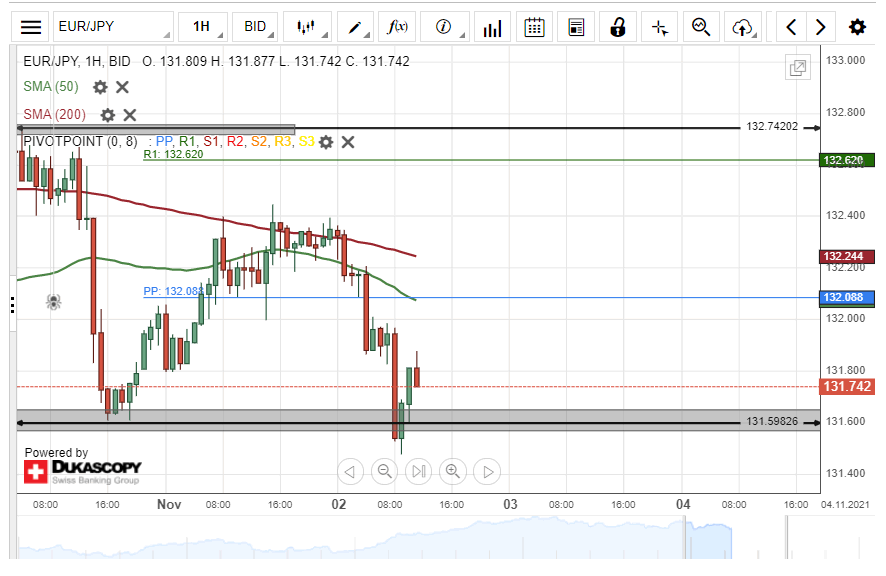
Despite being passed a couple of times, the 200-hour simple moving average together with the 55-hour simple moving average managed to cause a decline of the EUR/JPY currency exchange rate. On Tuesday, the rate's decline had passed the support zone at 131.57/131.66 and pierced the 131.50 mark.
In the case that the rate continues to decline, it could aim at the support of the weekly S1 simple pivot point at 131.26. Afterwards, the weekly S2 at 130.73 and the 130.70 mark might serve as support levels. Note that the 130.70 mark acted as resistance in September and support in October.
On the other hand, a recovery of the pair might find resistance in the weekly simple pivot point at 132.09 and the 55-hour simple moving average. Above these two levels, the 200-hour SMA might provide resistance at 132.25. Higher above, the weekly R1 at 132.62 would highly likely act as a resistance.