Sample Category Title
USD/CAD Elliott Wave View: Entering Into A Wave Five Lower
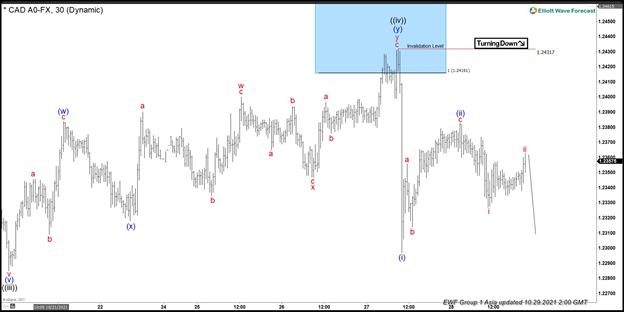
Short-term Elliott wave view in USDCAD suggests that the decline from September 20, 2021, high is unfolding as an impulse structure favoring some more downside. Down from 9/20/2021 high, wave ((i)) ended in 5 waves at $1.2590 low. Wave ((ii)) ended at $1.2774 high, and wave ((iii)) ended in 5 waves at 1.2309 low. Then above from there, the pair made a bounce in wave ((iv)) in a shorter cycle. The internals of that bounce unfolded as a double three structure.
Whereas the initial 3 waves bounce to $1.2383 ended wave (w). Then a pullback to $1.2318 low ended wave (x). Up from there, the pair started the (y) leg higher & reached the 100%-161.8% Fibonacci extension area of (w)-(x) at $1.2416- $1.2476 blue box area. The pair got rejected within the blue box area & ended (y) leg at $1.2431 high thus completing the wave ((iv)) bounce. Below from there, we believe wave ((v)) has started lower where lesser degree wave (i) ended at $1.2297 low. And wave (ii) ended at $1.2382 high. Near-term, as far as bounces fail below $1.2382 high and more importantly below $1.2431 high the pair is expected to see more downside towards $1.2248- $$1.2191 inverse 123.6%- 161.8% Fib ext area of ((iv)) minimum. Before the pair completes its 5 waves impulse sequence from 9/20/2021 high & does a bounce.
USD/CAD 1 Hour Elliott Wave chart
EMU Inflation Will Probably Make Another Dent In The ECB’s Temporary Narrative
Markets
Yesterday's ECB in a nutshell: The central bank keeps ignoring persistent inflationary pressures but markets don't. Investors assume the longer Frankfurt withholds a policy response, the tougher it'll have to react eventually. This prompted (real!) German yields to rise in the wake of the meeting. Two additional elements aided the yield jump. First, despite having several strong arguments at her disposal, Lagarde only very modestly pushed back against markets pricing in rate hikes at the end of 2022. Secondly, the ECB chair was for the first time pretty vocal on PEPP formally ending in March, even before the actual discussion in December. The German yield curve bear steepened with changes going from +2.3 bps (2y) to 4.2 bps (10y). Peripheral spreads rose as much as 7 bps in Italy. Caught in the slipstream, US yields rose at the long end of the curve while the shorter end faced conflicting signals from below-consensus US Q3 growth. Changes ranged from -1.3 bps (2y) to 3.8 bps (10y). With the euro enjoying real rate support and the USD in the defensive on growth and the upbeat sentiment, EUR/USD jumped from the 1.16 support zone beyond first resistance of 1.1664 (August low) to close at 1.1681. The trade-weighted DXY gave up mirror support at 93.73 (August high) again. The stronger euro propelled EUR/GBP north of 0.845 and to a test of 0.8472 (April interim low).
Barring disappointing Japanese data and the RBA again looking away from the yield on its reference bond again soaring 25 bps (see below), Asian-Pacific news is scant. Stocks trade mixed with Australia underperforming. Core bonds continue yesterday's correction lower. The Japanese yen together with the US dollar is marginally firmer. EUR/USD sticks north of 1.1664 though.
Today's EMU inflation will probably make another dent in the ECB's temporary narrative. Headline price increases are seen accelerating to 3.7% y/y. Core inflation might stabilize at 1.9%. Yesterday's strong readings in Germany and especially Spain suggest upside risks. We wouldn't exclude a positive surprise in European GDP numbers either (2.1% q/q expected) given the strong French beat this morning (3% q/q vs 2.2% with even an upward revision to Q2). That would bring about the perfect environment for (real) European yields to continue yesterday's rebound from the historical lows and flavour euro trading. We're looking at first resistance in EUR/USD at 1.1695/1.1708 (38% retr. 2020 low – 2021 high/March 2021 interim low) followed by the 1.175 area. We assume trading in EUR/GBP will be driven in similar fashion. We're watching 0.8472 as a first resistance here.
News headlines
Italian Prime Minister Mario Draghi proposed the 2022 budget, aiming to reduce the budget deficit while at the same time reducing taxes and raising the retirement age. From €12 bln of tax reductions €8 bln of corporate and tax cuts for individuals aim to reduce the tax wedge between what employers pay and the final amount that employees receive. In a longer term perspective, Draghi indicated that tax cuts could amount to € 40 bln over the 2022/2024 period. The new budget targets a deficit of 5.6% of GDP next year down from 9.4% this year. The government expects growth of 6.0% this year and Draghi indicated that policy should aim to maintain a higher structural growth in the future. In a temporary arrangement, the retirement age was raised by 2 years compared to the current so-called ‘quota 100' system in which retirement was possible from the age of 62 with 38 years of contribution.
The Reserve Bank of Australia abstained to intervene in the bond market to defend its 0.1% yield curve control target of 0.1% for the 04/2024 government bond. Yield on the bond spiked to 0.77% currently. In the same context, markets now start to discount a RBA rate hike by the spring of next year, while the RBA until now pledged that rates will have to stay at the current level until 2024. The market repositioning comes as markets look forward at the RBA policy meeting on Tuesday next week. The Aussie dollar gains marginally to the AUD/USD 0.7550 area this morning.
XAUUSD Is Possibly Bearish
Technical analysis
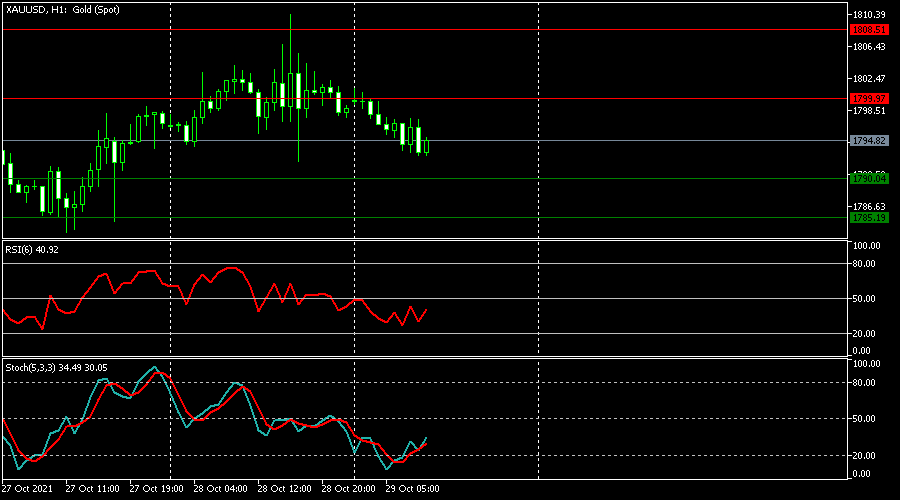
The RSI is below level 50.
The Stochastics is below level 50.
Most likely scenario – SELL
Target prices: 1,790.04 1,795.19
Alternative scenario – BUY
Target prices: 1,799.97 1,808.51
Key levels
Support 1,790.04 1,795.19
Resistance 1,799.97 1,808.51
USD/CAD Daily Outlook
Daily Pivots: (S1) 1.2322; (P) 1.2353; (R1) 1.2374; More...
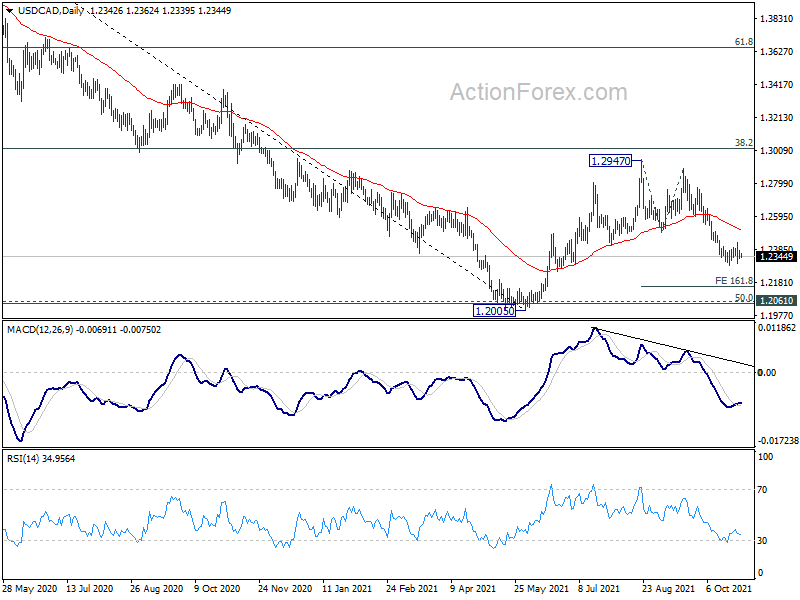
Intraday bias in USD/CAD remains neutral as consolidation from 1.2286 is still extending. Upside of recovery should be limited by 1.2497 resistance to bring fall resumption. On the downside, break of 1.2286 will resume the fall from 1.2947 to 161.8% projection of 1.2947 to 1.2492 from 1.2894 at 1.2158 next.
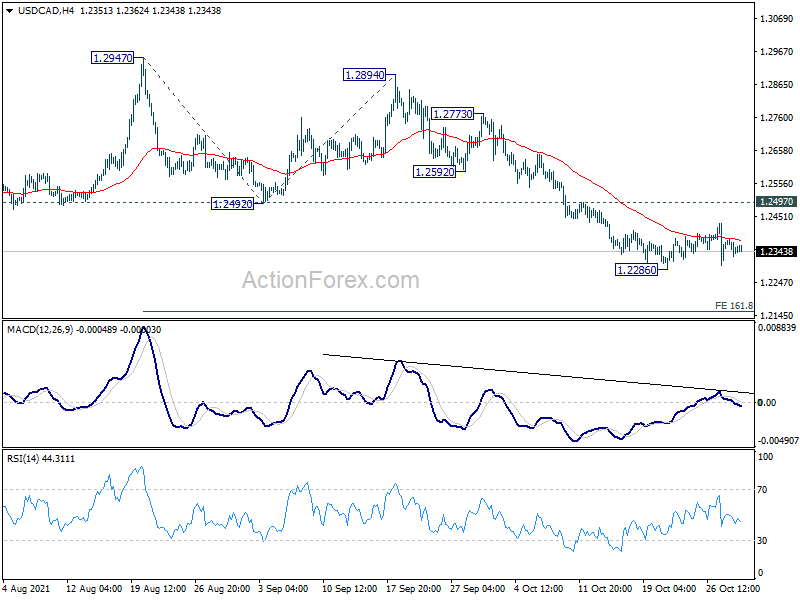
In the bigger picture, the rejection by 38.2% retracement of 1.4667 to 1.2005 at 1.3022 argues that rebound from 1.2005 is merely a corrective rise, which is complete. More importantly, the down trend from 1.4667 (2020 high) is not over yet. Sustained break of 1.2005 will extend the down trend to next long term fibonacci level at 61.8% retracement of 0.9406 to 1.4689 at 1.1424. In any case, outlook will not turn bullish as long as 1.2947 resistance holds.
AUD/USD Daily Report
Daily Pivots: (S1) 0.7498; (P) 0.7527; (R1) 0.7574; More...
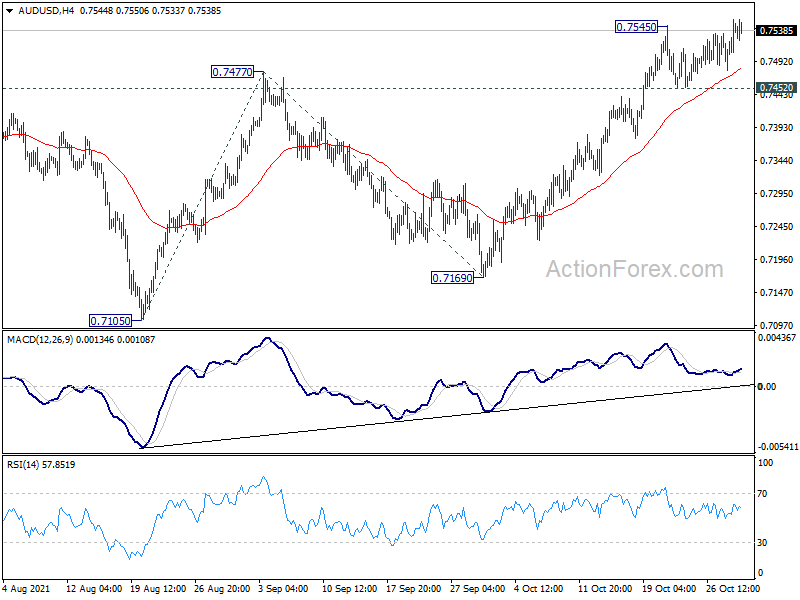
AUD/USD's rally is resuming with breach of 0.7545 temporary top. Intraday bias is back on the upside. Rise from 0.7105 would target 161.8% projection of 0.7105 to 0.7477 from 0.7169 at 0.7771 next. On the downside, however, break of 0.7452 minor support will turn bias to the downside for 55 day EMA (now at 0.7381) and possibly below.
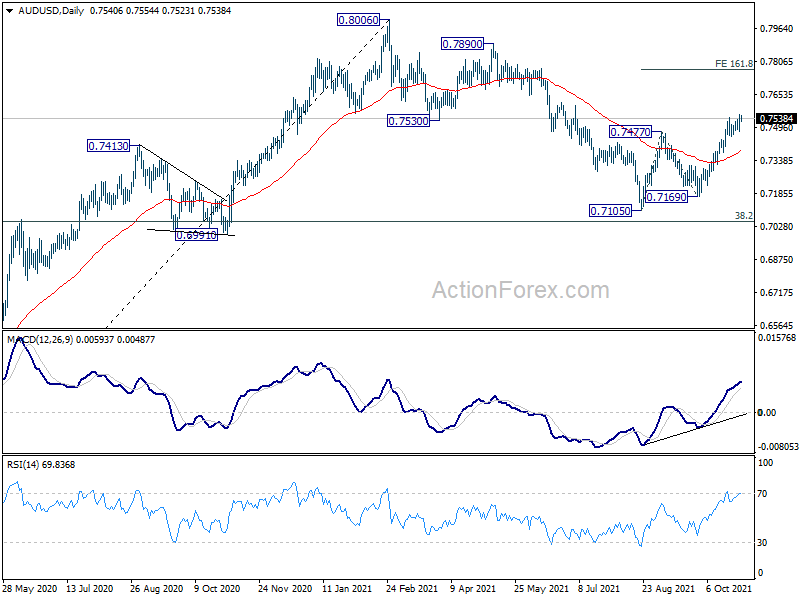
In the bigger picture, with 0.6991 cluster support (38.2% retracement of 0.5506 to 0.8006 at 0.7051) intact, we're seeing price action from 0.8006 as a correction only. That is, up trend from 0.5506 low would resume after the correction completes. In that case, main focus will be 0.8135 key resistance (2018 high). Sustained break there will carry larger bullish implications. However, sustained break of 0.6991 will argue that the whole medium term trend has indeed reversed.
USD/JPY Daily Outlook
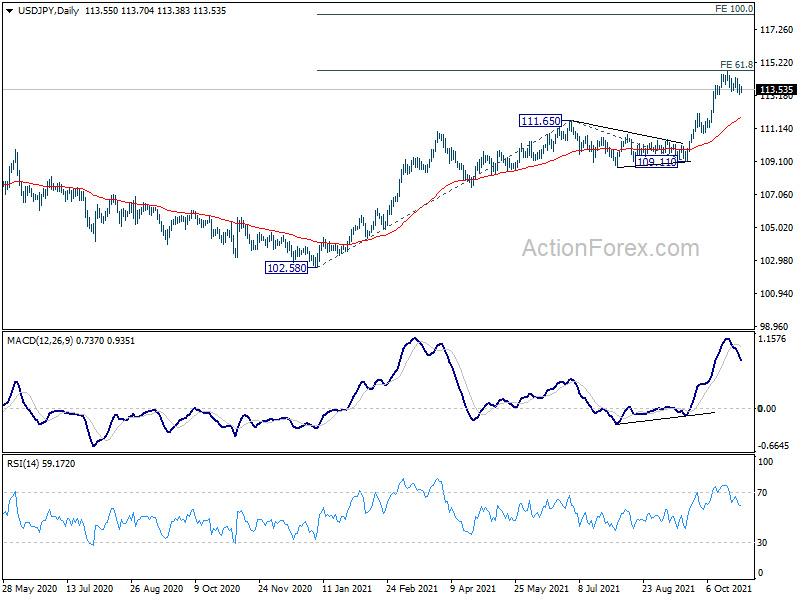
Daily Pivots: (S1) 113.25; (P) 113.56; (R1) 113.86; More...
Intraday bias in USD/JPY is mildly on the downside, as corrective fall from 114.69 could extend lower. But downside should be contained above 112.07 resistance turned support to bring rebound. On the upside, firm break of 114.69 will resume the larger up trend to 100% projection of 102.58 to 111.65 from 109.11 at 118.18 next.
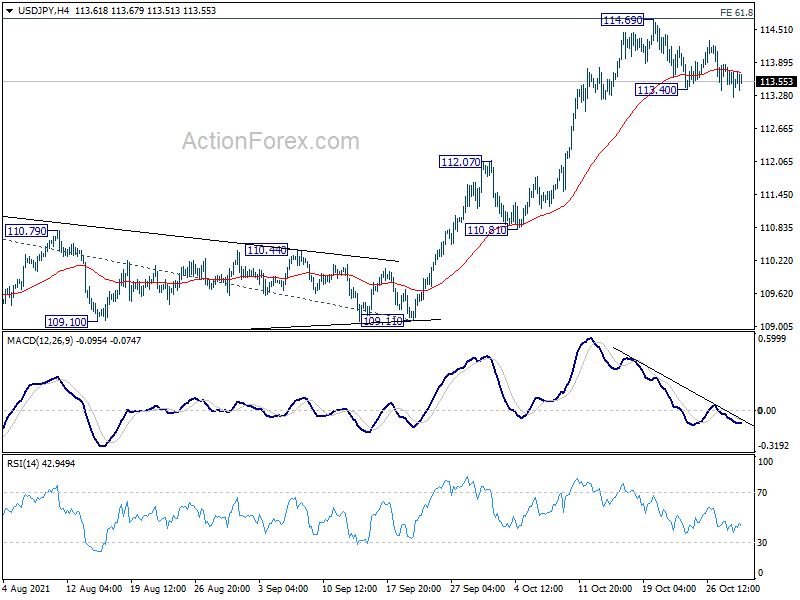
In the bigger picture, corrective decline from 118.65 (2016 high) should have completed at 101.18 already. Rise from the 102.58 is seen as the third leg of the up trend from 101.18. Next target is 114.54 resistance and then 118.65 high. This will now be the preferred case as long as 109.11 support hold, even in case of deep pull back.
USD/CHF Daily Outlook
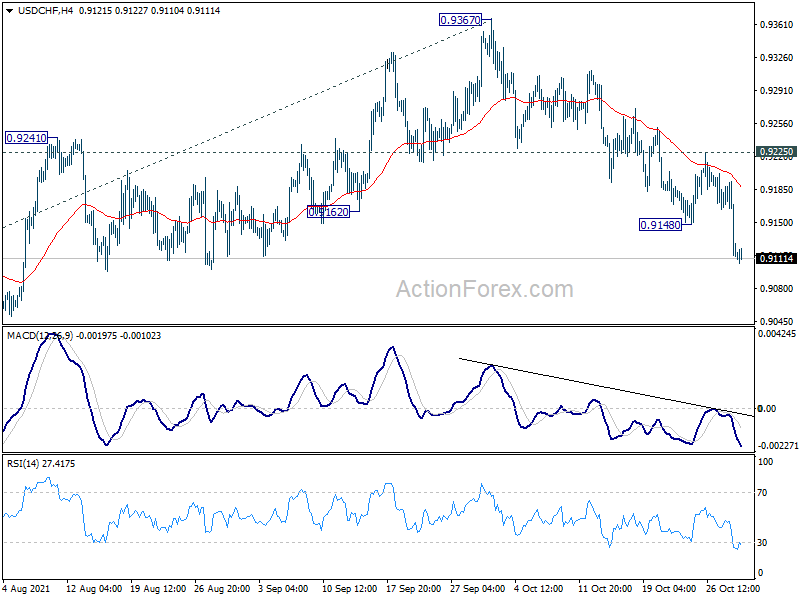
Daily Pivots: (S1) 0.9091; (P) 0.9143; (R1) 0.9171; More....
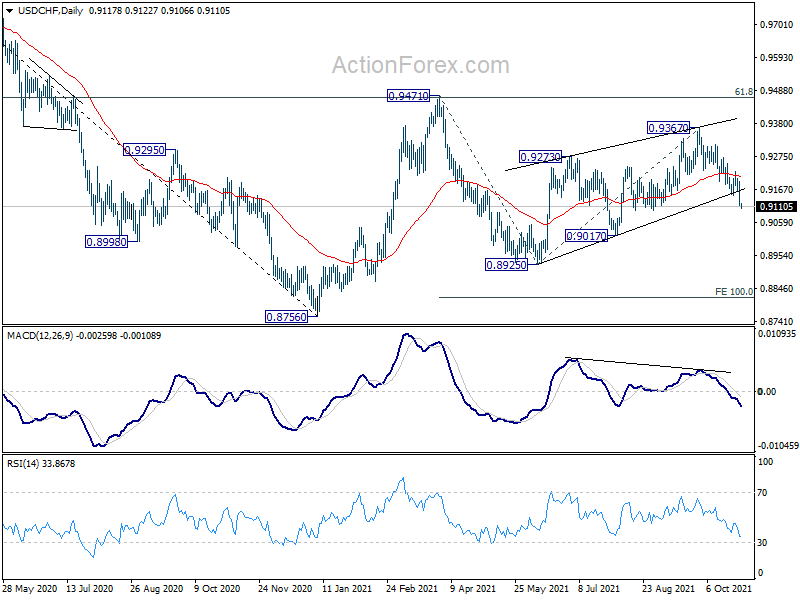
USD/CHF's fall from 0.9367 resumed and intraday bias is back on the downside. As noted before, Corrective rise from 0.8927 should be complete with three waves up to 0.9367, on bearish divergence condition in daily MACD. Further decline would be seen back to 0.9017 support first, and then 0.8925 support next. For now, outlook will stay bearish as long as 0.9225 minor resistance holds, in case of recovery.
In the bigger picture, the corrective structure of the rebound from 0.8925 argues that fall from 0.9471 is not completed yet. It could either be the second leg of pattern from 0.8756 (2021 low), or resuming larger down trend from 1.0237 (2018 high). We'd pay attention to the downside momentum and assess the odds later. But for now, medium term outlook will be neutral at best as long as 0.9471 resistance holds.
GBP/USD Daily Outlook
Daily Pivots: (S1) 1.3707; (P) 1.3744; (R1) 1.3778; More...
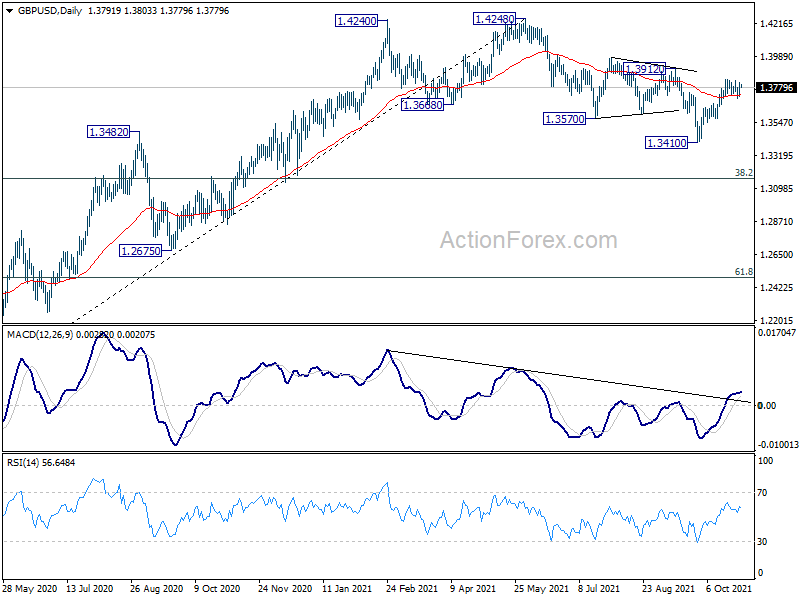
GBP/USD is still bounded in consolidation from 1.3833 and intraday bias stays neutral for the moment. With 1.3646 support intact, further rally is expected. On the upside, above 1.3833 will target 1.3912 key structural resistance. Firm break there will indicate that the correction from 1.4248 is complete with three waves down to 1.3410. Further rally would then be seen to retest 1.4248 high. However, break of 1.3646 will turn bias to the downside for retesting 1.3410 low.
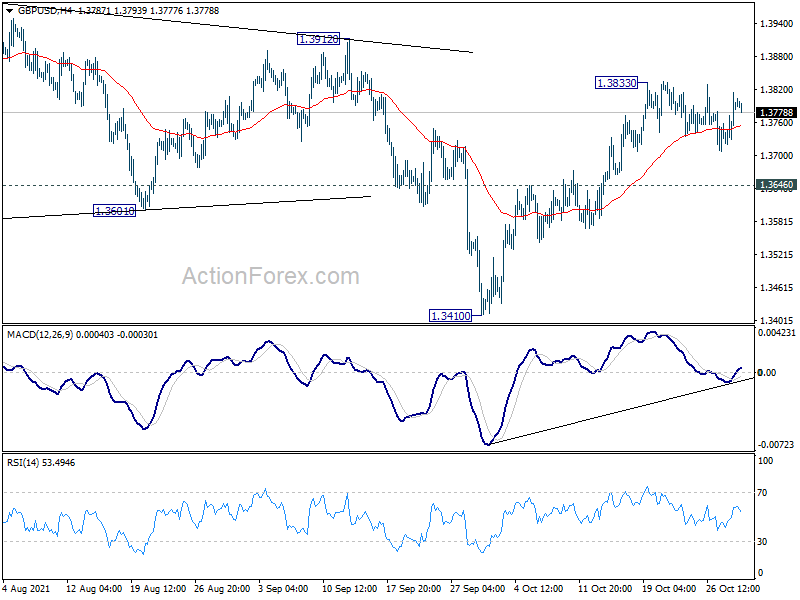
In the bigger picture, the structure of the fall from 1.4248 suggests that it's a correction to the up trend from 1.1409 (2020 low) only. While deeper fall cannot be ruled out yet, downside should be contained by 38.2% retracement of 1.1409 to 1.4248 at 1.3164, at least on first attempt, to bring rebound. On the upside, firm break of 1.4376 key resistance (2018 high) will add to the case of long term bullish reversal. However, sustained trading below 1.3164 will revive some medium term bearishness and target 61.8% retracement at 1.2493.
Daily Technical Analysis
EUR/USD
Current level - 1.1686
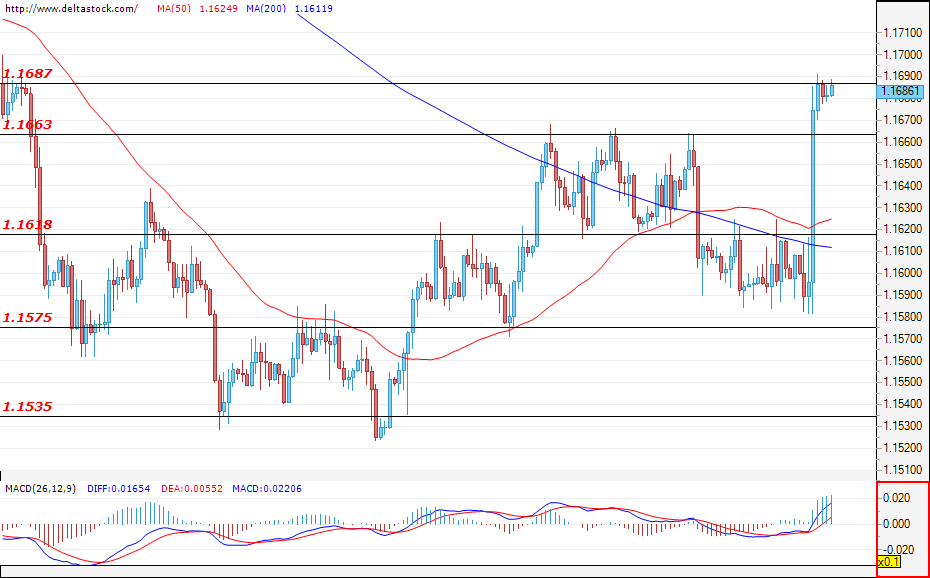
The worse-than-expected economic data for the United States, which came out yesterday, helped the bulls prevail and the euro recovered quite a bit of its recent losses against the dollar. The currency pair easily violated the resistance level of 1.1663 and, at the time of writing, the pair is testing the resistance of 1.1687. A successful breach would continue the rally and lead the EUR/USD towards the September 2021 highs at around 1.1747. However, if the mentioned resistance withholds the bullish attack, a corrective phase towards the support of 1.1663 will most likely develop. The announcement of the preliminary GDP for Germany at 08:00 GMT and the preliminary GDP for the EU at 09:00 could spark some volatility during today’s session.
| Resistance | Support | ||
| intraday | intraweek | intraday | intraweek |
| 1.1687 | 1.1750 | 1.1663 | 1.1575 |
| 1.1750 | 1.1800 | 1.1618 | 1.1535 |
USD/JPY
Current level - 113.62
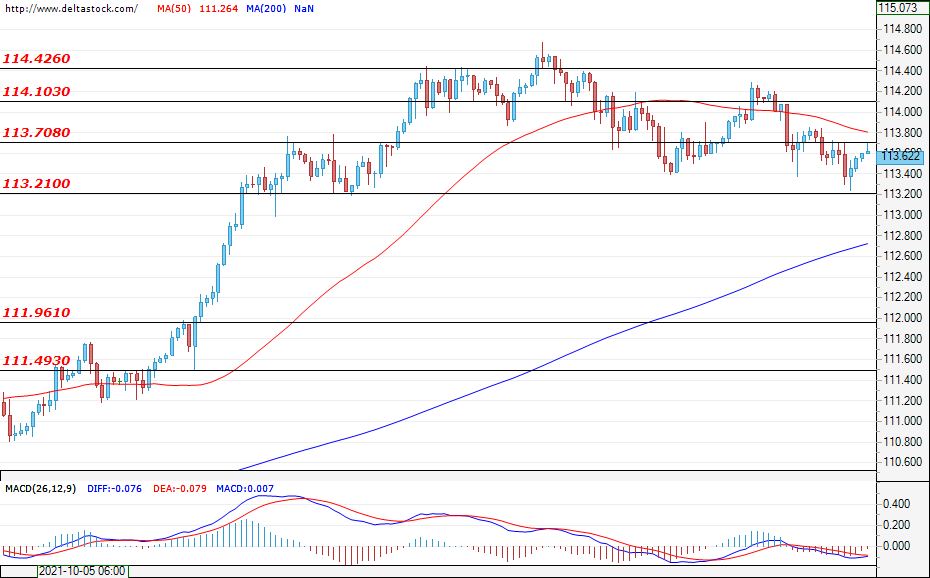
The test of the support of 113.21 was unsuccessful as the dollar recovered some of its recent losses against the yen and, during the early hours of today`s trading, the pair is trading just below the resistance of 113.70. If the bears re-enter the market, a new and successful attempt at breaching the mentioned support could easily strengthen the negative expectations for the future path of the USD/JPY and lead to a decline towards the zone of 111.96. The first target for the bulls is the level of 113.70, followed by the resistance of 114.10.
| Resistance | Support | ||
| intraday | intraweek | intraday | intraweek |
| 113.70 | 114.50 | 113.20 | 111.50 |
| 114.10 | 116.00 | 111.96 | 111.50 |
GBP/USD
Current level - 1.3789
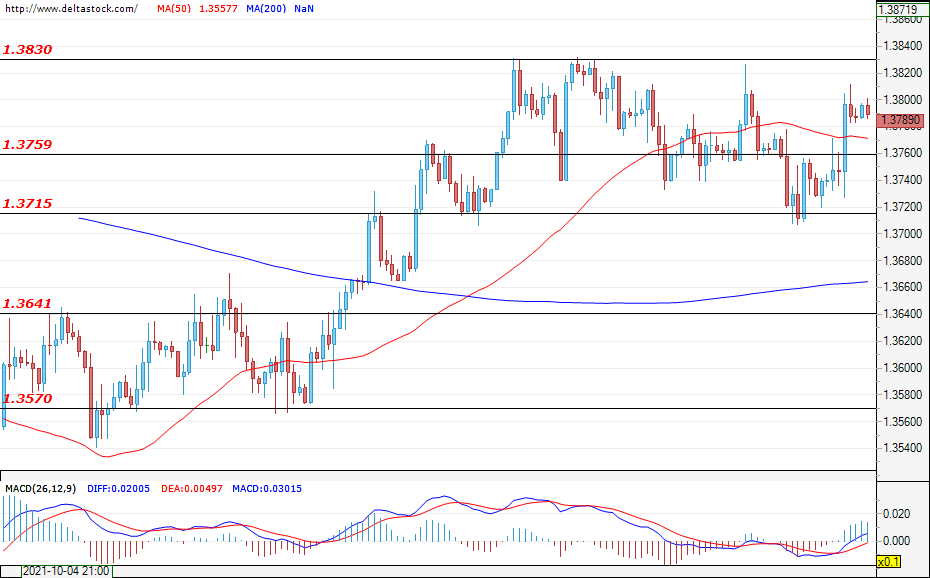
The bulls took control and the GBP/USD overcame the resistance of 1.3759. At the time of writing, a test of the resistance of 1.3830 is the most likely scenario. A successful breach would result in new gains and could easily lead the Cable towards levels of around 1.3900. The first target for the bears is the zone of 1.3759, which is now acting as a support. A breach of the lower level of 1.3715 would draw a more bearish picture for the future path of the pair.
| Resistance | Support | ||
| intraday | intraweek | intraday | intraweek |
| 1.3830 | 1.3900 | 1.3759 | 1.3641 |
| 1.3900 | 1.4000 | 1.3715 | 1.3570 |
USD/CAD Bears Likely To Prevail
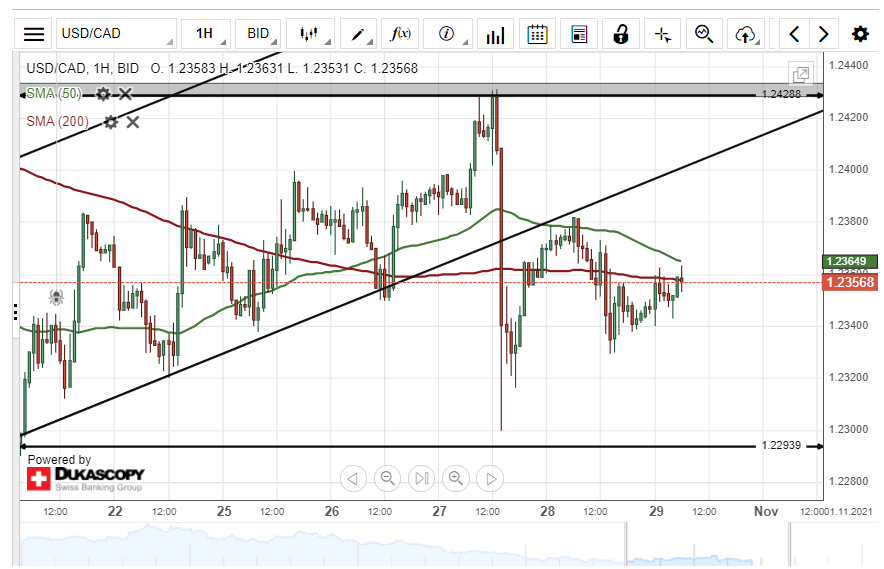
On Thursday, the US Dollar declined by 49 pips or 0.40% against the Canadian Dollar. The currency pair was pressured by the 50– hour simple moving average during yesterday's trading session.
Technical indicators suggest selling signals on the weekly time-frame chart. Most likely, the USD/CAD exchange rate could continue to decline within the following trading session.
However, if the currency exchange rate breaks the 200– hour SMA resistance level, a surge towards the 1.2400 area could be expected today.