Sample Category Title
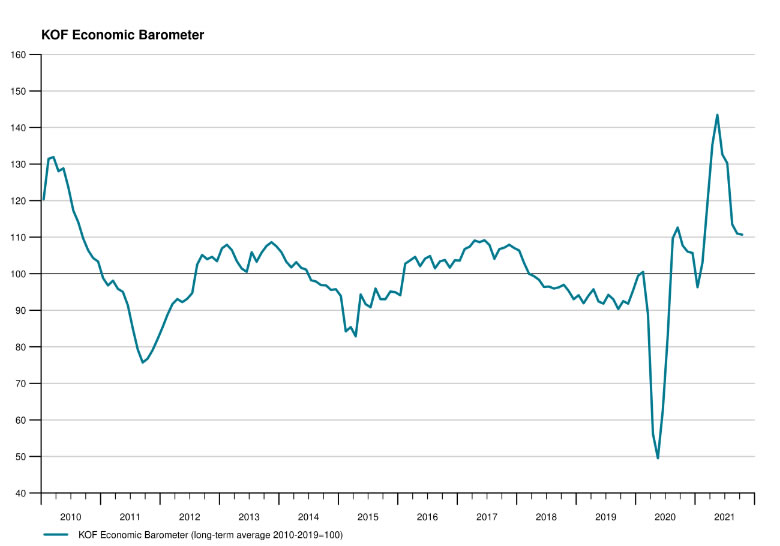
Swiss KOF dropped slightly to 110.7, almost unchanged overall movement
Swiss KOF Economic Barometer dropped slightly from 111.0 to 110.7 in October, better than expectation of 108.0. KOF said: "Indicator bundles of the food and beverage industry have improved clearly and are contrasted by declines in indicator bundles of manufacturing, the economic sector other services, foreign demand and the financial and insurance services, resulting in an almost unchanged overall movement."
USDCAD Is On The Sidelines But Indicators Suggest Bullish Action
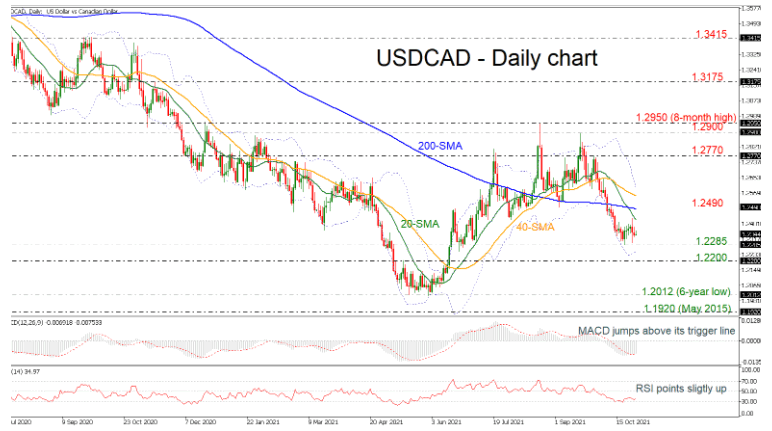
USDCAD has been moving sideways over the last few days, remaining above the 1.2285 support and below the simple moving averages (SMAs).
Technically, the MACD oscillator is jumping above its trigger line, holding well below the zero level, while the RSI is pointing marginally up in the negative territory.
If the price extends the move up, immediate resistance could come from the 200-day SMA, which overlaps with the 1.2490 barrier. Climbing higher, the 40-day SMA at 1.2555 may halt the bullish actions before meeting the upper Bollinger band around 1.2595. Overcoming these obstacles, the price could open the way for further upside move until the 1.2770 resistance.
However, a decline beneath the 1.2285 hurdle, it could reach the lower Bollinger band at 1.2245 ahead of the 1.2200 psychological mark. Steeper decreases could take the bears until the six-year low of 1.2012.
In conclusion, USDCAD has been in a downward wave in the short-term and if there are more falling moves below the lower Bollinger band could endorse the negative scenario.
US 30 Pulls Backs For Support
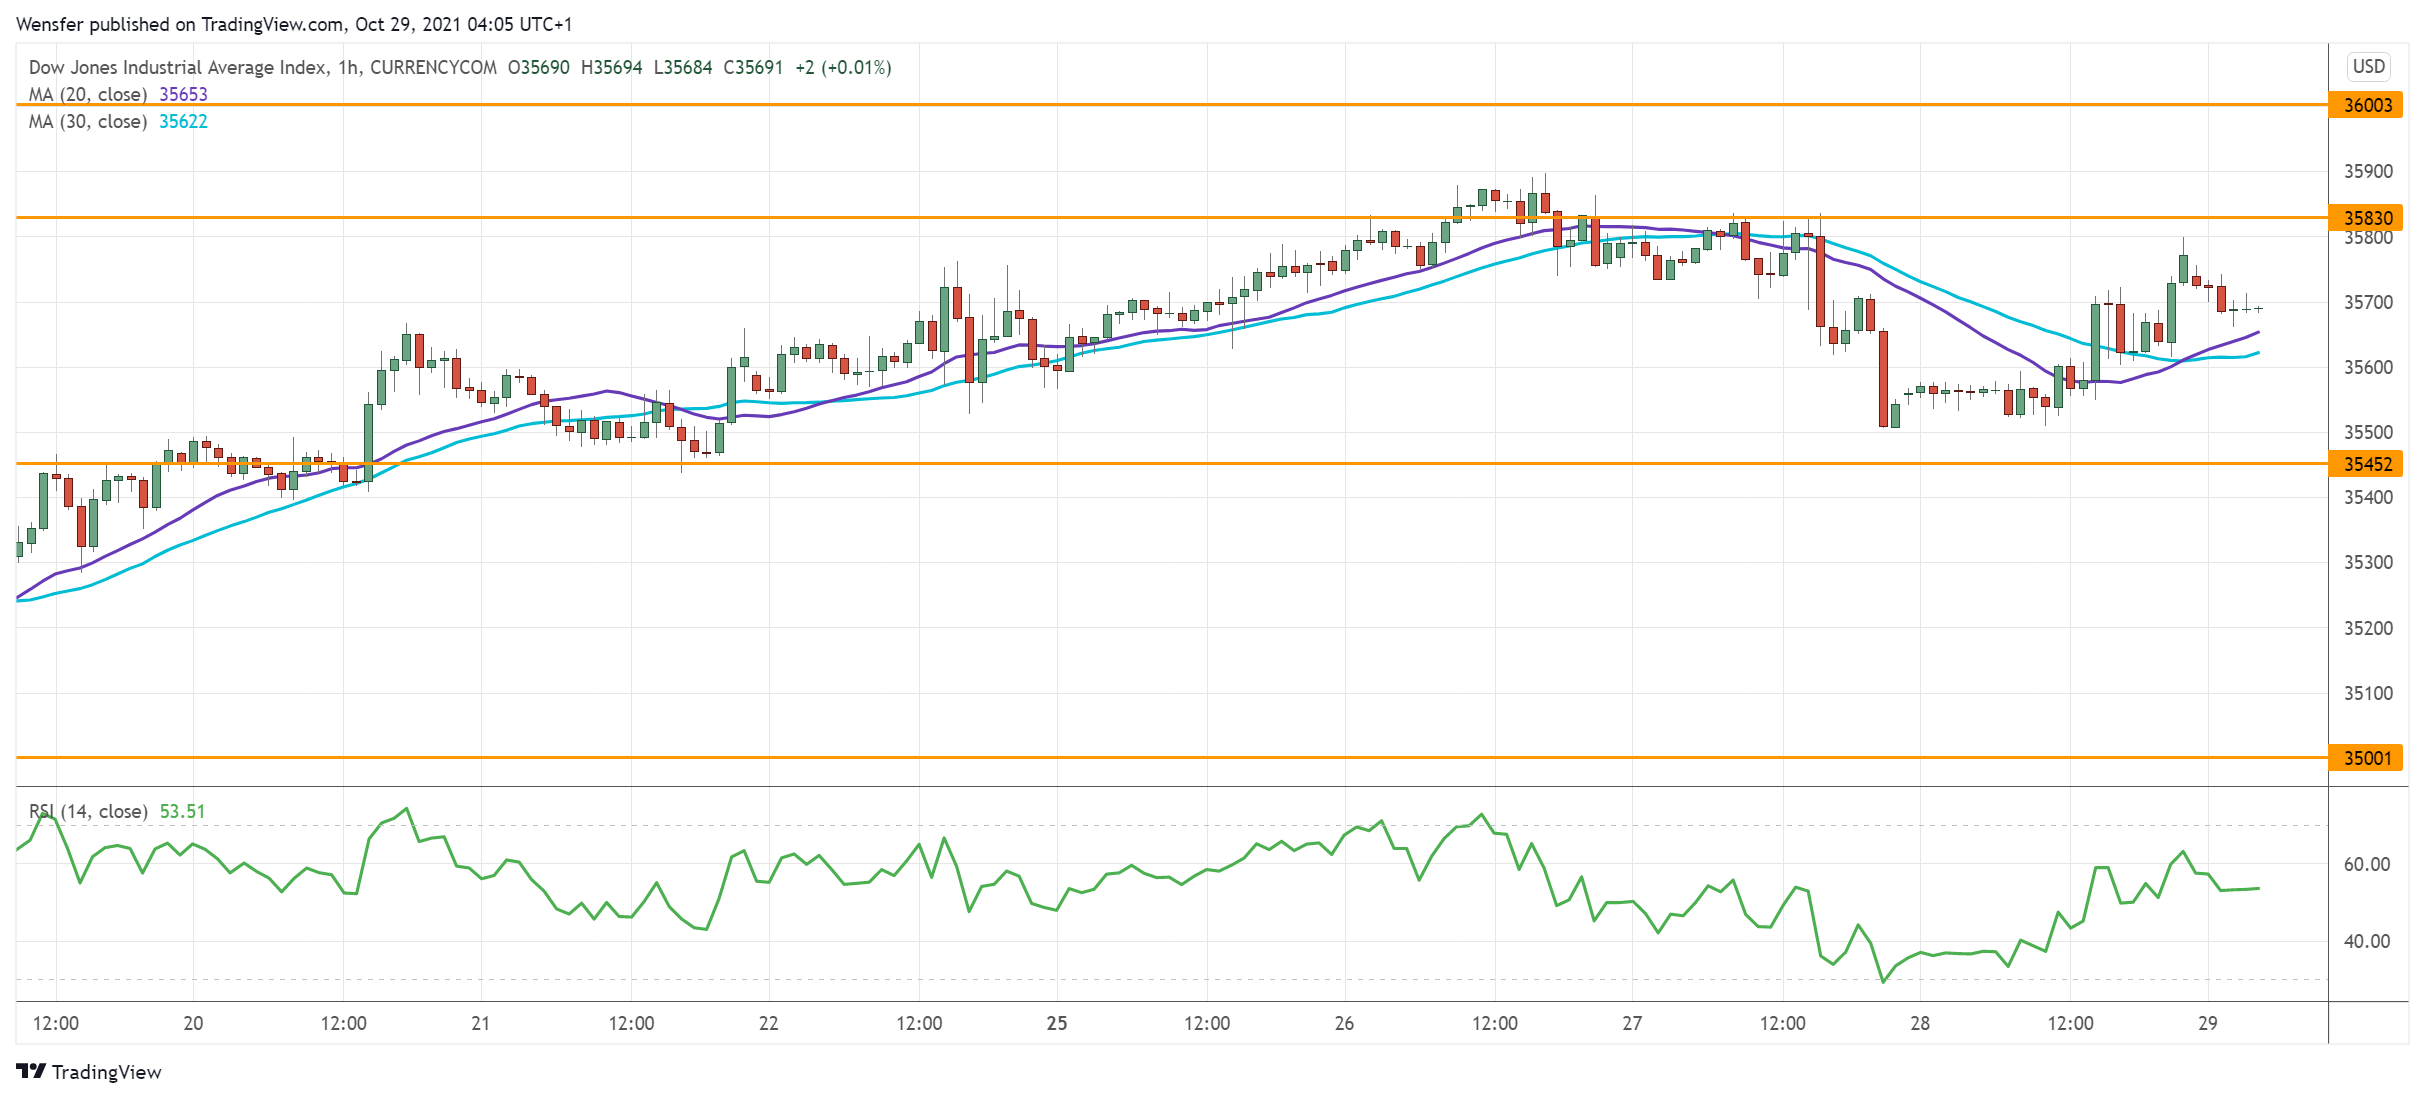
The Dow Jones consolidates as investors digest earnings near the all-time high.
A breakout above the August peak at 35600 and a bullish MA cross from the daily timeframe indicate an acceleration on the upside as the rally continues.
Pullbacks could be an opportunity to buy low. An overbought RSI has triggered a minor sell-off below 35600, shaking out weaker hands in the process. A drop below 35450 would lead to the psychological level of 35000. 35830 is now a fresh resistance.
GBP/JPY Daily Outlook
Daily Pivots: (S1) 156.15; (P) 156.43; (R1) 156.94; More...
No change in GBP/JPY's outlook as correction from 158.19 could extend lower. But downside should be contained by 153.66 support to bring rebound. On the upside, break of 158.19 will resume larger up trend from 123.94. Next target will be 61.8% projection of 136.96 to 156.05 from 148.93 at 160.72.
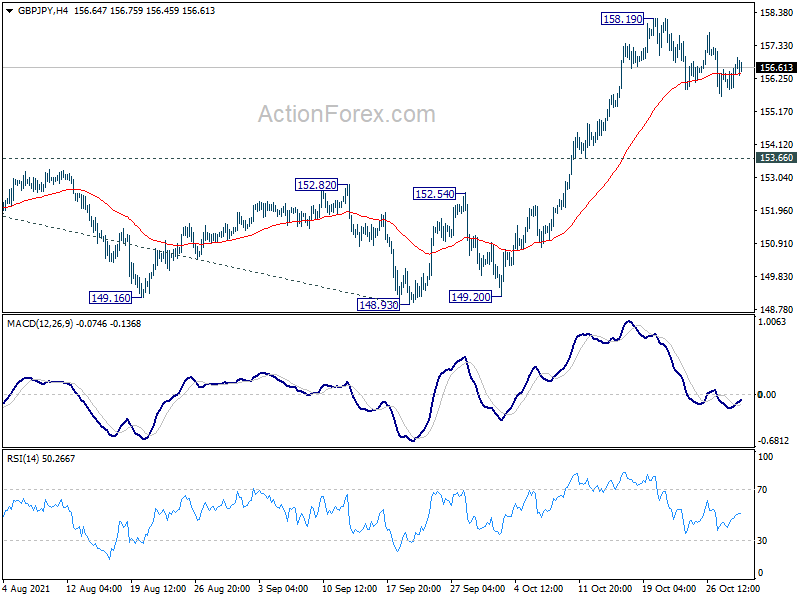
In the bigger picture, rise from 123.94 is seen as the third leg of the pattern from 122.75 (2016 low). The stay above 55 week EMA affirms medium term bullishness. Current rise should now target 61.8% retracement 195.86 (2015 high) to 122.75 at 167.93 next. In any case, outlook will remain bullish as long as 148.93 structural support hold, even in case of deep pull back.
USD/JPY Tests Demand Zone
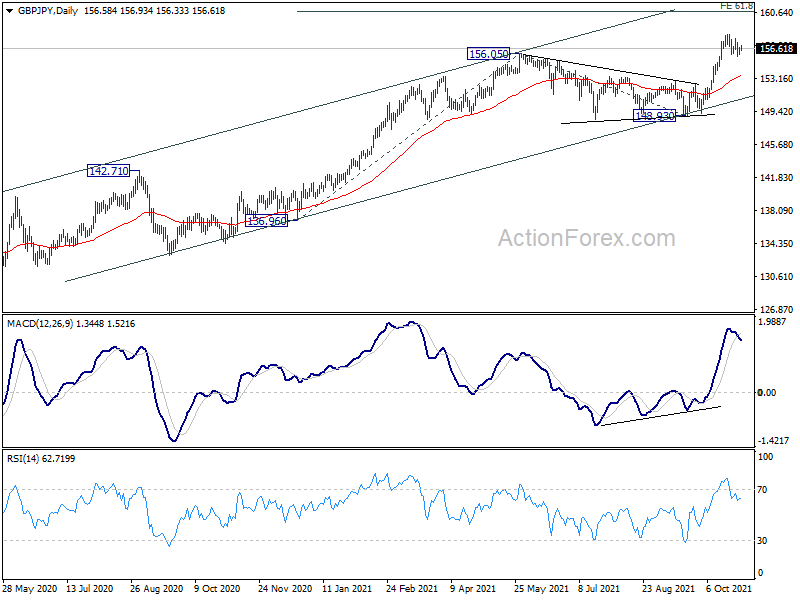
The Japanese yen recouped losses after the BOJ sees a weak yen as positive for Japan’s economy. And the US dollar has come under pressure near a four-year high.
An overbought RSI on the daily chart points to an overextension. On the hourly level, the pair has found bids around 113.30 near a previous consolidation range.
A bearish breakout would test the round number at 113.00, which lies on the 20-day moving average and is critical in safeguarding the uptrend. The bulls need to lift 114.30 before they may resume the rally.
EUR/USD Cuts Through Resistance
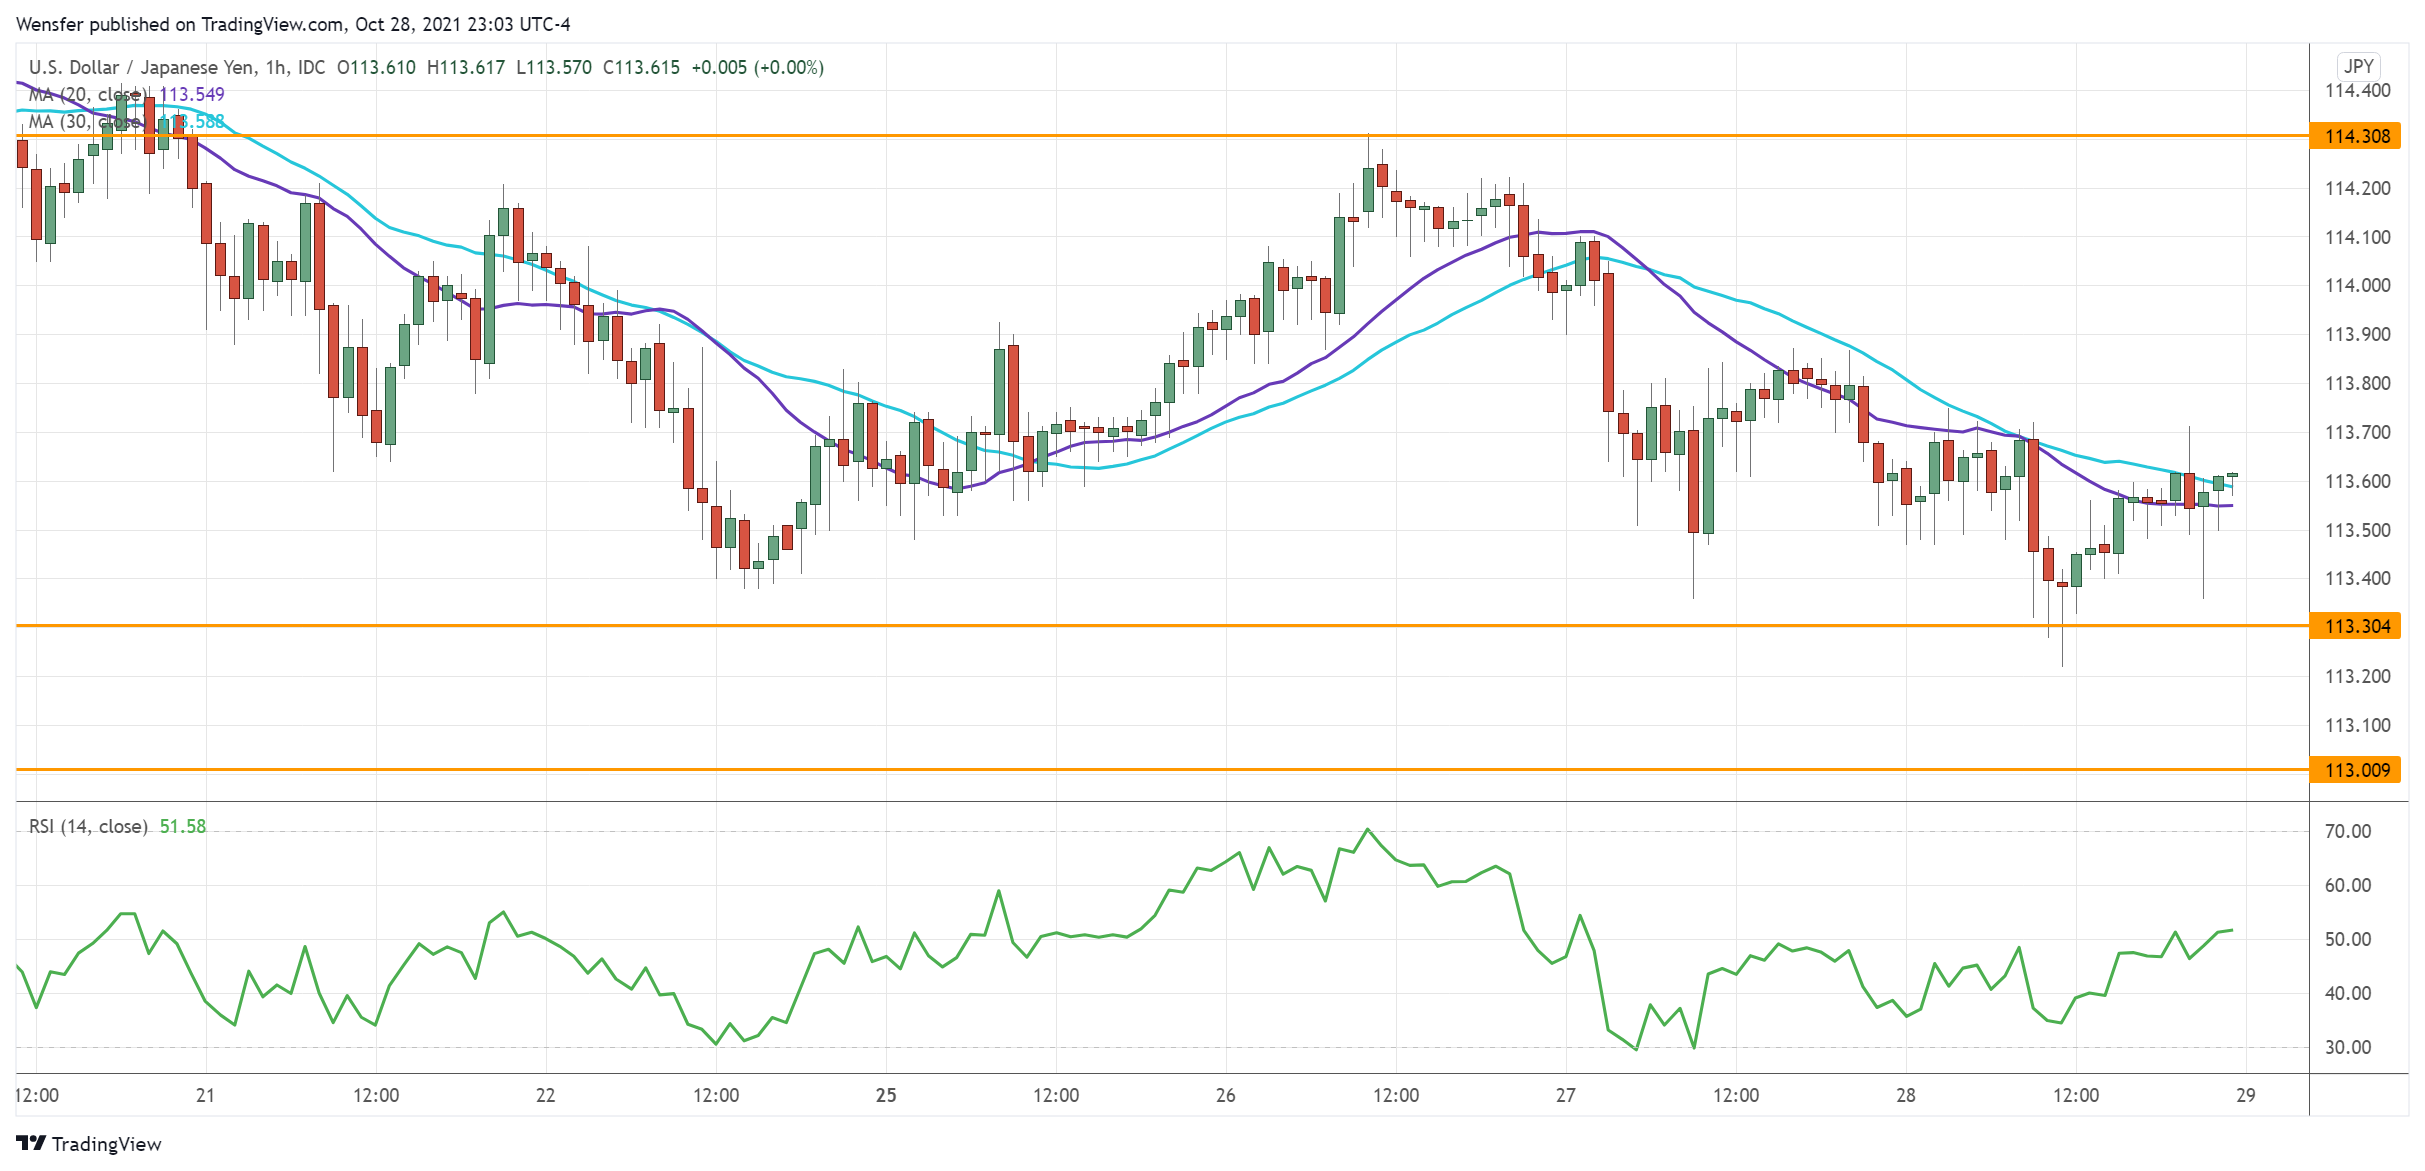
The euro surges as the market prices in inflation pressure despite the ECB’s dovish message.
Bullish candles have pushed the single currency above the triple top (1.1665) which sits on the 30-day moving average, paving the way for a reversal. Strong momentum is a sign of short-covering from those caught on the wrong side of the market.
An overbought RSI could temporarily limit the range of the rally. However, renewed optimism may send the pair to the daily resistance at 1.1750. 1.1620 is the support in case of a pullback.
EUR/JPY Daily Outlook
Daily Pivots: (S1) 131.93; (P) 132.31; (R1) 133.07; More....
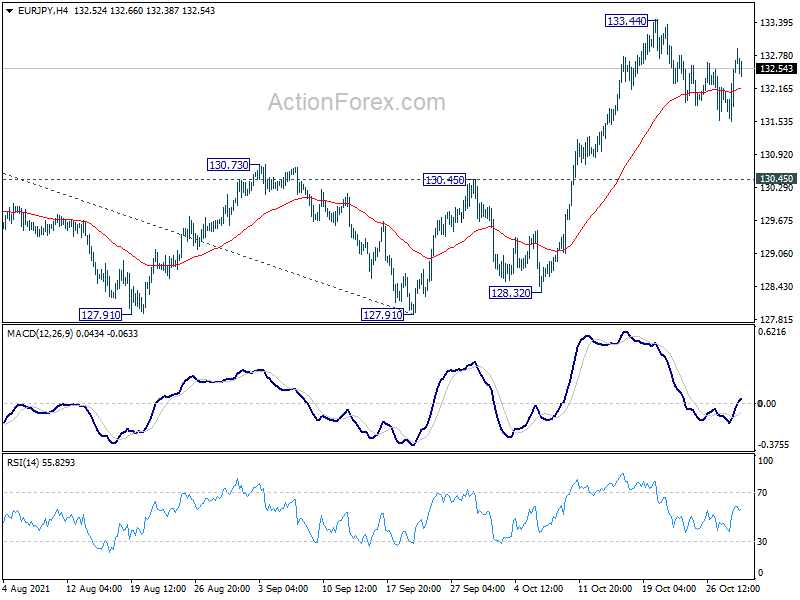
Intraday bias in EUR/JPY is turned neutral again with current recovery. Correction from 133.44 would still extend further. But in case of another fall, downside should be contained above 130.45 resistance turned support to bring rebound. On the upside, break of 133.44 will target 134.11 high first. Firm break there will resume larger up trend from 114.42. Next target is 61.8% projection of 121.63 to 134.11 from 127.91 at 135.62.
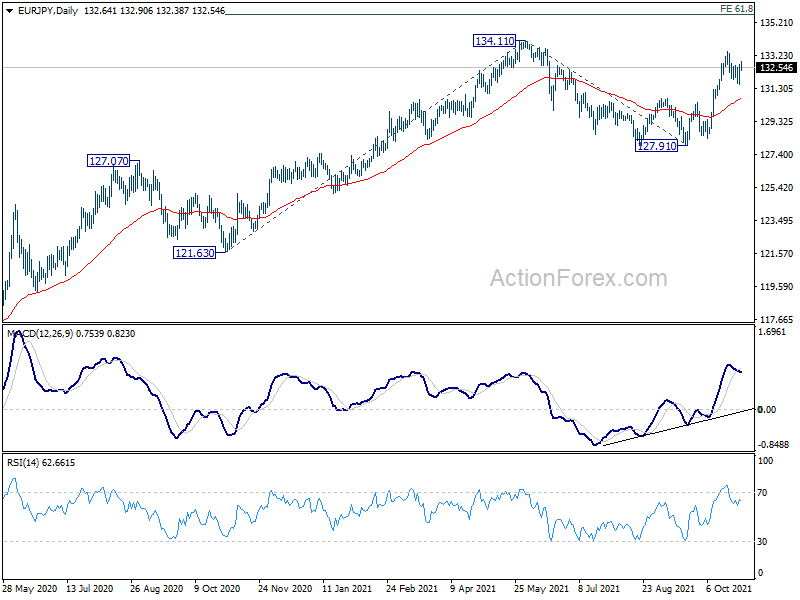
In the bigger picture, rise from 114.42 (2020 low) is still in progress and the strong support support from 55 week EMA affirms medium term bullishness. Further rise would be seen to retest 137.49 (2018 high). Decisive break there will resume the whole long term rise from 109.03 (2016 low). Next target will be 100% projection of 109.03 to 137.49 from 114.42 at 142.88. This will now remain the favored case as long as 127.91 support holds.
EUR/GBP Daily Outlook
Daily Pivots: (S1) 0.8436; (P) 0.8456; (R1) 0.8489; More...
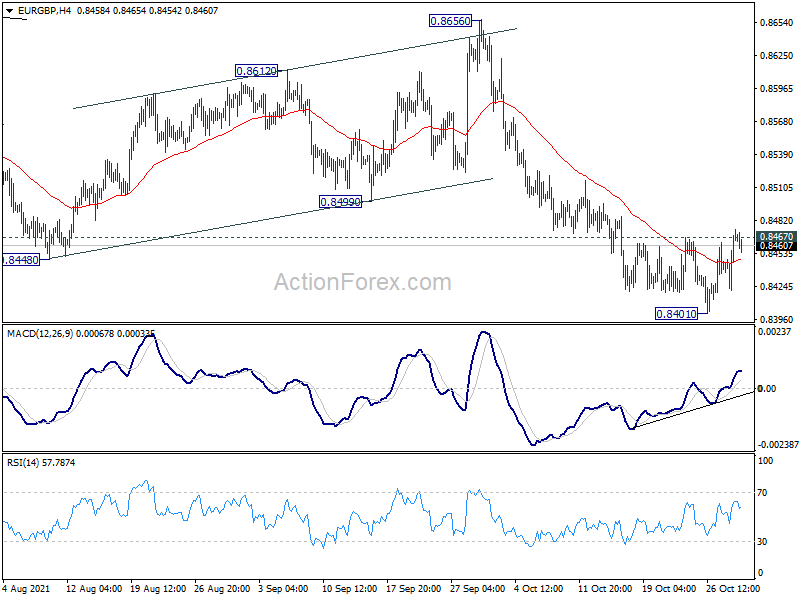
Intraday bias in EUR/GBP stays neutral first. Firm break of 0.8467 resistance will indicate short term bottoming. Intraday bias will be turned to the upside for rebound to 55 day EMA (now at 0.8510) and possibly above. On the downside, break of 0.8401 will resume larger down trend from 0.9499 towards 0.8276 key long term support next.
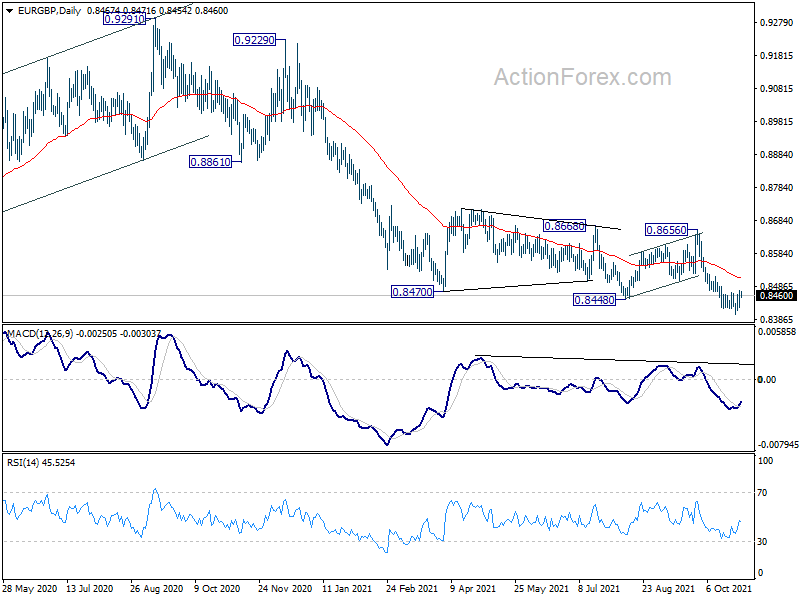
In the bigger picture, price actions from 0.9499 (2020 high) are still seen as developing into a corrective pattern. Deeper fall could be seen as long as 0.8656 resistance holds, towards long term support at 0.8276. However, firm break of 0.8656 resistance would argue that a medium term bottom was already formed. Stronger rise would be seen to 0.8861 support turned resistance to confirm completion of the corrective pattern.
EUR/AUD Daily Outlook
Daily Pivots: (S1) 1.5422; (P) 1.5461; (R1) 1.5527; More...
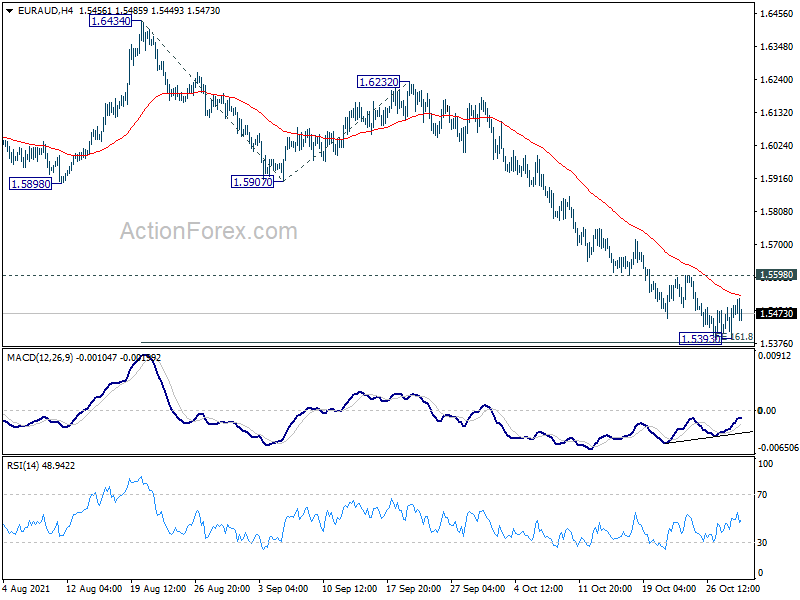
A temporary low is formed at 1.5393, ahead of 161.8% projection of 1.6434 to 1.5907 from 1.6232 at 1.5379. Intraday bias is turned neutral first, but further fall is expected as long as 1.5598 resistance holds. Firm break of 1.5379 will pave the way to retest 1.5250 low. However, break of 1.5598 minor resistance will indicate short term bottoming, and turn bias to the upside for stronger rebound to 55 day EMA (now at 1.5821).
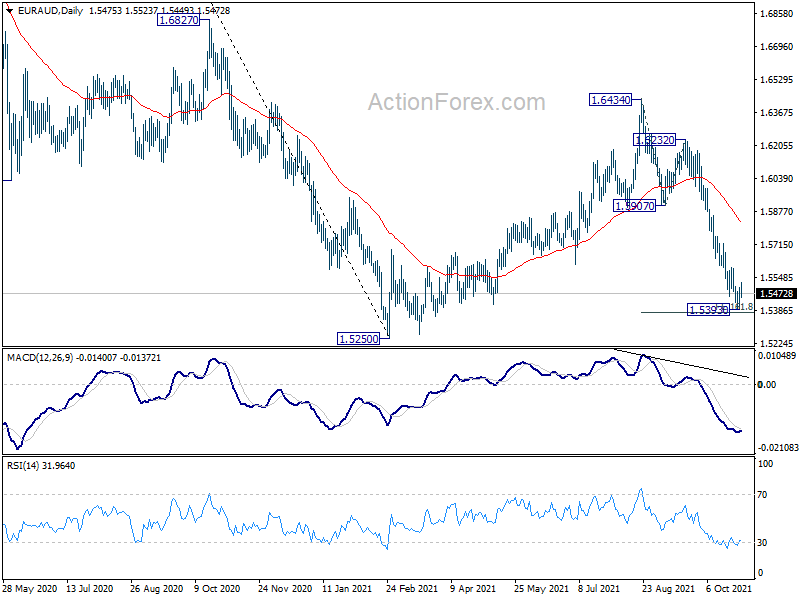
In the bigger picture, with 38.2% retracement of 1.9799 to 1.5250 at 1.6988 intact, the down trend from 1.9799 (2020 high) is expected to resume at a later stage. Firm break of 1.5250 will target 61.8% retracement of 1.1602 (2012 low) to 1.9799 at 1.4733. In any case, sustained break of 1.6988 fibonacci level is needed to indicate long term reversal.
EUR/CHF Daily Outlook
Daily Pivots: (S1) 1.0640; (P) 1.0656; (R1) 1.0670; More....
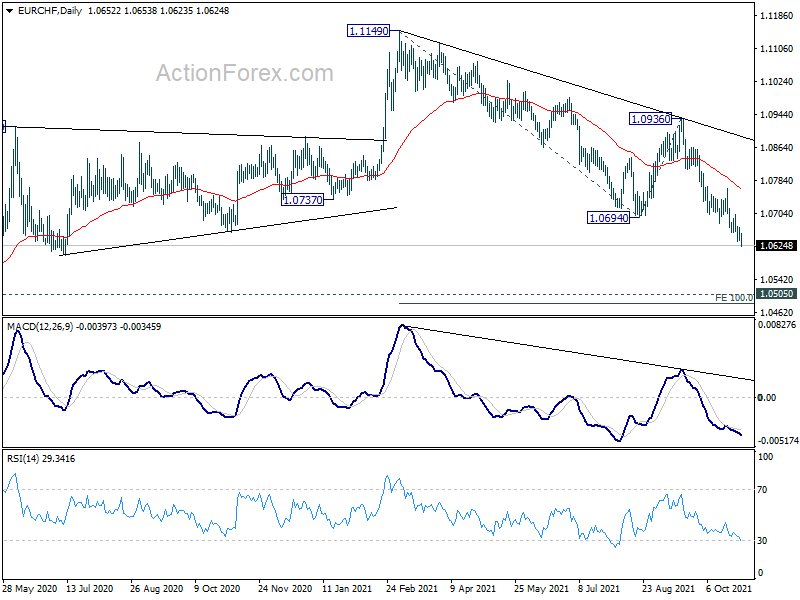
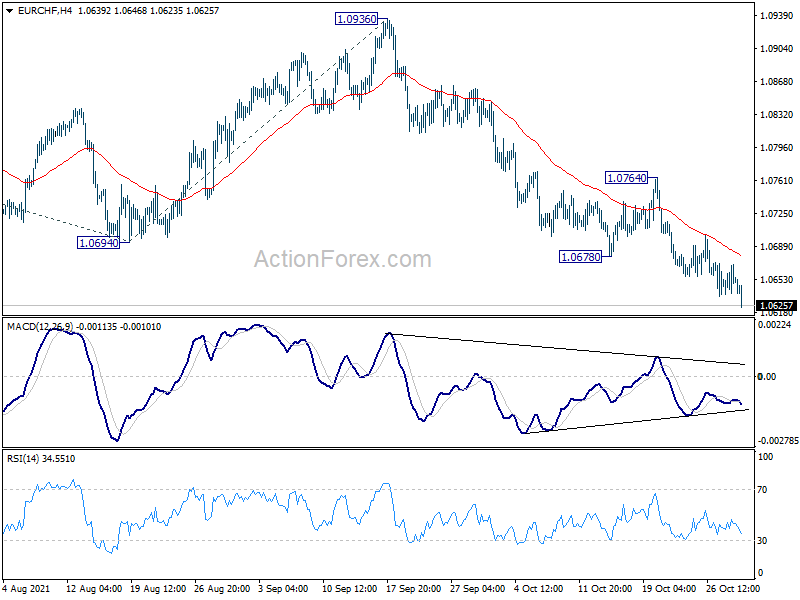
EUR/CHF's fall is still in progress and intraday bias stays on the downside. Current down trend from 1.1149 should target 100% projection of 1.1149 to 1.0694 from 1.0936 at 1.0481. On the upside, break of 1.0764 resistance is needed to indicate short term bottoming. Otherwise, outlook will stay bearish in case of recovery.
In the bigger picture, the rejection by 55 week EMA maintains medium term bearishness. Fall from 1.1149 (2021 high) is currently seen as the second leg of the patter from 1.0505 (2020 low) first. Hence, in case of deeper fall, we'd look for strong support from 1.0505 to bring rebound. However, sustained break of 1.0505 will resume the long term down trend from 1.2004 (2018 high). Also, medium term outlook will now be neutral at best as long as 1.0936 resistance holds.