Sample Category Title
GBP/USD Pair Is Correcting Lower From The 1.3671 High
The British Pound started a fresh increase from the 1.3425 zone against the US Dollar. The GBP/USD pair broke the 1.3525 resistance level to move into a short-term positive zone.
However, the pair struggled to clear the 1.3650 resistance and it remained below the 50 hourly simple moving average. The pair traded as high as 1.3671 and it is now correcting lower. There was a break below a major bullish trend line at 1.3615 on the hourly chart.
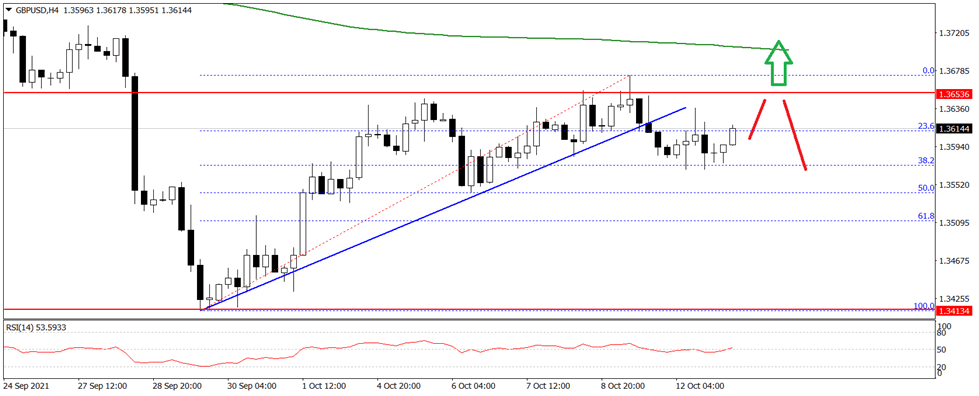
On the downside, an initial support is near the 1.3575 level. A break below the 1.3575 support level could even push the pair below the 1.3550 support.
An initial resistance on the upside is near the 1.3625 on FXOpen. The main resistance is now forming near the 1.3650 level. If there is a clear break above the 1.3625 and 1.3650 resistance levels, the pair could climb higher towards 1.3700 or even 1.3750.
The Analytical Overview Of The Main Currency Pairs
The EUR/USD currency pair
Technical indicators of the currency pair:
Prev Open: 1.1551
Prev Close: 1.1530
% chg. over the last day: -0.18%
German investor confidence is worsening amid raw material shortages: ZEW expectation index fell to 22.3 compared to the previous month's value - 26.5. There is a decline in profits, especially in export-oriented companies. Economic expectations for the Eurozone have also decreased.
Trading recommendations
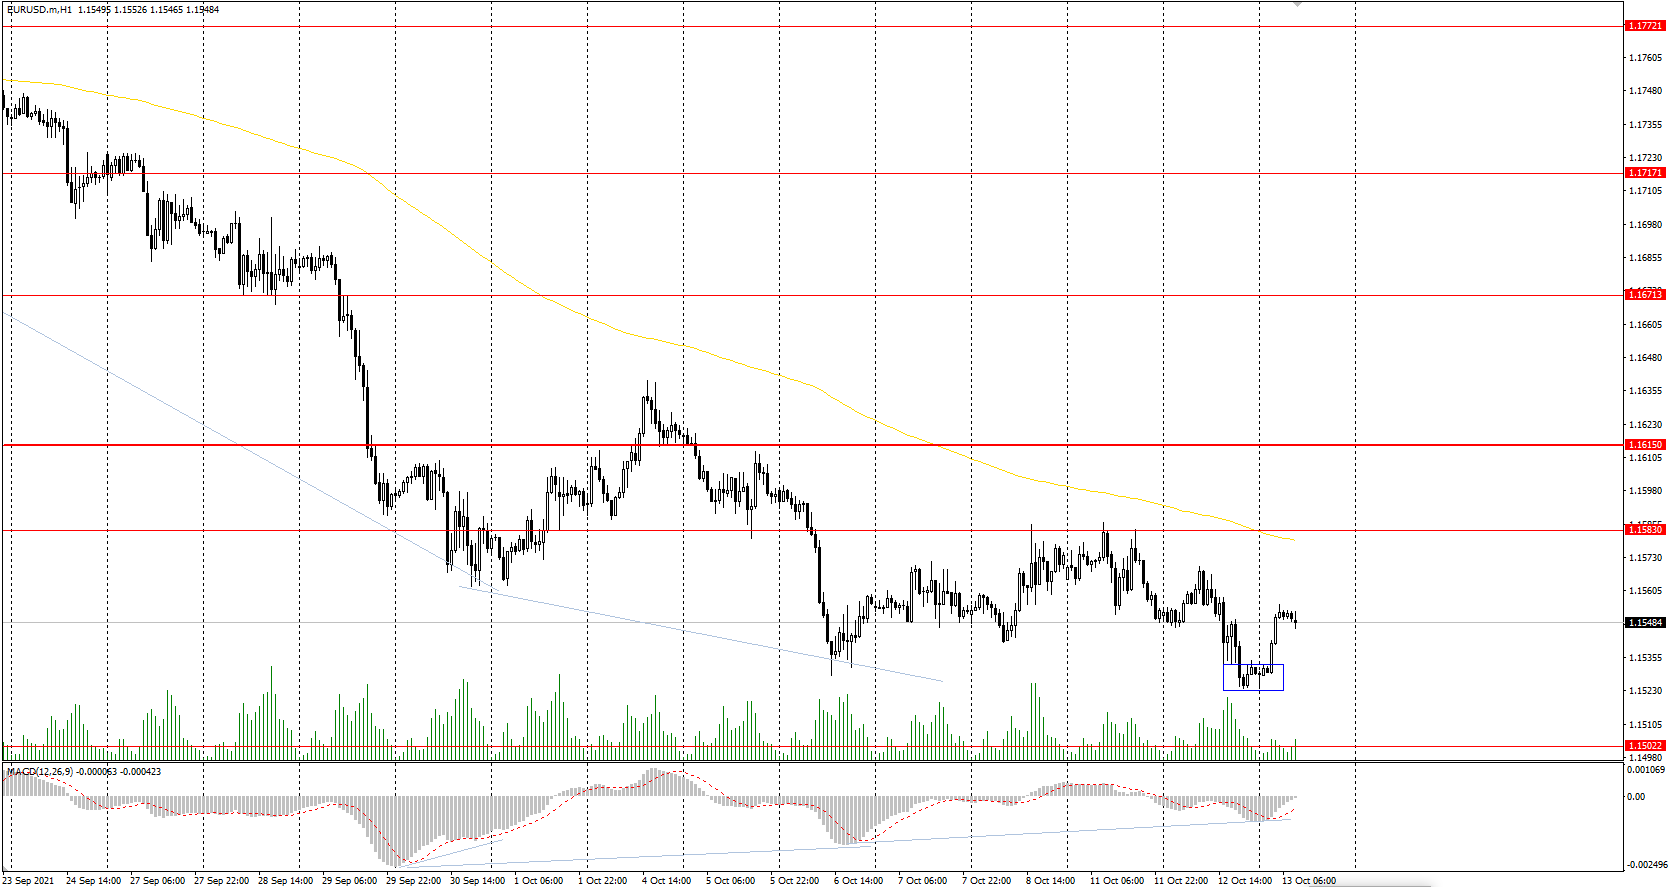
Support levels: 1.1502, 1.1453
Resistance levels: 1.1583, 1.1615, 1.1671, 1.1717, 1.1772, 1.1802, 1.1835
The EUR/USD trend is bearish, from the technical point of view. The MACD indicator has become inactive, but there is a divergence on bigger time frames. At the Asian session, there is buyer's initiative today. Under such market conditions, traders should consider sell deals from the resistance levels near the moving average. It is better to look for Buy trades from the support levels or from the buyers' initiative zone.
Alternative scenario: if the price breaks through the 1.1615 resistance level and fixes above, the mid-term uptrend is more likely to resume.
News feed for 2021.10.13:
- German Consumer Price Index (m/m) at 09:00 (GMT+3);
- Eurozone Industrial Production (m/m) at 12:00 (GMT+3);
- US Consumer Price Index (m/m) at 15:30 (GMT+3);
- US FOMC Meeting Minutes (m/m) at 21:00 (GMT+3);
- US FOMC Member Braindard’s Speech at 23:30 (GMT+3).
The GBP/USD currency pair
Technical indicators of the currency pair:
Prev Open: 1.3594
Prev Close: 1.3584
% chg. over the last day: -0.07%
Investors believe that the European Central Bank and the US Fed will adhere to an overly soft policy, while the Bank of England may commit a big mistake with its overly hawkish policy. The actual UK unemployment rate is 4.5% (forecast 4.5%, previous 4.6%).
Trading recommendations
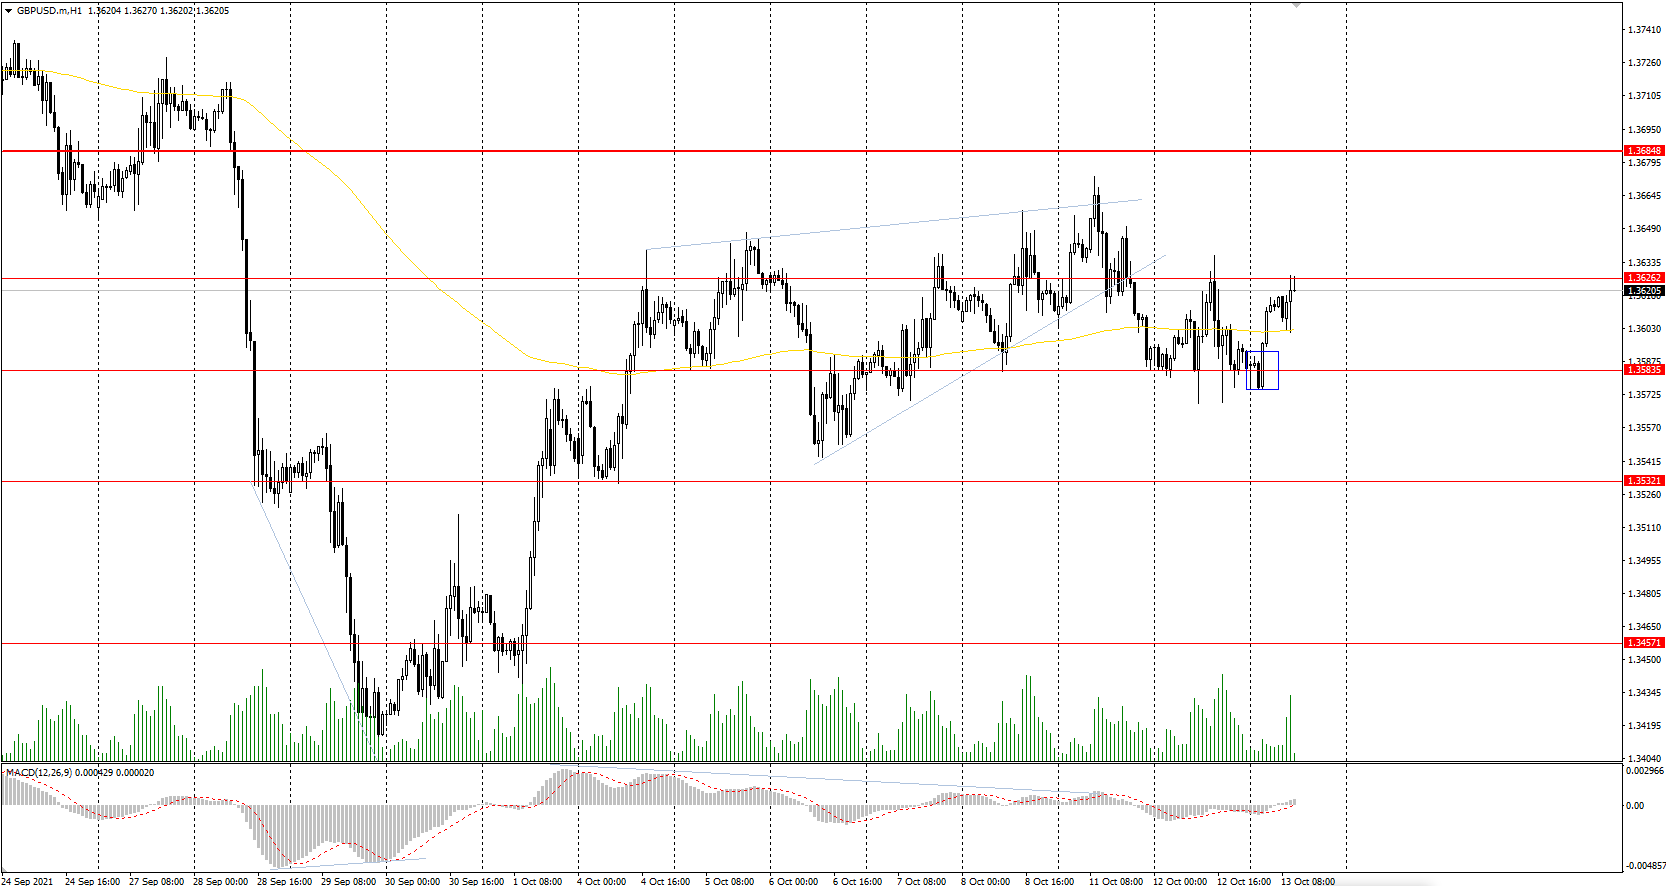
Support levels: 1.3584, 1.3532, 1.3457, 1.3360, 1.3282
Resistance levels: 1.3626, 1.3685, 1.3759, 1.3812, 1.3886
On the hourly time frame, the GBP/USD trend is bearish. However, the British currency looks more confident than the euro due to its direct correlation with oil prices. The MACD has become inactive, and the price is trading flat. Buy trades should be considered only within the day and only from the initiative zone of the buyers. It is better to look for sell deals from the nearest resistance levels, but after an additional confirmation in the form of a sellers' initiative, because the buyers' pressure is higher now.
Alternative scenario: if the price breaks through the 1.3685 resistance level and consolidates above, the bullish scenario is likely to resume.
News feed for 2021.10.13:
- UK GDP (m/m) at 09:00 (GMT+3);
- UK Manufacturing Production (m/m) at 09:00 (GMT+3);
- UK Industrial Production (m/m) at 09:00 (GMT+3);
- US Consumer Price Index (m/m) at 15:30 (GMT+3);
- US FOMC Meeting Minutes (m/m) at 21:00 (GMT+3).
The USD/JPY currency pair
Technical indicators of the currency pair:
Prev Open: 113.26
Prev Close: 113.60
% chg. over the last day: +0.30%
The Bank of Japan is calm about the weakness of the Japanese yen, as the weakening of the national currency boosts exports. The weaker yen is also increasing corporate spending due to higher import prices.
Trading recommendations
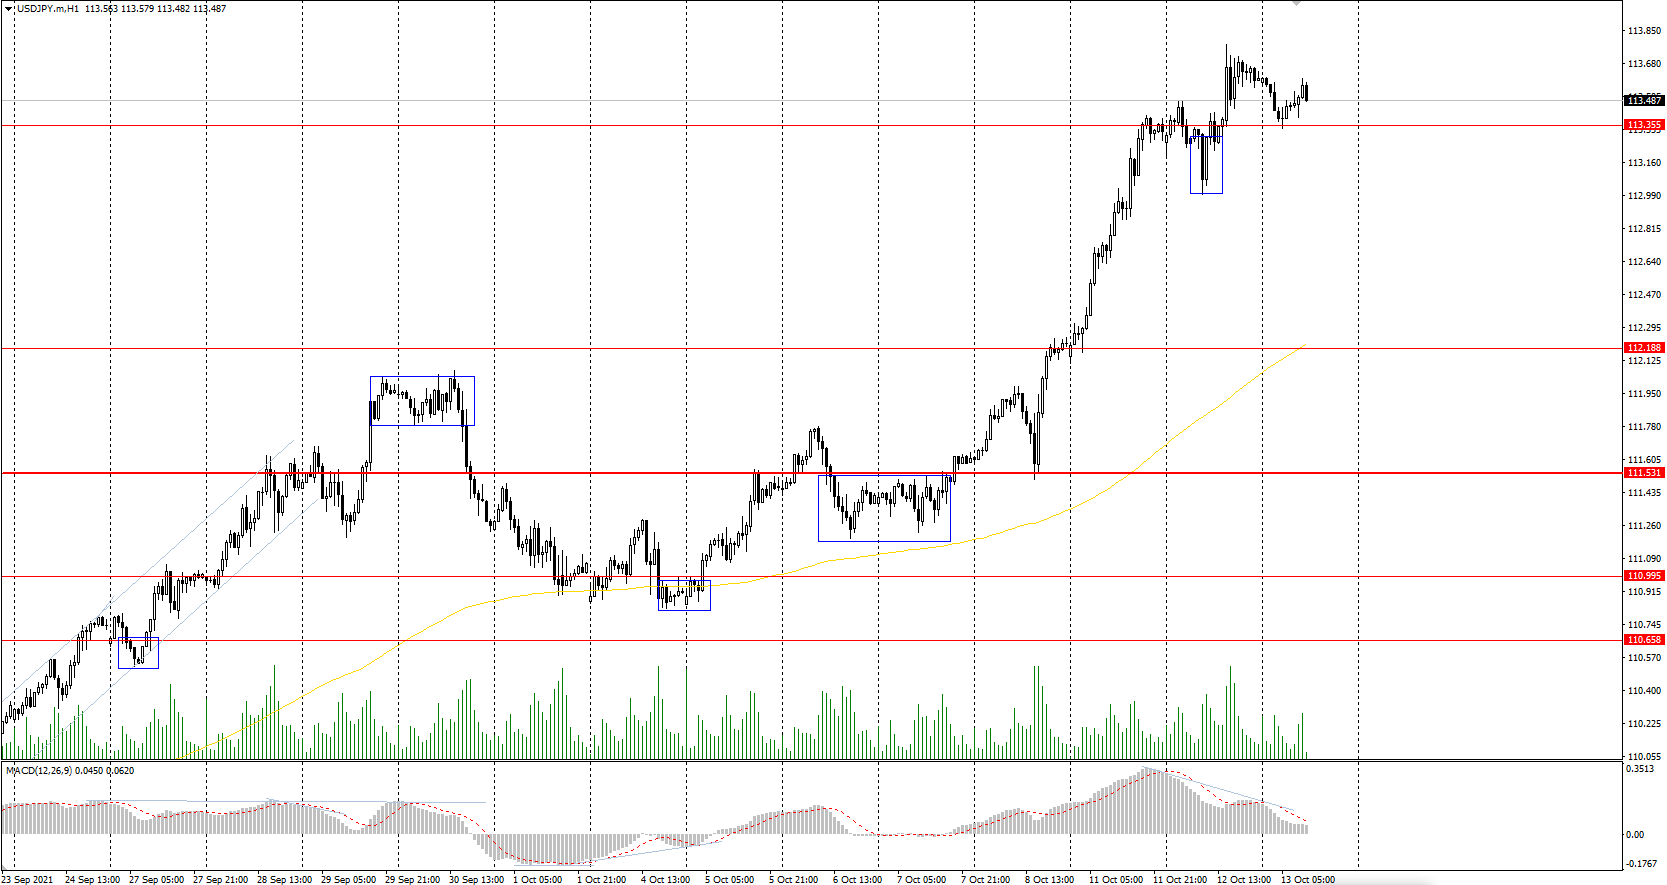
Support levels: 113.35, 112.19, 111.53, 110.99, 110.65, 109.95, 109.63
Resistance levels: 114.40
The main trend of the USD/JPY currency pair is bullish. The Japanese yen is rapidly declining in price against the US dollar. The MACD indicator is positive, but there are signs of divergence. Under such market conditions, it’s better to consider opening buy positions from the support levels near the moving average, since the price has deviated greatly from the average line. Sell positions should be considered only throughout the day from the resistance levels, given there is sellers' initiative.
Alternative scenario: if the price falls below 111.53, the uptrend is likely to be broken.
News feed for 2021.10.13:
- UK GDP (m/m) at 09:00 (GMT+3);
- UK Manufacturing Production (m/m) at 09:00 (GMT+3);
- UK Industrial Production (m/m) at 09:00 (GMT+3);
- US Consumer Price Index (m/m) at 15:30 (GMT+3);
- US FOMC Meeting Minutes (m/m) at 21:00 (GMT+3).
The USD/JPY currency pair
Technical indicators of the currency pair:
Prev Open: 113.26
Prev Close: 113.60
% chg. over the last day: +0.30%
The Bank of Japan is calm about the weakness of the Japanese yen, as the weakening of the national currency boosts exports. The weaker yen is also increasing corporate spending due to higher import prices.
Trading recommendations
Support levels: 113.35, 112.19, 111.53, 110.99, 110.65, 109.95, 109.63
Resistance levels: 114.40
The main trend of the USD/JPY currency pair is bullish. The Japanese yen is rapidly declining in price against the US dollar. The MACD indicator is positive, but there are signs of divergence. Under such market conditions, it’s better to consider opening buy positions from the support levels near the moving average, since the price has deviated greatly from the average line. Sell positions should be considered only throughout the day from the resistance levels, given there is sellers' initiative.
Alternative scenario: if the price falls below 111.53, the uptrend is likely to be broken.
News feed for 2021.10.13:
- US Consumer Price Index (m/m) at 15:30 (GMT+3);
- US FOMC Meeting Minutes (m/m) at 21:00 (GMT+3).
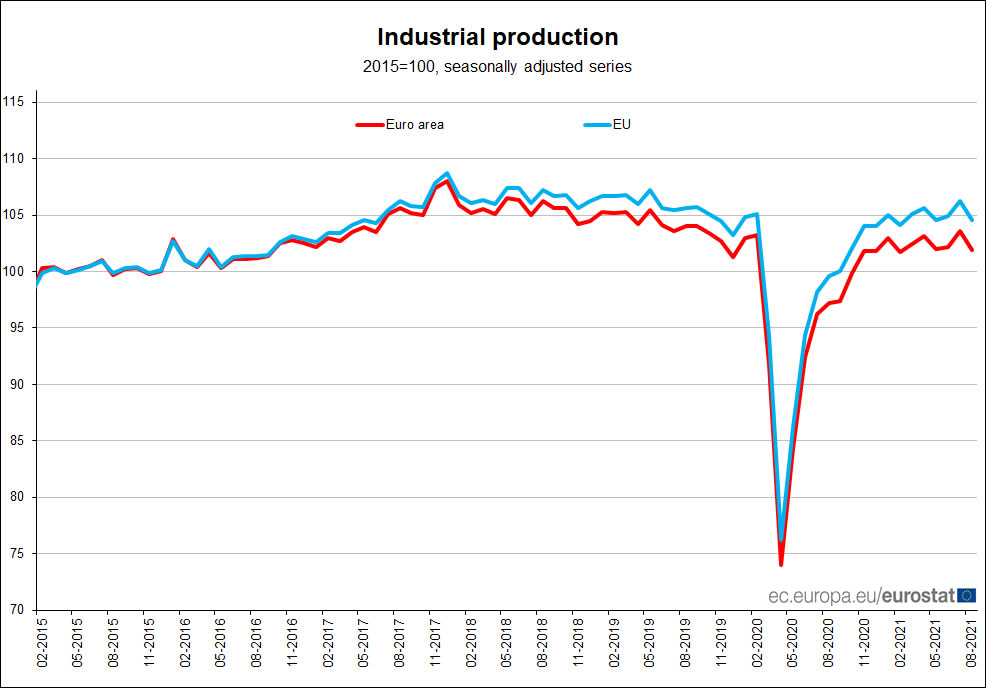
Eurozone industrial production dropped -1.6% mom in Aug, EU down -1.5% mom
Eurozone industrial production dropped -1.6% mom in August, matched expectations. Production of capital goods fell by -3.9%, durable consumer goods by -3.4%, intermediate goods by -1.5% and non-durable consumer goods by -0.8%, while production of energy rose by 0.5%.
EU industrial production dropped -1.5% mom. Among Member States for which data are available, the largest monthly decreases were registered in Malta (-6.3%), Germany and Estonia (both -4.1%) and Slovakia (-3.8%). The highest increases were observed in Denmark (+3.5%), Lithuania (+2.9%) and Luxembourg (+2.1%).
Market Focus On US CPI Rates And Fed’s Minutes
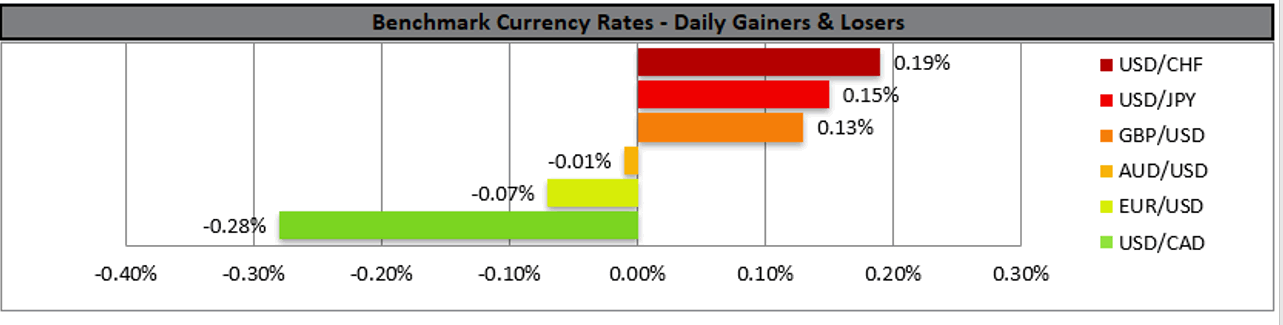
The USD continued to rise against some of its major counterparts yesterday yet corrected somewhat lower during today's Asian session. Market focus seems to shift to the release of the US CPI rates for September as well as the Fed's September meeting minutes. Should the CPI release show that inflationary pressures in the US economy accelerated we may see the USD gaining as such a scenario could increase the pressure on the Fed to start tapering its QE program. On the monetary front we highlight the release of the Fed's September meeting minutes later on in the American session. Any additional hawkish signals stemming from Fed policymaker's statements could provide additional support for the USD. The big miss of the US NFP figure for September could give the Fed cold feet, but the drop of the unemployment rate to its lowest post-pandemic level could provide comfort and encouragement for the Fed to proceed with its tapering plans.
The USD index continued to be on the rise yesterday yet corrected lower during today's Asian session. We maintain our bullish outlook for the index as long as it remains above the upward trendline incepted since the 16th of September. Please note that the RSI indicator seems to have neared the reading of 50, implying that the bullish sentiment may have eased somewhat. Please note that the index's current levels constitute a one year high. If the USD continues to be in high demand as expected, we may see the index breaking the 94.60 (R1) line, thus paving the way for the 95.00 (R2) level. Should the index come under selling interest we may see it breaking the upward trendline prementioned and take aim if not breach the 94.10 (S1) line.
Aussie traders take a good look at employment data
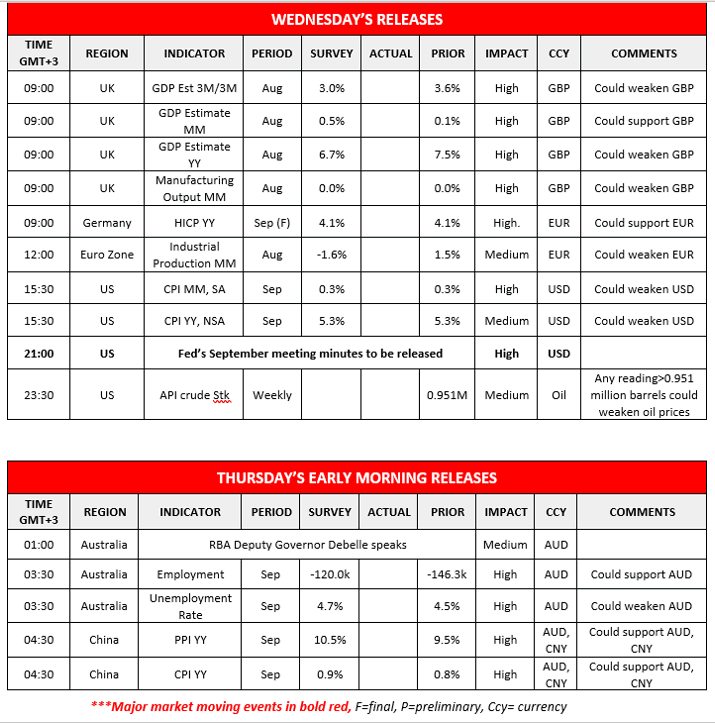
AUD seemed to continue to be in the greens against the USD yesterday yet corrected lower during today's Asian session. On a fundamental level the Aussie seems to be supported by higher energy prices as well as higher commodity prices. It should be noted though that China's import growth rate decelerated considerably over the month of September, which is bad news for Australian exporters of raw materials. On the monetary front, RBA seems determined to maintain its dovish stance by hiking rates at the earliest in 2024, which could weigh on AUD. We expect that RBA deputy Governor Debelle's planned speech during Thursday's Asian session could stir considerable interest among Aussie traders. As for financial releases, we note the release of Australia's employment data for September. Should the actual rates and figures meet their respective forecasts, as shown in the calendar below we see the case for bearish tendencies for AUD to be created. Main reason would be that the rates and figures point towards a slack in the Australian employment market as the unemployment rate rises and the employment change figure remains deep in the negatives despite its expected improvement.
AUD/USD corrected lower after peaking at an almost 1 month high. Yet for our bullish outlook to be altered we would require a clear breaking of the upward trendline incepted since the 30th of September. Please note the downward slope of the RSI indicator below our 4-hour chart as it slowly approaches the reading of 50, reflecting the easing of the bullish sentiment. Should the bears be in charge we may see AUD/USD breaking he 0.7335 (S1) support line, the prementioned upward trendline and aim for the 0.7280 (S2) level. Should the bulls remain in charge, we may see the pair aiming for the 0.7420 (R1) resistance line.
Today's events and expectations
Today during the European session, we get from the UK, August's GDP rates and from the Germany the final HICP rate for September and Eurozone's industrial production for August. Just before Asian session starts we get from the US the API weekly crude oil inventories figure. During tomorrow's Asian session, besides Australia's employment data, we also get China's inflation rates for September.
USD Index H4 Chart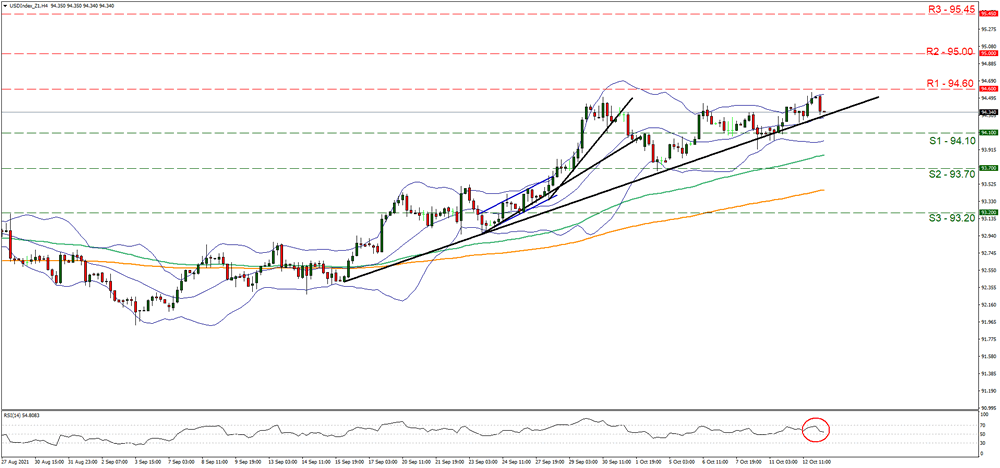
Support: 94.10 (S1), 93.70 (S2), 93.20 (S3)
Resistance: 94.60 (R1), 95.00 (R2), 95.45 (R3)
AAPL H1 Chart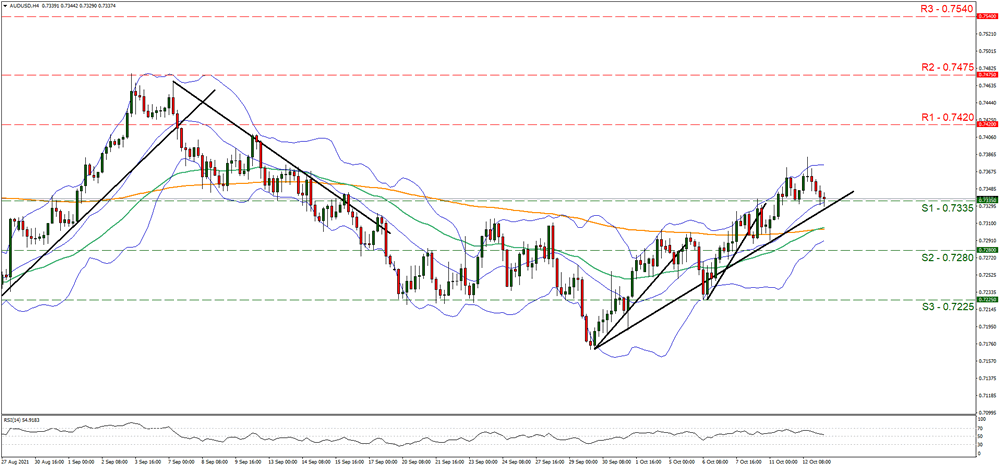
Support: 138.00 (S1), 135.60 (S2), 132.50 (S3)
Resistance: 142.00 (R1), 144.50 (R2), 146.80 (R3)
NZDUSD Starts Sideways Move In Descending Channel
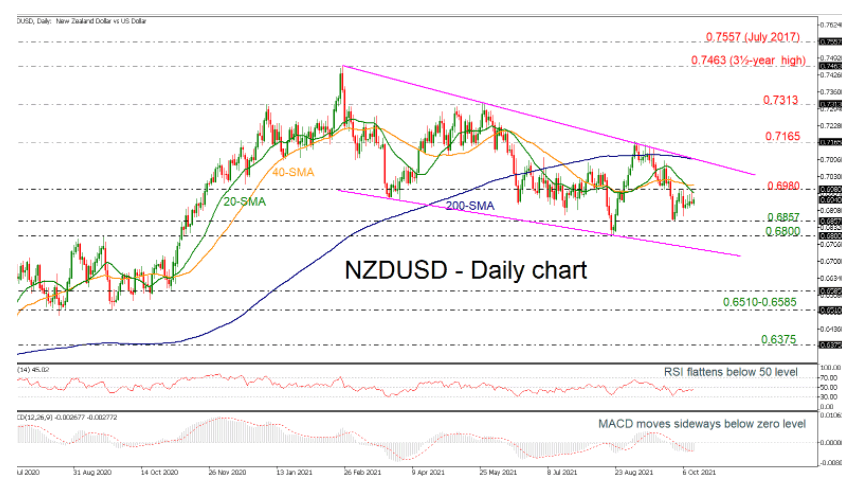
NZDUSD has embarked itself on a new bearish-to-neutral phase after the bulls got defeated once again near the tough resistance of 0.6980 and the short-term simple moving averages (SMAs).
The momentum indicators are currently flagging that the sell-off may came to an end for the near-term timeframe. With the MACD accelerating above its trigger line and above its zero line, and the RSI sailing northwards below its 50 neutral mark, upside corrections are more likely than downside ones.
In the event of an upside reversal, the price will push for a close above the 0.6800 level, where the 200-day simple moving average (SMA) is laying at 0.7100 around the falling trend line. Slightly higher, the 0.7165 barrier could add optimism for a bullish trending market.
The negative structure could meet support at the 0.6857 barrier ahead of the 0.6800 psychological mark. Any drops lower could open the way for a retest of the support line of the descending channel around 0.6750.
All in all, NZDUSD is expected to stay in the bearish phase in the long-term, likely facing some constraints around 0.6980 and 0.6857.
USDJPY Halts Explosive Rally Near 2018 Resistance
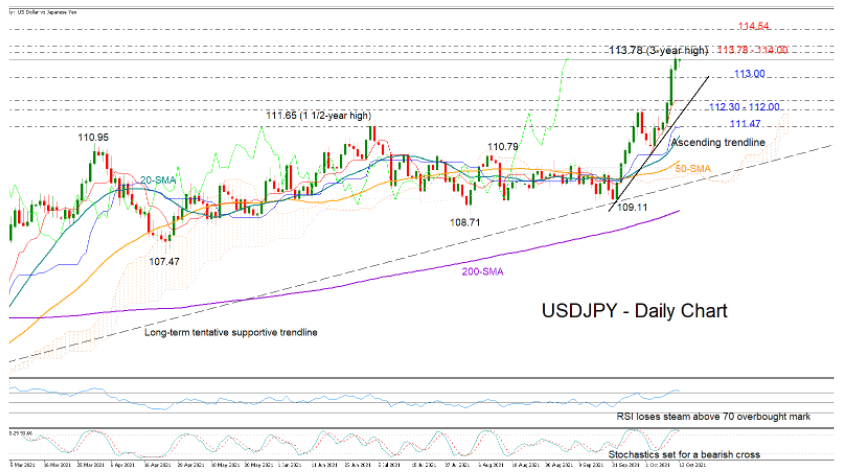
USDJPY started Wednesday’s session with some fatigue after its explosive bullish run hit a wall near the crucial resistance of 113.78 from November 2018.
Following a four-day winning streak, some profit-taking would be normal, with the RSI and the Stochastics endorsing the potential for a downside reversal as the indicators look set to shift south within the overbought area.
The price, however, has comfortably distanced itself above its previous highs of 112.07 and 111.65, building enough space for the bulls to resurface even if a downside correction takes place.
Looking for pivot points, the 113.00 level, which supported yesterday’s rally, could come first into view. Failure to hold above it could see the price decelerating towards the steep ascending trendline currently seen around 112.30 and near the red Tenkan-sen line. Then, a clear close below 112.00 would dampen sentiment, probably strengthening selling pressures towards the restrictive zone of 111.47 – 111.20, where the 20-day simple moving is also positioned.
Long-term traders, however, would not get discouraged unless the pair crosses below the tentative dashed upward-sloping trendline drawn from 2020 lows.
In the event buying forces push the price above the 114.00 resistance, all eyes will turn to the 2018 top of 114.54. The 115.00 mark will be the next target if the rally stretches higher.
Summarizing, USDJPY could give up some gains on profit-taking in the short-term, though only a break below 112.30- 112.00 would reduce confidence on the latest impressive upleg.
Oil Steady, Gold Rises On Higher Yields
Another sideways session for oil
Oil prices traded sideways once again overnight, with a slightly higher US dollar tempering gains. Both contracts edged slightly lower although in the bigger picture Brent crude and WTI remain at the top of their recent ranges. Brent crude eased 0.40% lower to USD 83.30 overnight, with WTI almost unchanged at USD 80.60 a barrel. Both contracts have given up another 20 cents a barrel in a quiet start to Asian trading.
The relative strength indicators (RSIs), short-term technical indicators remain in overbought territory. Speculative long positioning in the futures markets remains heavy leaving open still, the possibility of a sharp sell-off of 5-8 US dollars a barrel at some stage this week. As I have stated previously though, given the state of play in the physical market, a speculative long culling will be a dip to buy and is likely to be very short-lived in duration. A sharp rise in US API Crude Inventories tonight, or muted outlooks for 2022 from Q3 earnings outlooks, could provide that catalyst.
Brent crude has resistance at USD 85.00 and USD 87.00 a barrel, with support at USD 82.00 a barrel. WTI has resistance at USD 82.00, with support at USD 78.70 a barrel. Once again, watch the relative strength indexes (RSIs) this week. The higher into overbought territory they go, the deeper the short-term correction lower will be. One thing also to note, is that natural gas traced out a bearish outside reversal day last Thursday, with prices easing since. A sharp drop to cull speculators in that contract would likely have a similar effect on oil, such is the weight of speculative long positions.
Softer yields support gold
Gold prices edged higher overnight after it once again and held interim support at USD 1750.00 an ounce overnight. Gold finished the overnight session 0.33% higher at USD 1760.00 an ounce where it remains in early Asian trading. Lower long-dated US yields helped gold’s cause but interestingly, gold also rose despite the US dollar continuing to firm overnight. That suggests that gold is seeing an increase in risk aversion buyers at the moment ahead of the start of the US earnings season today.
That said, gold is showing a lack of momentum to make a strong directional move either way for now and although it is well supported into USD 1750.00 now, there is nothing to suggest that my anticipated weekly range of USD 1740.00 to USD 1780.00 an ounce is under threat. In the bigger picture, the threat of the Fed taper, leading to a continuing climb in US yields and the US dollar should continue to cap gold rallies and the bias is still for a move lower in the coming weeks.
Gold has interim support at USD 1750.00 and USD 1740.00 an ounce with more important support at USD 1720.00 an ounce, and if US yields rise, it could be tested. Resistance lies at USD 1780.00 followed by the USD 1800.00 region, containing the 100 and 200-day moving averages (DMAs) on each side of it, a formidable barrier.
The US Dollar Remains Firm
Dollar maintains upward momentum
A fall in US long-dated yields was offset by a rise in the short-end yields overnight as markets continued to price in the Fed taper and higher near-term inflation expectations. The curve flattening allowed the US dollar to maintain its upward momentum aided by risk hedging buying ahead of US inflation data tonight and nervousness about growth outlooks in the Q3 earnings season releases.
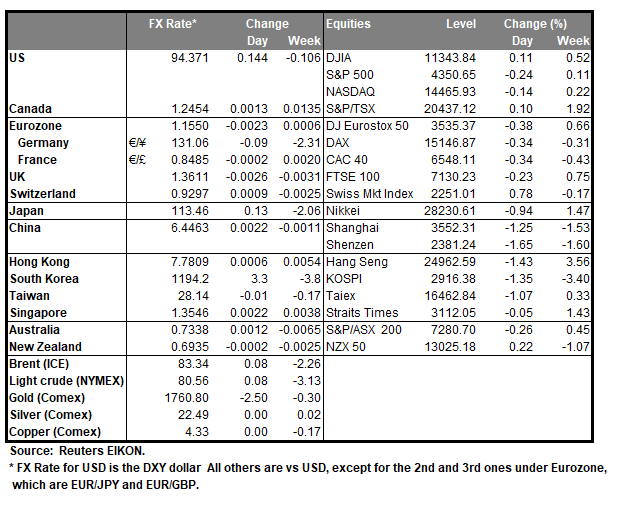
The dollar index climbed 0.16% to 94.51 overnight before unwinding those gains this morning, retreating 0.16% to 94.35. The passing of the temporary extension of the US debt ceiling legislation through the House of Representatives this morning seems to have temporarily relieved some of the nerves that have been supporting the US dollar. That is likely to be short-lived and a close well above 94.50 this evening will signal the next leg higher for the US dollar. For now, resistance is holding at that level, but the pullbacks are getting shallower, hinting that a break higher is coming.
EUR/USD and GBP/USD have unwound overnight losses, rising 0.18% to 1.1550 and 1.3615 and both remain rangebound with a bias to the downside. EUR/USD remains the more vulnerable after an ECB council member suggested the ECB would fall short of its 2023 inflation targets. Yield differentials will weigh on the single currency. The Australian and New Zealand dollars probed the topside overnight, but both ultimately unwound those gains as heightened risk sentiment globally capped gains. Both will need soft US inflation print tonight to continue their recovery.
In Asia, the PBOC left the USD/CNY steady at 6.4612 and continues to show little interest in weakening the currency. It looks like the Bank of Korea intervened yesterday to cap gains in the USD/KRW ahead of the important 1200.00 level. A pattern of behaviour which I expect to see much more of by regional central banks as the US dollar continues rising in Q4. A lower US dollar has seen Asian FX rally modestly this morning, but overall markets remain nervously watching interest rate and inflation developments in the US.
Asian Equities Are Mixed Today
Asian equities are mixed today with Asia’s heavyweights content to follow the lead of Wall Street overnight, where pre-earnings nerves, a flattening yield curve and a higher US dollar saw stocks edge lower. The S&P 500 eased by 0.24%, the Nasdaq edged 0.14% lower, and the Dow Jones fell by 0.35%. Ominously, US futures have continued lower once again in Asia. S&P 500 and Nasdaq futures falling 0.30% and Dow futures easing another 0.10%. Overall, it looks as if US markets are reducing exposure into the US CPI and the start of the earnings season. US markets are very much exposed to a tempering of 2022 outlooks by corporate heavyweights this time around and combined with inflation/taper fears we can expect a lot more two-way volatility in Q4.
Asia has contented itself with following Wall Street’s lead today ahead of China trade data and most markets are lower this morning. The Nikkei 225 is down 0.30% but the Kospi is 1.0% higher, led by exporting and manufacturing stocks on what I assume, is a weaker won. Mainland China is mixed, with the Shanghai Composite down 0.50% while the CSI 300 is steady, down just 0.05%. Hong Kong markets are closed this morning due to a typhoon.
ASIAN equity markets gain ground
ASEAN markets are very much in the green, as multiple announcements reopening the borders to tourism this week maintain bullish momentum across the region. It appears that ASEAN heavyweights are becoming a defensive play, with their exposure to commodities and the upside of tourism restarting, with its positive downstream effects. Singapore has leapt 1.30% higher today, with Jakarta climbing 0.35% and Bangkok rallying by 0.75%. Kuala Lumpur is 0.25% higher and Manila has gained 0.50%.
Australian markets have been unable to shrug off the drop in Wall Street overnight, and the slump in the US futures again in Asia, which has pushed local markets lower. The All Ordinaries has fallen by 0.25%, while the ASX 200 has retreated by 0.45%.
European markets are likely to take their cue from Wall Street and open slightly lower this afternoon. Wall Street will be very much beholden to the US inflation data tonight, but any gains will be tempered by caution ahead of the US earnings avalanche and persistent inflation nerves.
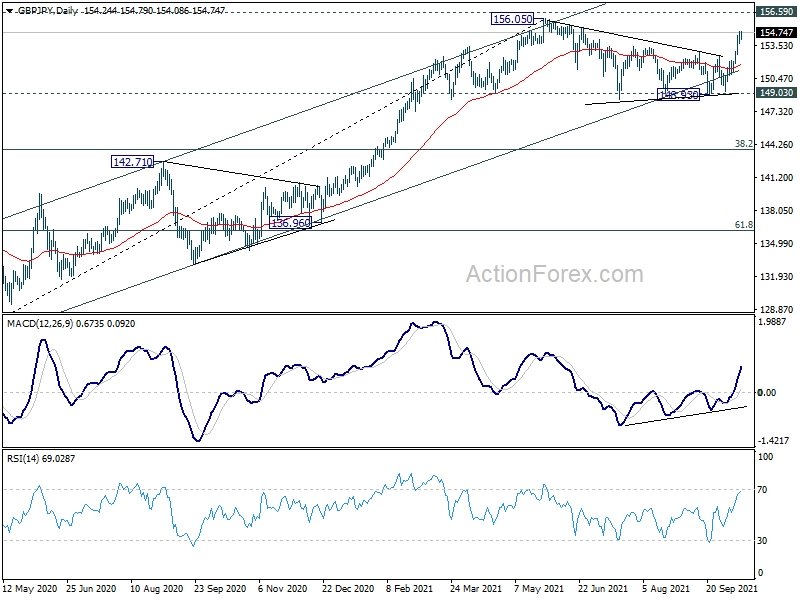
GBP/JPY Daily Outlook
Daily Pivots: (S1) 153.77; (P) 154.30; (R1) 154.91; More...
Intraday bias in GBP/JPY remains on the upside and outlook is unchanged. As noted before, corrective pattern from 156.05 should have completed after defending 149.03 key support. Further rise would be seen to retest 156.05 high. On the downside, below 153.66 minor support will turn intraday bias neutral and bring consolidations first, before staging another rally.
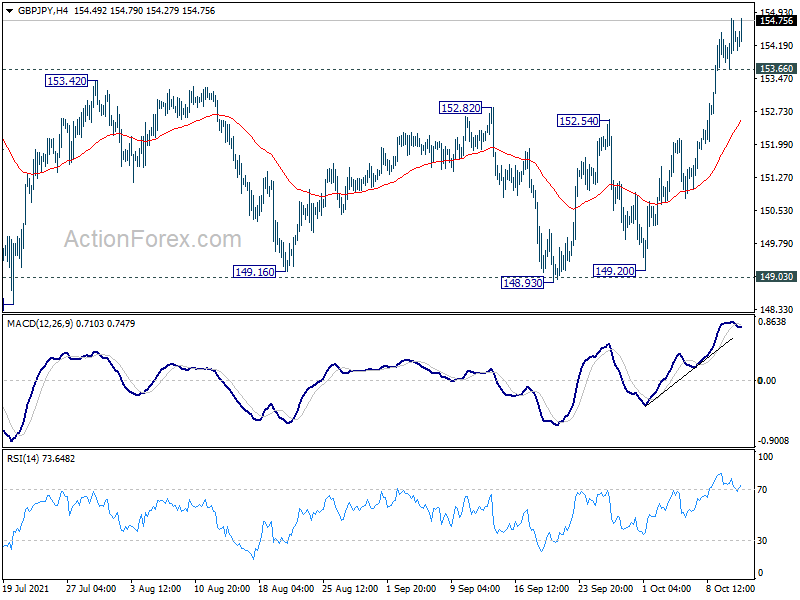
In the bigger picture, rise from 123.94 is seen as the third leg of the pattern from 122.75 (2016 low). As long as 149.03 support holds, such rise would still resume at a later stage. However, sustained break of 149.03 support will indicate rejection by 156.59 (2018 high). Fall from 156.05 would at least be correcting the whole rise from 123.94 (2020 low). Deeper fall would be seen back 38.2% retracement of 123.94 to 156.05 at 143.78 first.