Sample Category Title
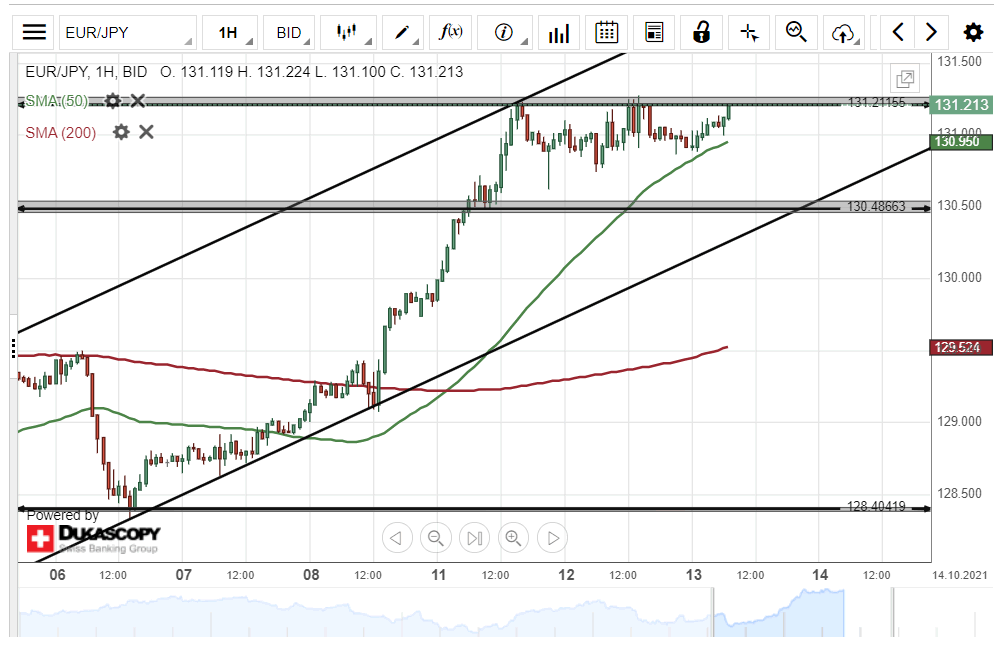
EUR/JPY Consolidated Below 131.21
The common European currency consolidated below the 131.21 level against the Japanese Yen on Tuesday. The currency pair traded between the 130.50/131.21 area during Tuesday's trading session.
Technical indicators suggest buying signals on the daily time-frame chart. Most likely, the EUR/JPY exchange rate could edge higher within this session.
However, the resistance level at 131.21 might still provide resistance for the currency exchange rate during the following trading session.
USD/JPY Daily Outlook
Daily Pivots: (S1) 113.15; (P) 113.47; (R1) 113.93; More...
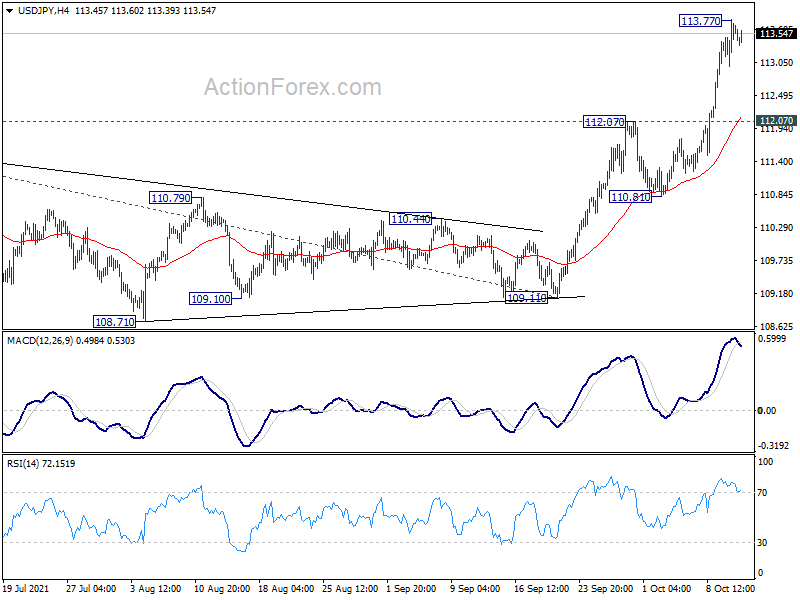
Intraday bias in USD/JPY is turned neutral first and some consolidations could be seen below 113.77 temporary top. Downside of retreat should be contained above 112.07 resistance turned support to bring rise resumption. Break of 113.77 will resume larger rise from 102.58 to 61.8% projection of 102.58 to 111.65 from 109.11 at 114.71. Firm break there will target 100% projection at 118.18 next.
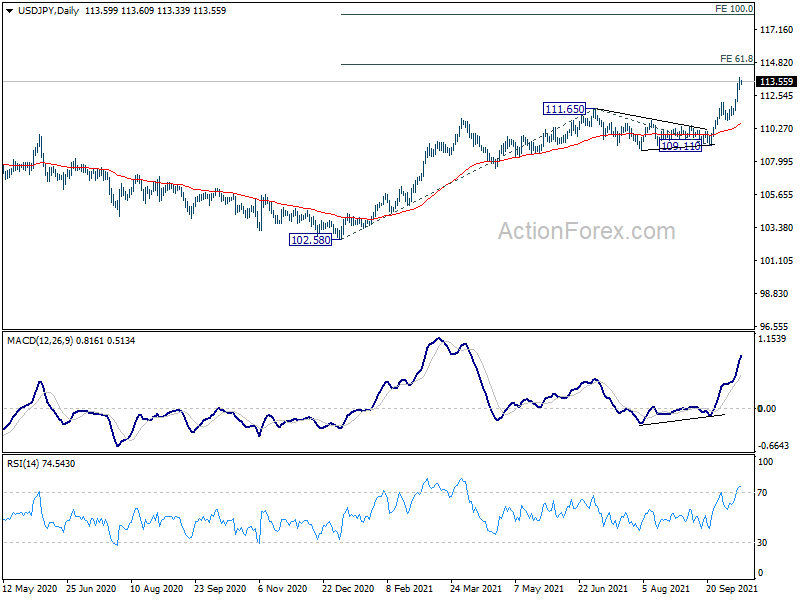
In the bigger picture, corrective decline from 118.65 (2016 high) should have completed at 101.18 already. Rise from the 102.58 is seen as the third leg of the up trend from 101.18. Next target is 114.54 resistance and then 118.65 high. This will now be the preferred case as long as 108.71 support hold, even in case of pull back.
USD/CHF Daily Outlook
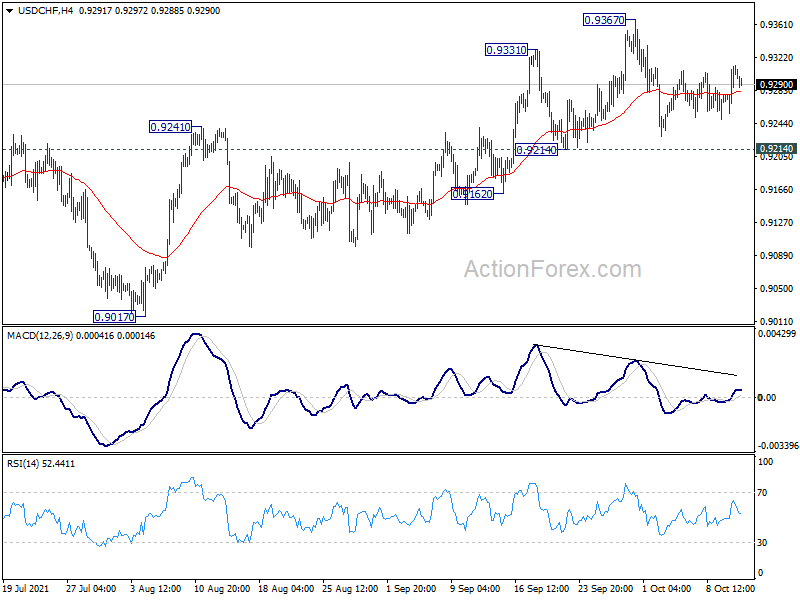
Daily Pivots: (S1) 0.9272; (P) 0.9292; (R1) 0.9328; More....
Intraday bias in USD/CHF remains neutral as consolidation from 0.9367 is extending. On the upside, break of 0.9367 will resume the rise from 0.8925 to 0.9471 key resistance next. On the downside, however, break of 0.9214 will turn bias back to the downside for 0.9017 support again.
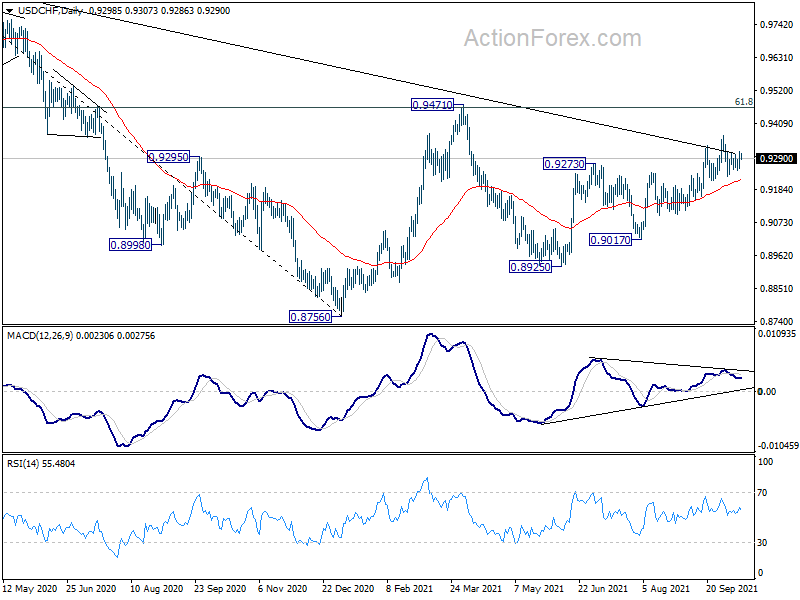
In the bigger picture, the strong rally above 55 week EMA (now at 0.9188) now tilts favor to the case of bullish trend reversal. That is, decline from 1.3042 (2016 high) is probably completed at 0.8756 already. Sustained break of 0.9471 resistance should confirm this case and pave the way to retest 1.0342 ahead. However, rejection by 0.9471 will mix up the outlook again and retain some medium term bearishness.
GBP/USD Daily Outlook
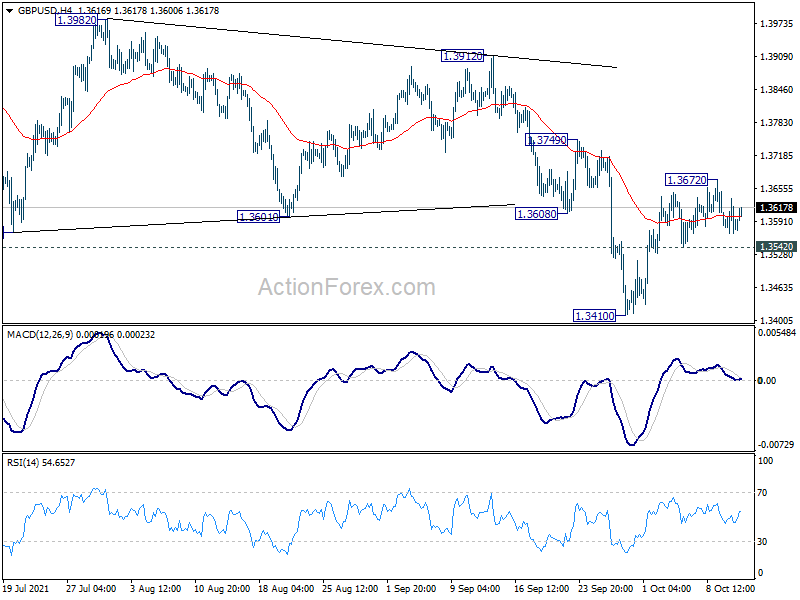
Daily Pivots: (S1) 1.3560; (P) 1.3598; (R1) 1.3628; More...
GBP/USD is staying in consolidation below 1.3672 temporary top and intraday bias remains neutral first. On the downside, break of 1.3542 minor support will suggest that rebound from 1.3410 has completed, and fall from 1.4248 is ready to resume. Intraday bias will be turned back to the downside for 1.3410 and below. On the upside, though, above 1.3672 will resume the rebound to 55 day EMA (now at 1.3717) first.
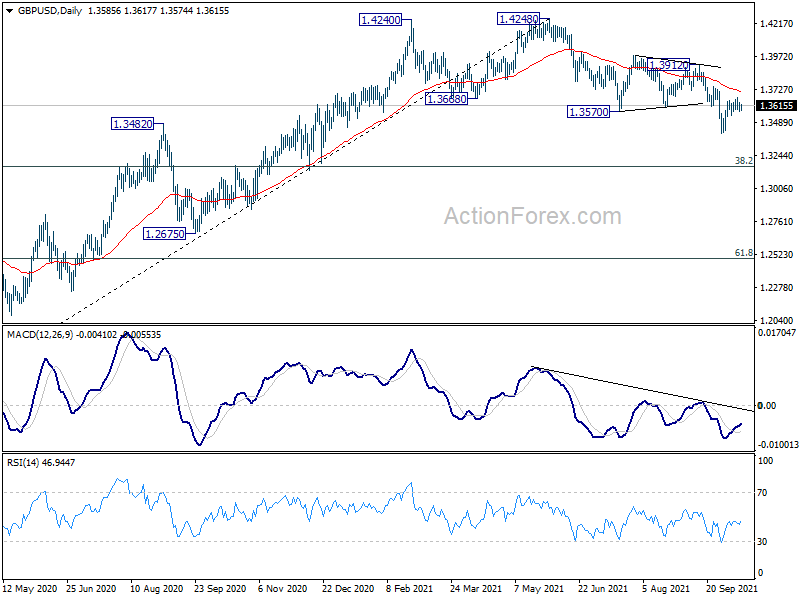
In the bigger picture, fall from 1.4248 is at least a correction to the up trend from 1.1409 (2020 low). Such correction could extend to 38.2% retracement of 1.1409 to 1.4248 at 1.3164 before completion. However, considering the rejection by 1.4376 key resistance (2018 high), sustained trading below 1.3164 will argue that it's indeed a bearish trend reversal and would target 61.8% retracement at 1.2493. Nevertheless, break of 1.3912 resistance will revive medium term bullishness and target 1.4248/4376 resistance zone again.
Daily Technical Analysis
EUR/USD
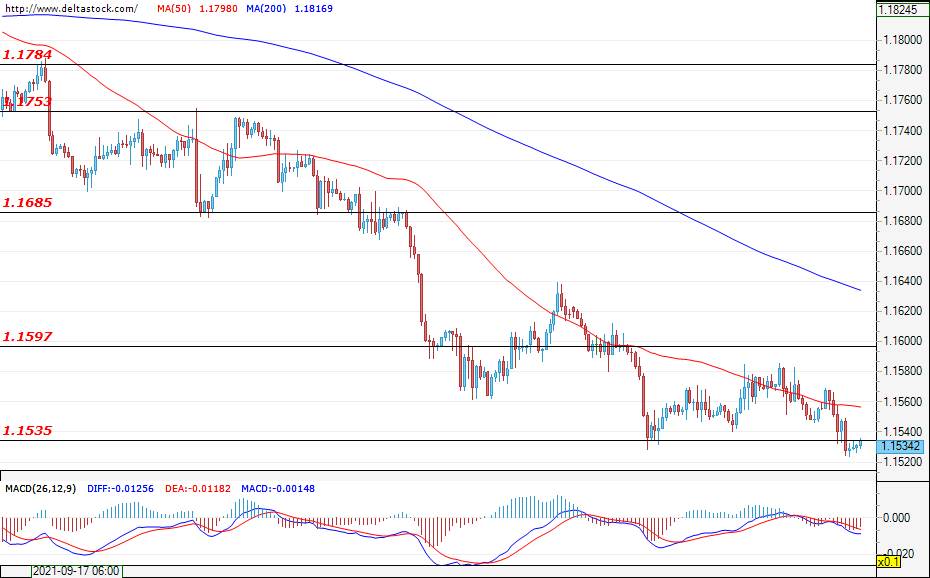
Current level - 1.1534
The common European currency continues to depreciate against the dollar as the currency pair breached the support at 1.1535 in the late hours of yesterday's trading session, although, at the time of writing, the breach is yet to be confirmed. A confirmed breach of the mentioned support would strengthen the negative sentiment and lead to further declines. Alternatively, if the support level of 1.1535 manages to resist the sellers' pressure, then we would witness a range trading between 1.1535 and 1.1597 for a few more days. The data on the core CPI for the U.S. that is to be announced at 12:30 GMT today could lead to an increased volatility.
| Resistance | Support | ||
| intraday | intraweek | intraday | intraweek |
| 1.1597 | 1.1750 | 1.1535 | 1.1410 |
| 1.1685 | 1.1780 | 1.1500 | 1.1280 |
USD/JPY
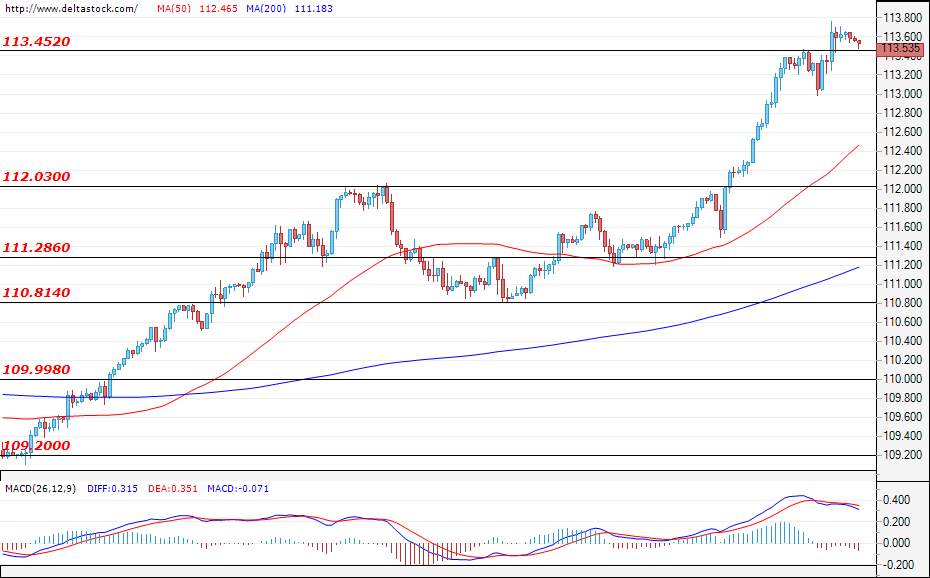
Current level - 113.53
The dollar continues to appreciate against the yen and, during yesterday’s session, managed to breach the resistance of 113.45, although the breach was not confirmed. At the time of writing, the pair is trading just below 113.45 and the expectations are for the Ninja to enter a short consolidation phase around said zone before restoring its uptrend. In the negative direction, the first major support lies at 112.00.
| Resistance | Support | ||
| intraday | intraweek | intraday | intraweek |
| 113.45 | 113.60 | 112.00 | 111.80 |
| 113.60 | 114.50 | 111.30 | 110.00 |
GBP/USD
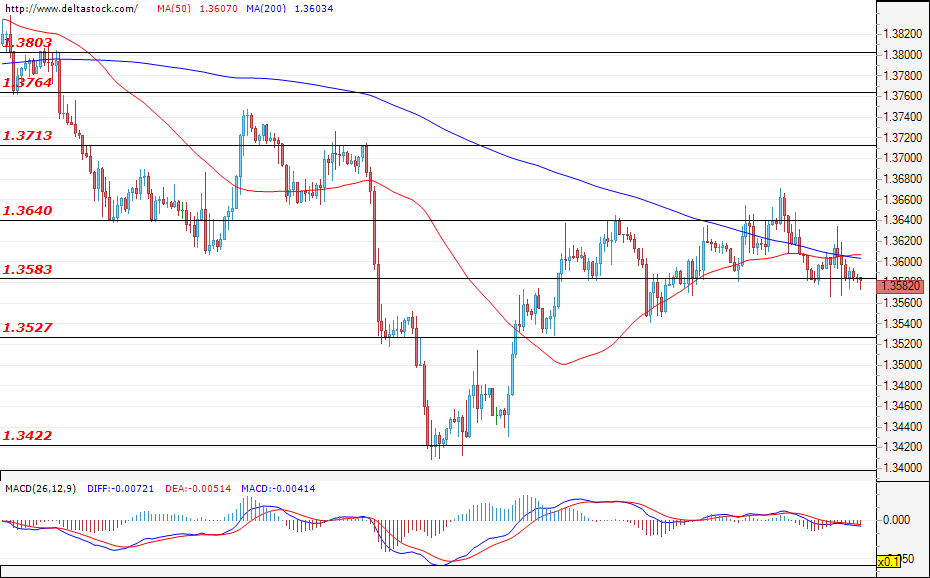
Current level - 1.3582
Following an unsuccessful test of 1.3580, the Cable is headed towards a test of the resistance level of 1.3640 that could pave the way for the pair towards a test of the major resistance of 1.3713. In the negative direction, the first support lies at the previously mentioned level of 1.3580, while the major support is found at the local bottom of 1.3420.
| Resistance | Support | ||
| intraday | intraweek | intraday | intraweek |
| 1.3640 | 1.3760 | 1.3580 | 1.3420 |
| 1.3710 | 1.3800 | 1.3530 | 1.3420 |
The UK 100 Recovers To Major Resistance
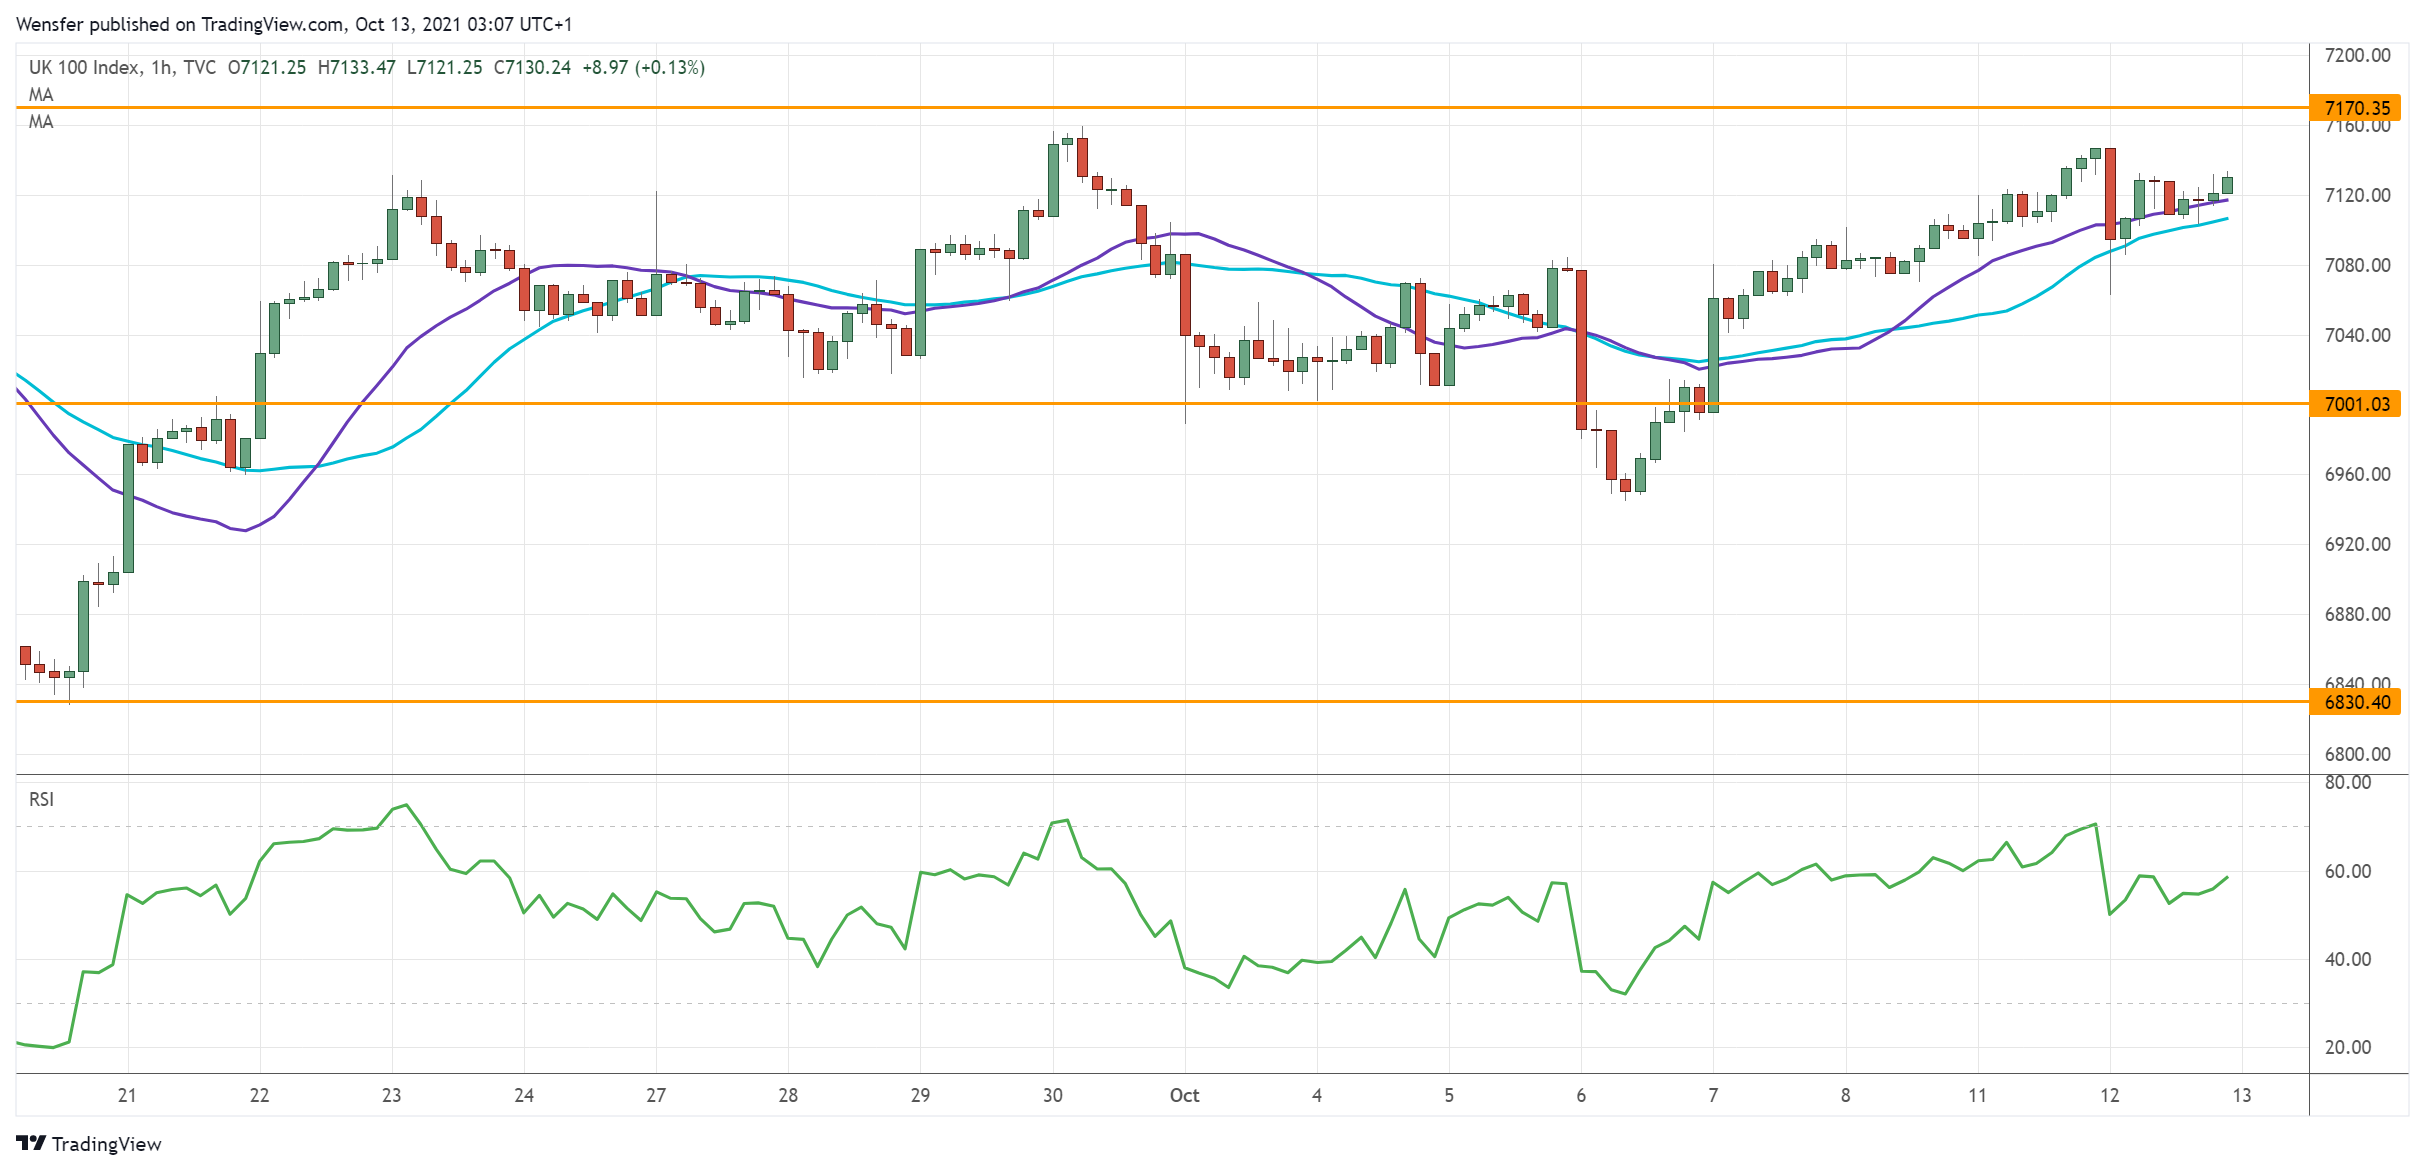
The FTSE 100 inched higher after Britain’s unemployment rate fell to 4.5%.
The index has met strong buying interest over the key support (6830) on the daily chart. The triple bottom is an indication of the bulls’ commitment to maintaining the uptrend.
A surge above 7085 has attracted more attention as the price swiftly recovered above the psychological tag of 7000 once again.
A breakout above 7170 would signal a bullish continuation, triggering a runaway rally as those who are patiently waiting on the sidelines bid up.
EUR/USD Lacks Support
The US dollar consolidates gains as traders await the FOMC Minutes to confirm the tapering in November.
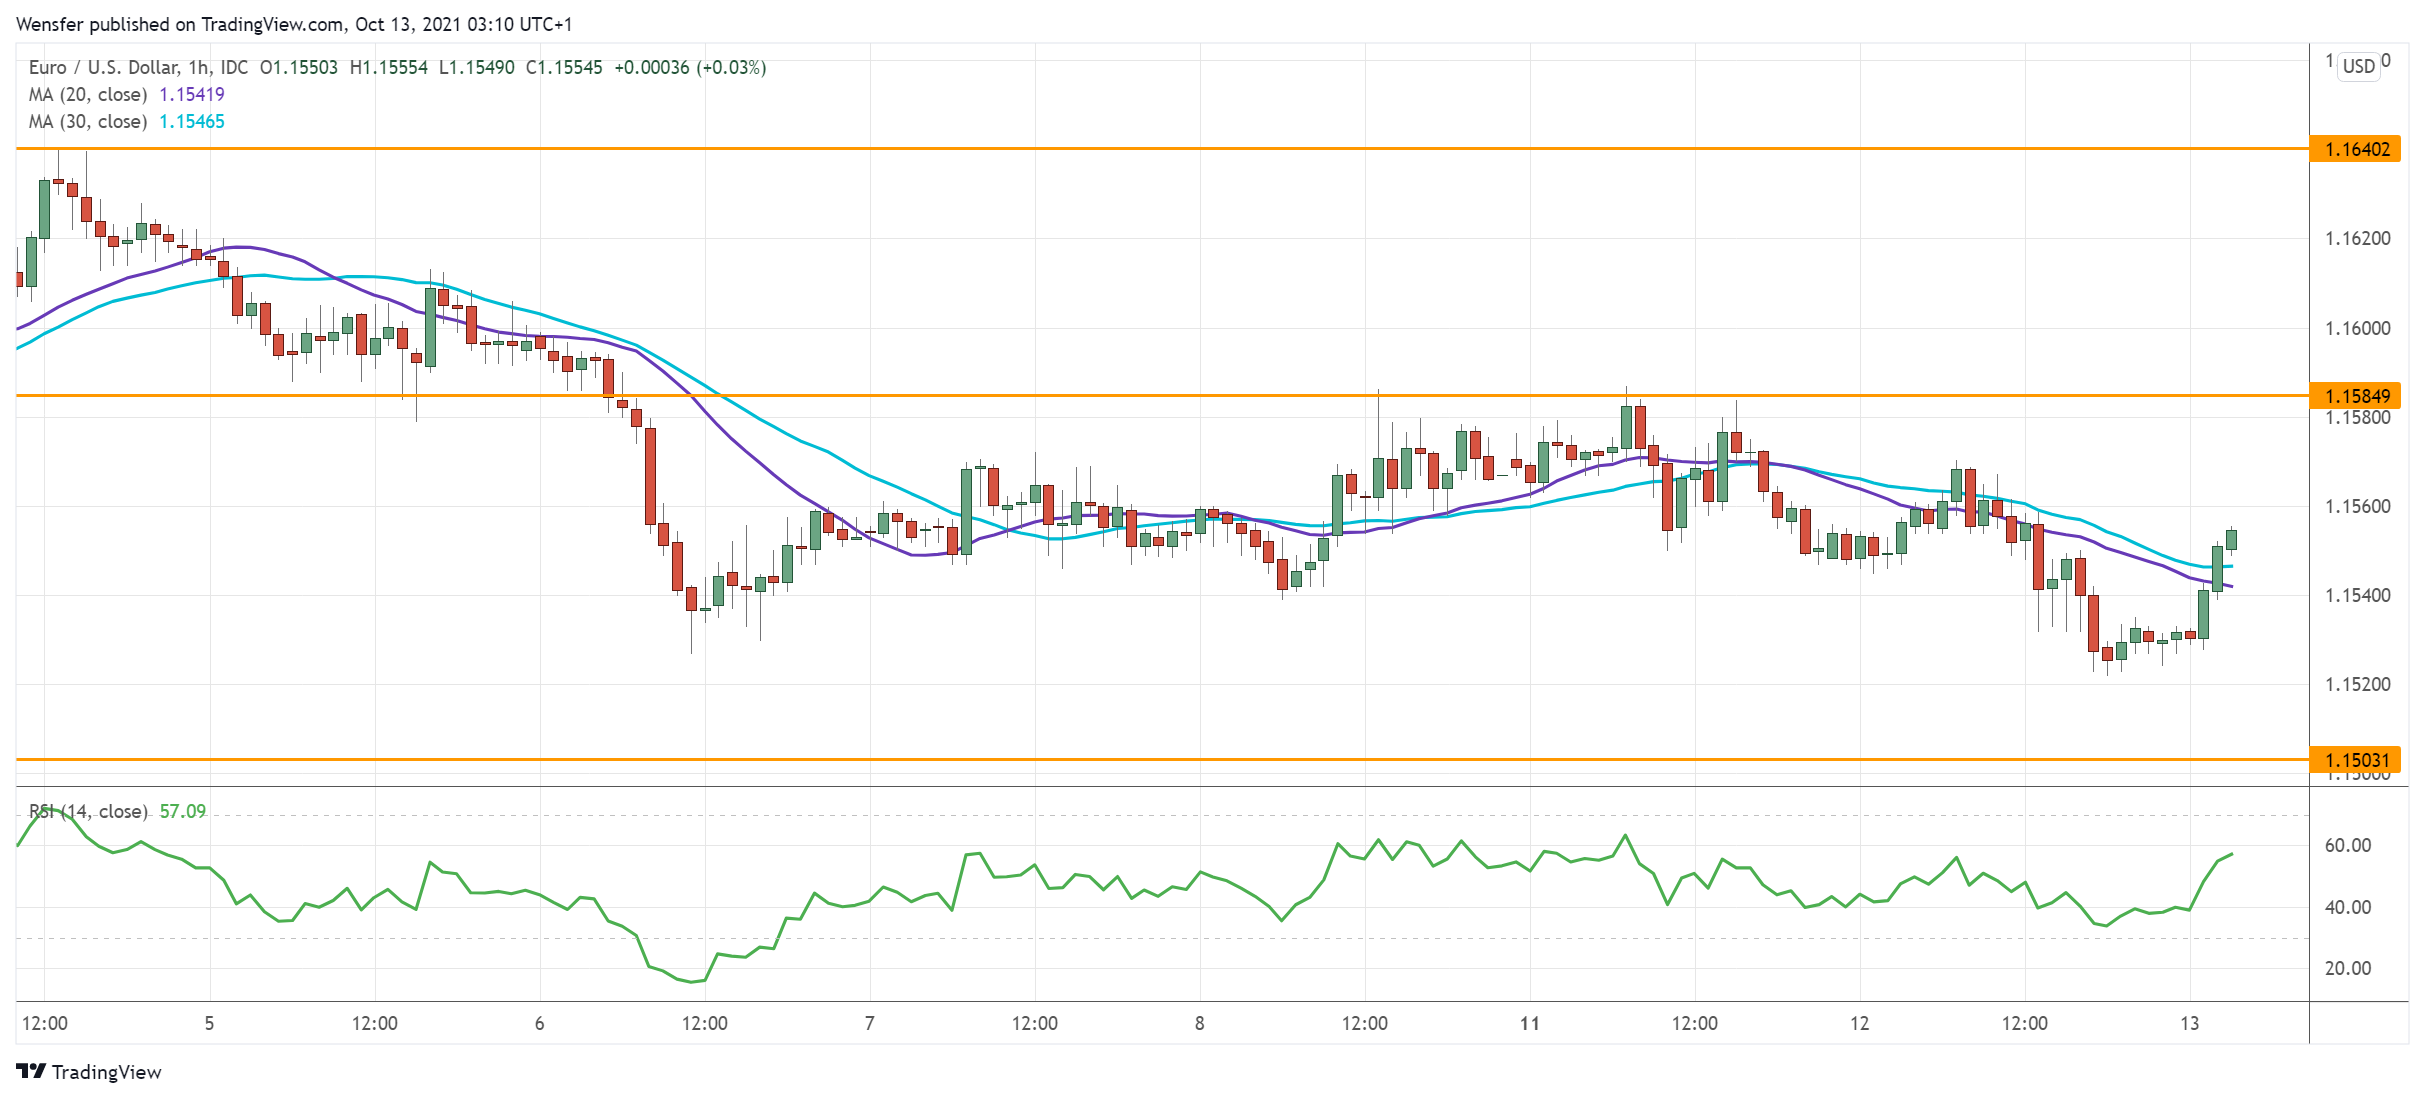
The pair has sunk into bearish territory after it broke the daily support at 1.1620. The latest rebound has been capped by the fresh supply area around 1.1585. As the RSI recovered into the neutral zone, short-term trend followers may continue to sell into strength.
The psychological level of 1.1500 would be the next target when the current consolidation ends. A deeper correction would drive price action to 1.1400.
GBP/USD Tests Supply Area
The pound climbs as solid payrolls support the Bank of England’s first post-pandemic interest rate hike.
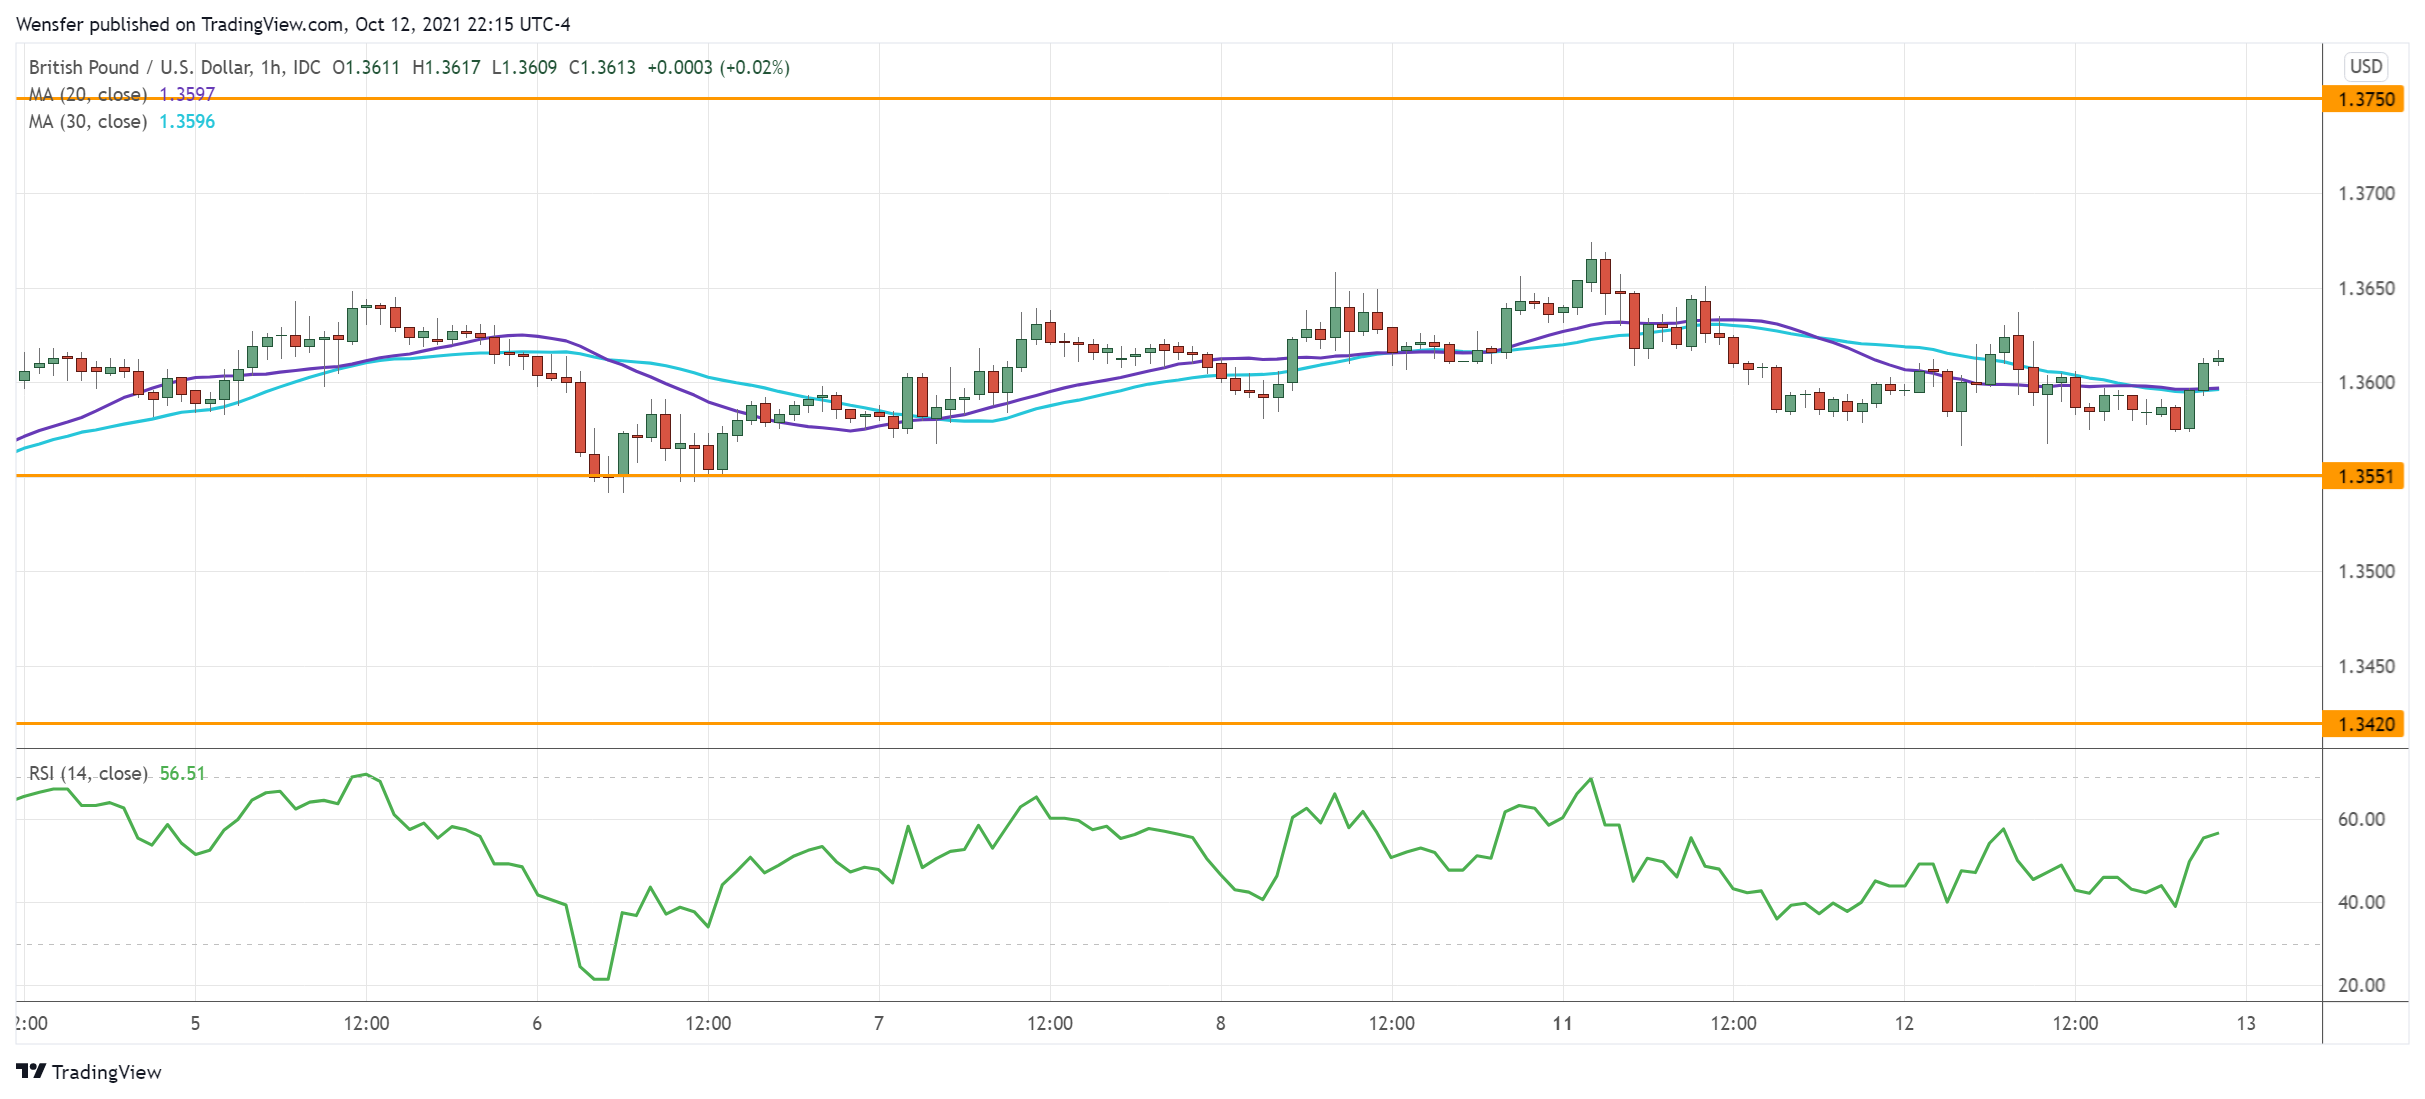
A series of higher highs have prompted sellers to cover their bets. The pair is now testing the supply zone around 1.3650, this was previously major support on the daily chart.
Sentiment remains bearish judging by falling moving averages. Strong selling interest could be below 1.3750 as sellers wait to fade the rebound. 1.3550 is the immediate support and its breach would send the sterling back to 1.3420.
S&P 500 Continues Its Slide, SNB Keeps Euro Down
The US market worked in full force yesterday, with the debt market returning to action after the long weekend. They retain the trends of recent weeks with pressure on equity and bond markets as investors continue to price in a tightening of the Fed’s monetary policy.
Since the beginning of September, there has been a clear downward trend in the S&P500. Unlike the correction episodes of recent months, we see what appears to be a reluctant slide. But it is this dynamic that has the potential to be the most dangerous trap for speculative bulls. The latter can link to buying on downturns, betting on a rebound after a correction.
More experienced investors and traders are likely to note that equities’ sell-offs have been noticeable in recent weeks as they attempt to rise from increasingly lower levels. The 50-day moving average has been in the role of firm resistance since the end of September, although it was strong support before.
It would not be surprising if the short-term buyers would lose their support in the coming weeks or even days, accelerating the corrective momentum and allowing the S&P500 to pull back from the current 4340 to the 200 SMA, which is now near 4170.
In the most traded currency market pair, there is an even more persistent downward trend. The EURUSD has rolled back to 1.1550 from the local peak at 1.1900 in early September, experiencing a systematic decline. Since late September, the RSI on the daily charts has been moving around 30, an oversold area, but that hasn’t stopped the single currency from rewriting its lows from last July.
As we pointed out earlier, there are no significant support levels in the pair up to the 1.14000 area. However, locally, one may notice buying on declines. A consolidation above 1.1600 by the end of the week may allow us to talk about breaking the descending trend and launching a broader rebound, but the bulls will have to try harder for that.
The Swiss National Bank, which is preventing the CHF from rising against the Euro, might be on the side of the Euro again. The EURCHF pair has formed a “floor” near the level of 1.07, approximately where it was in August. The SNB predominantly monitors the CHF against the Euro but doesn’t neglect the USD either. The USDCHF has been on an uptrend since August, so the intensity of the interventions against the Euro might weaken, reducing the support for the single currency. In any case, one hardly can expect the Swiss National Bank to reverse any meaningful long-term trends.
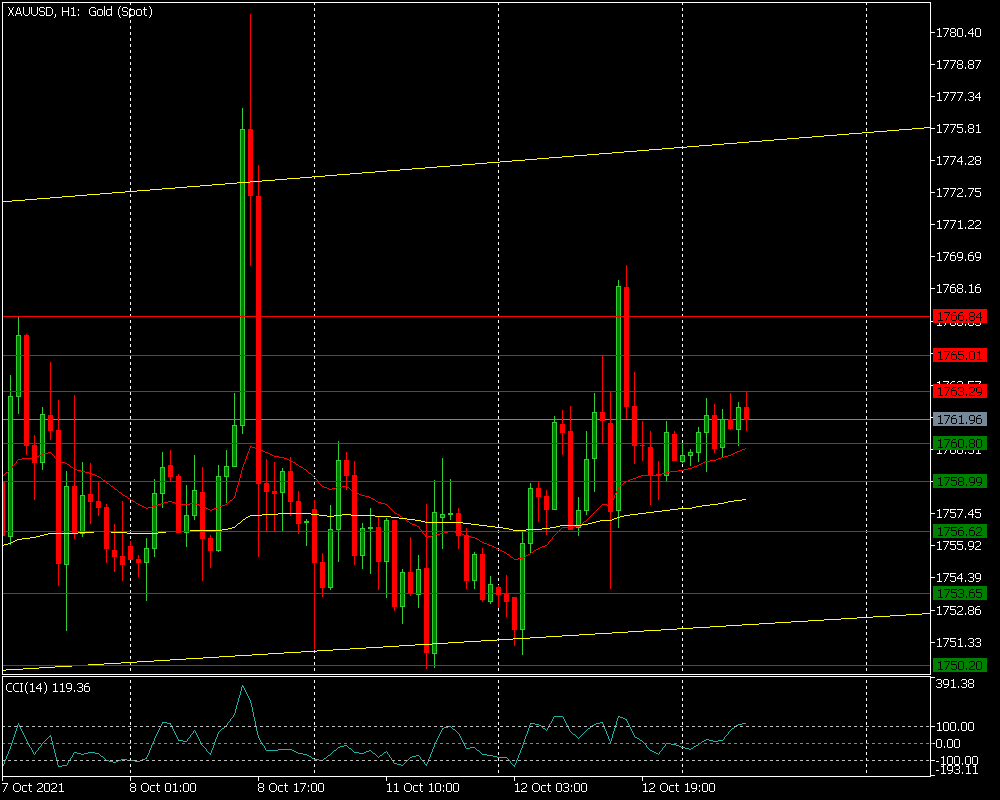
XAUUSD Is Possibly Bullish
Technical analysis
The CCI suggests a possible upwards correction
The price is above EMA(120) and EMA(24) which is advantageous for bulls.
Most likely scenario - BUY
Target prices: 1,763.29 1,765.01 1,766.94
Alternative scenario - SELL
Target prices: 1,760.80 1,758.99 1,756.62
Key levels
Support 1,760.80 1,758.99 1,756.62
Resistance 1,763.29 1,765.01 1,766.94