

Sample Category Title
Down, Down and Away for the Yen?
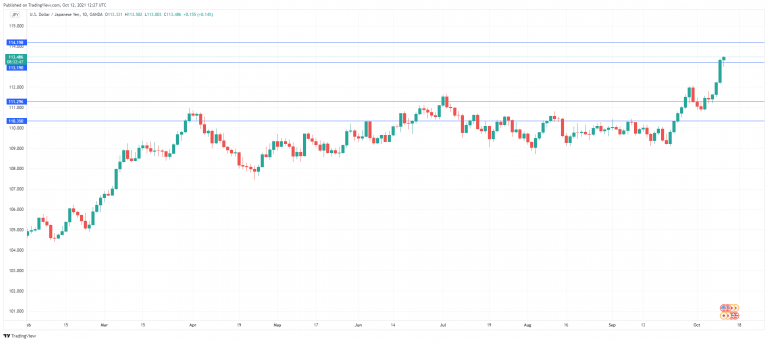
The Japanese yen has taken a pause from Monday’s slide. Currently, USD/JPY is trading at 113.44, up 0.10% on the day.
Yield differentials send yen tumbling
The Japanese yen had an awful start to the week. USD/JPY climbed 0.98% on Monday as the pair punched into 113-territory for the first time since December 2018. US Treasury yields have been on a sharp upward trajectory since late the Fed’s policy meeting in September, when the central bank hinted that it could start to taper as soon as November. The 10-year yield has risen to 1.6% for the first time since June, buoyed by expectations that the Federal Reserve will taper prior to the end of the year.
Investor enthusiasm for an imminent tapering was not curbed by last week’s disappointing US employment report, as the economy added only 194 thousand new jobs, well below expectations. This was the second straight NFP report with a weak gain, but the dollar didn’t miss a beat, as the market fully expects a taper in December, perhaps even in November. The soft NFP was forgiven as the unemployment rate and wage growth showed an improvement in September. The Fed has insisted that high inflation is transient, but with inflation hitting a 30-year high, it’s clear that the Fed cannot simply dismiss inflation as being temporary, and will have to tighten policy sooner rather than later.
The yen is extremely sensitive to the dollar/yen yield differential, and the yen has taken it on the chin as US yields have been moving higher. USD/JPY rallied strongly overnight, and if US yields continue to rise, the yen is likely to test the 114.00 level. The energy squeeze is also weighing on the yen, as oil is denominated in US dollars.
USD/JPY Technical
- We have seen a clear break above resistance at 112.20. The next key resistance level is 114.20, the high in November 2018. USD/JPY has strong upward momentum and could break above this line in the short-term.
- There is support at 111.29, followed by 110.34
Nerves Remain But Investors Holding Firm
We're seeing modest losses across Europe this morning, while US futures have recovered earlier losses to trade a little flat ahead of the open on Wall Street.
Clearly, there's plenty of uncertainty in the markets that's been a drag on sentiment over the last couple of months but equally, investors are not conceding defeat easily. Perhaps their old friend TINA is driving this behaviour, as the fundamentals certainly do not justify such resilience.
While the lack of alternatives is certainly an argument for remaining long equity markets, it's hardly a healthy reason. And this is after more than a decade of central banks effectively backstopping any sell-offs, which creates the FOMO buy-the-dip siege mentality that now looks relatively reasonable, by comparison.
But as we've learned over the last decade or so, no matter how hard it can be to justify the apparently inflated levels in stock markets at times, or how long and severe the list of downside risks become, we never seem to far away from a record high. Will this time be different as central banks withdraw pandemic stimulus measures and raise rates? It should and yet I doubt it.
For one, markets are pricing in some rather aggressive tightening from central banks over the next year or so (or phasing out of stimulus, in some cases) which could quite easily be unwound as economies slow and inflation shows itself to be largely transitory. A year is a long time, especially at a time when everything seems to be evolving so rapidly. It's not that long ago that policymakers were convinced inflation was entirely transitory.
The next few months are huge in terms of how bad the energy crisis will become, what the knock-on effects will be, how bad another wave of Covid will be and what that will mean for economic recoveries as central banks grapple with inflation risks.
BoE about to make a mistake and raise rates too aggressively?
Which makes the idea of tapering and rate hikes this side of the new year all the more surprising. As we have seen, the pound has been punished as a result of the Bank of England's apparent determination to raise rates at all costs. A move that is seemingly being deemed a policy mistake by the central bank that will pressure an already shaky recovery.
Or perhaps more worryingly, a sign that the worst is yet to come as the country faces up to the reality of a much greater inflation problem that threatens to weigh heavily on the economy? Either way, the currency has struggled and while it has bounced back this month, it is widely being viewed as a temporary recovery with more pain to come.
On the face of it, the labour market data from the UK today doesn't look so bad and may support the case for the central bank to tighten monetary policy. But a quick look under the hood shows the numbers are flattered by various factors. The most notable being the furlough scheme which only ended last month and with 1.3 million making use of it, that's a lot of people that may have since become either unemployed or underemployed.
While the average earnings increase of 7.2% in August also looks very healthy and a potential cause for concern, the number is far more modest when accounting for one-off factors, like a drop in the use of the furlough scheme. With those factors stripped out, the ONS believes the range is 4.1%-5.6%, which while still high is also likely to recede over time as employers face higher costs.
It may explain the additional angst on the committee, though, which will make the data between now and December interesting. Not to mention the monetary policy report in a little over three weeks when the BoE publishes its new forecasts alongside its rate decision. Either way, it will surely hold until at least December to see how the environment evolves in the interim.
Few signs of oil rally running on fumes
The rally in oil has been relentless in recent months as economies have continued to reopen, OPEC+ has resisted pressure to raise production faster and crude has been caught up in the energy price surge. The rally still has great momentum, with WTI on course for the fourth day of gains after closing above $80 for the first time since October 2014 on Monday.
While you can often see these rallies fizzle out as they become overcrowded - and most seem bullish on oil at this point - that doesn't appear to be happening yet with the momentum indicators still looking perfectly healthy. Perhaps we'll start to see that more as WTI approaches $84-85 or even $90, but for now, there are few signs of the rally running on fumes.
Of course, there are certain things that could change fundamentally to trigger a correction in prices. Additional supply from Russia, the approval of Nord Stream 2, OPEC+ increasing supply, for example. But equally, and maybe more likely, bullish fundamentals including further energy outages and colder weather could propel it even higher.
Gold range-bound but resisting higher US yields
Gold is making steady gains on Tuesday, but very much remains within its recent range, as traders still appear a little lost on what the future holds for the yellow metal. It seems gold is stuck in a state of paralysis at the moment as traders weigh up where exactly it sits in a slower growth, increasingly uncertain, tighter monetary policy environment.
For now, we could see further consolidation, with rallies facing resistance around $1,775 and sell-offs seeing support around $1,750. A significant breakout in either direction could make things a lot more interesting but in the interim, it seems we're range-bound.
The fact that gold has held up so well as US yields rise is an interesting development in the markets that may suggest gold bulls have the upper hand in the near term, but that's not what you would typically expect to see and will be an interesting one to monitor going forward.
Bitcoin eyeing new highs
Bitcoin is steady on Tuesday after making strong gains once again at the start of the week. We have seen it start to lose momentum on approach to $60,000 which is the next psychological barrier to the upside. But longer-term, there appears to be plenty of support behind the bitcoin rally which may point to new all-time highs in the not-too-distant future.
EUR/USD Mid-Day Outlook
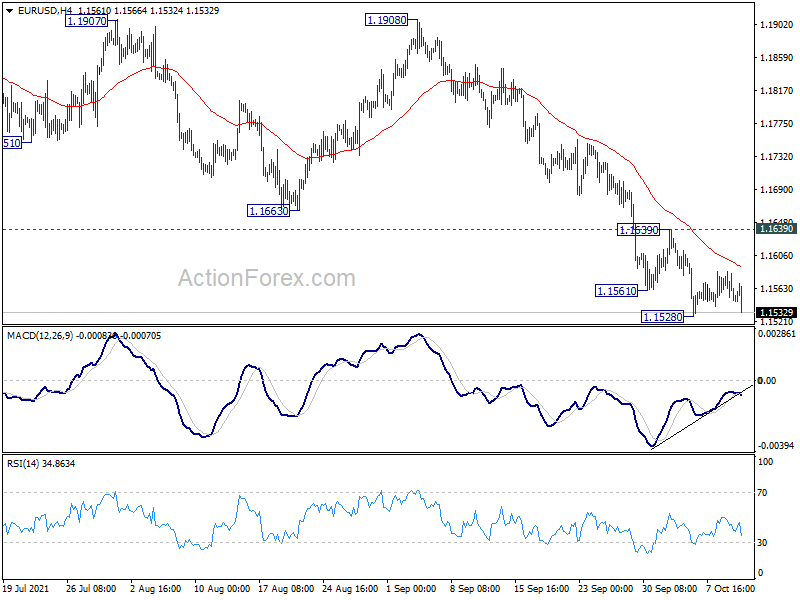
Daily Pivots: (S1) 1.1540; (P) 1.1564; (R1) 1.1578; More...
Intraday bias in EUR/USD stays neutral first, and outlook is unchanged. Further fall is still in favor as long as 1.1639 minor resistance holds. Break of 1.1528 will resume larger decline towards 1.1289 medium term fibonacci level. On the upside, break of 1.1639 resistance, however, will indicate short term bottoming. intraday bias will be turned back to the upside for stronger rebound.
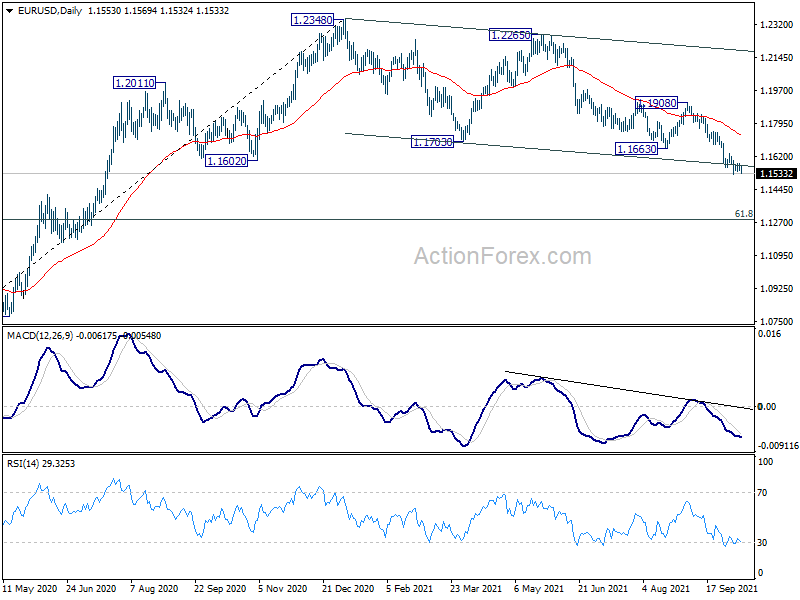
In the bigger picture, sustained break of 1.1602 will argue that rise from 1.0635 (2020 low) has completed at 1.2348. Deeper fall would be seen to 61.8% retracement of 1.0635 to 1.2348 at 1.1289. Note also that rejection by 55 week EMA (1.1830) also carries medium term bearish implication. Firm break of 1.1289 will pave the way to retest 1.0635 low. On the upside, though, break of 1.1908 resistance will revive medium term bullishness and turn focus back to 1.2348 high.
GBP/USD Mid-Day Outlook
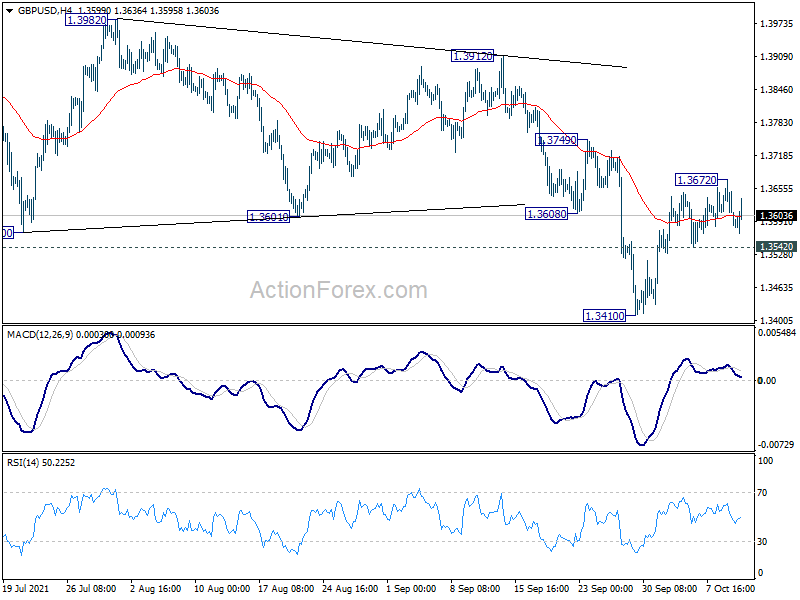
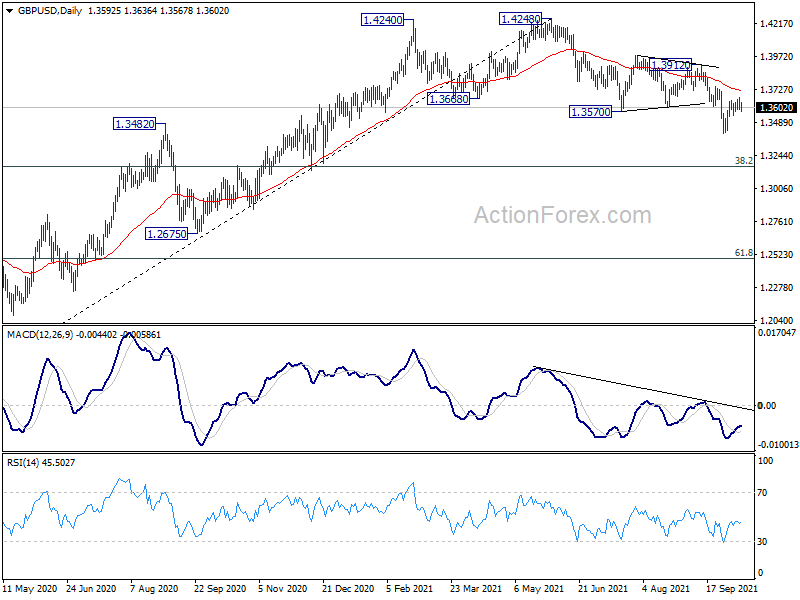
Daily Pivots: (S1) 1.3562; (P) 1.3618; (R1) 1.3651; More...
Intraday bias in GBP/USD stays neutral at this point. On the downside, break of 1.3542 minor support will suggest that rebound from 1.3410 has completed, and fall from 1.4248 is ready to resume. Intraday bias will be turned back to the downside for 1.3410 and below. On the upside, though, above 1.3672 will resume the rebound to 55 day EMA (now at 1.3717) first.
In the bigger picture, fall from 1.4248 is at least a correction to the up trend from 1.1409 (2020 low). Such correction could extend to 38.2% retracement of 1.1409 to 1.4248 at 1.3164 before completion. However, considering the rejection by 1.4376 key resistance (2018 high), sustained trading below 1.3164 will argue that it's indeed a bearish trend reversal and would target 61.8% retracement at 1.2493. Nevertheless, break of 1.3912 resistance will revive medium term bullishness and target 1.4248/4376 resistance zone again.
USD/CHF Mid-Day Outlook
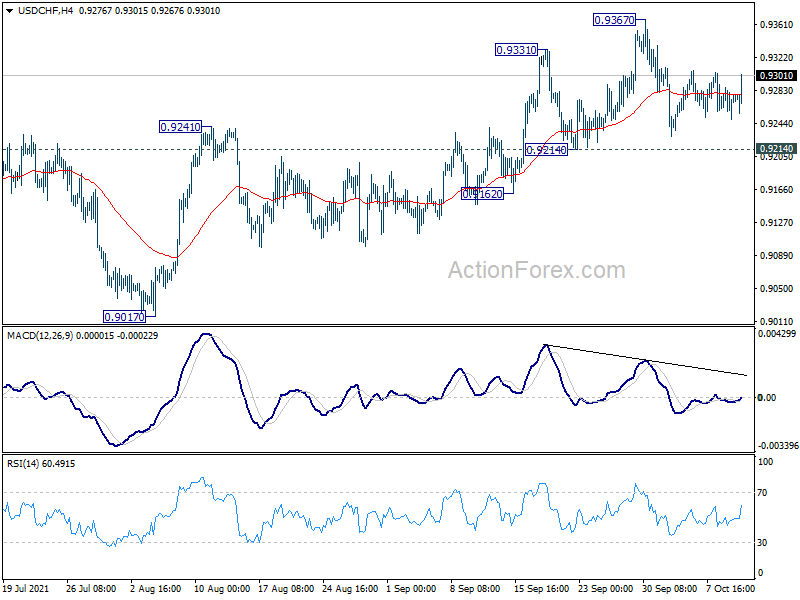
Daily Pivots: (S1) 0.9255; (P) 0.9272; (R1) 0.9293; More....
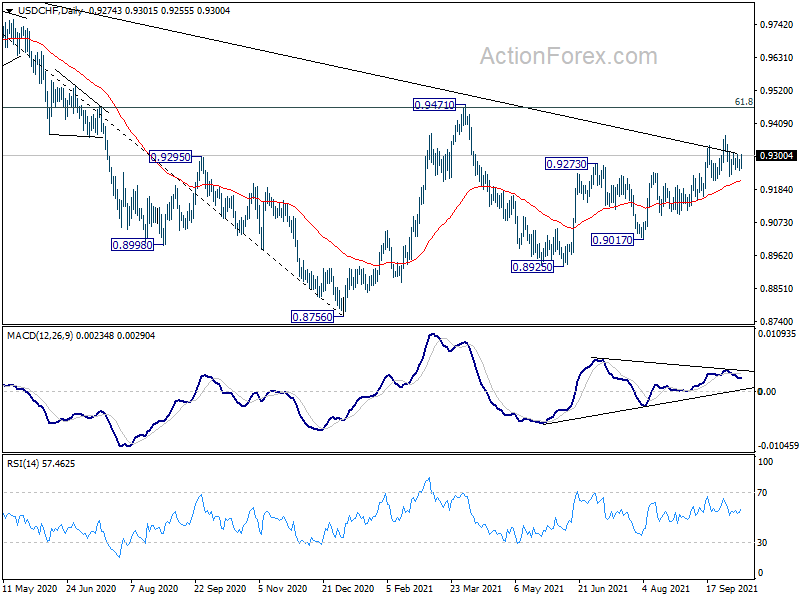
USD/CHF is still bounded in consolidation from 0.9367 and intraday bias remains neutral. On the upside, break of 0.9367 will resume the rise from 0.8925 to 0.9471 key resistance next. On the downside, however, break of 0.9214 will turn bias back to the downside for 0.9017 support again.
In the bigger picture, the strong rally above 55 week EMA (now at 0.9188) now tilts favor to the case of bullish trend reversal. That is, decline from 1.3042 (2016 high) is probably completed at 0.8756 already. Sustained break of 0.9471 resistance should confirm this case and pave the way to retest 1.0342 ahead. However, rejection by 0.9471 will mix up the outlook again and retain some medium term bearishness.
USD/JPY Mid-Day Outlook
Daily Pivots: (S1) 112.52; (P) 112.96; (R1) 113.78; More...
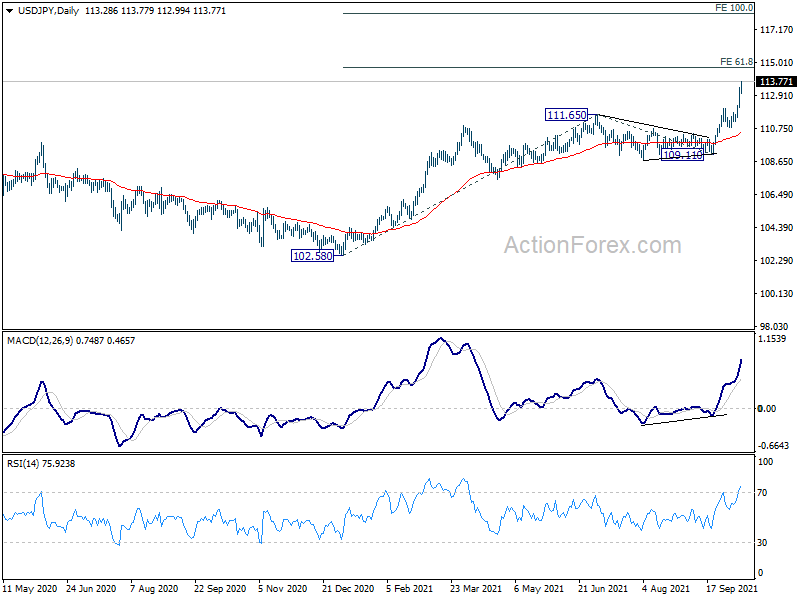
USD/JPY's rally continues today and reaches as high as 113.77 so far today. Intraday bias remains on the upside. Up trend from 102.58 is in progress and should target 61.8% projection of 102.58 to 111.65 from 109.11 at 114.71. Firm break there will target 100% projection at 118.18 next. On the downside, below 112.99 minor support will turn intraday bias neutral and bring consolidation first. But retreat should be contained by 112.07 resistance turned support to bring rise resumption.
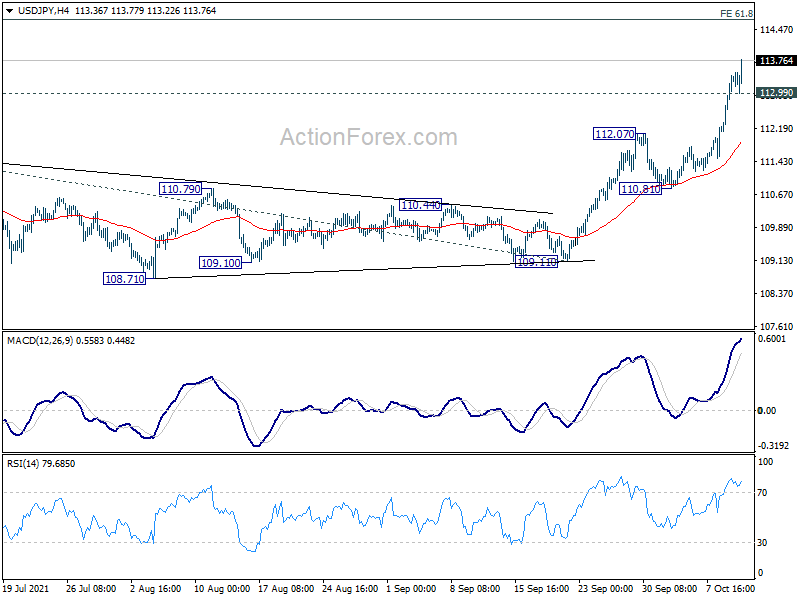
In the bigger picture, corrective decline from 118.65 (2016 high) should have completed at 101.18 already. Rise from the 102.58 is seen as the third leg of the up trend from 101.18. Next target is 114.54 resistance and then 118.65 high. This will now be the preferred case as long as 108.71 support hold, even in case of pull back.
Euro Softens on Weak Economic Sentiment, Yen Selloff Remains the Main Theme
There is basically no change in the Yen selloff theme in the markets. But buying focus has shifted to commodity currencies, as led by Aussie and Kiwi, as well as Sterling. Euro is turning a touch weaker after poor German sentiment data, while the Pound is supported by job data. Dollar is sluggish as traders await the next moves in US yields and stocks.
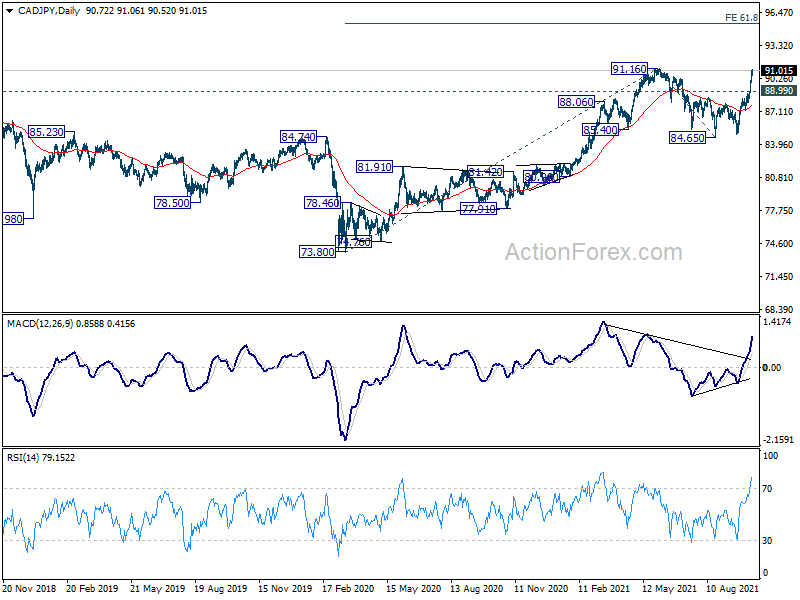
Technically, CAD/JPY is set to take on 91.16 high as rally accelerates. Firm break there will resume larger up trend from 73.80 to 61.8% projection of 73.80 to 91.16 from 84.65 at 95.37. Such development could be a prelude to corresponding breakout in other commodity Yen crosses, like 85.78 high in AUD/JPY and 80.17 high in NZD/JPY.
In Europe, at the time of writing, FTSE is down -0.48%. DAX is down -0.38%. CAC is down -0.58%. Germany 10-year yield is up 0.0016 at -0.117. Earlier in Asia, Nikkei dropped -0.94%. Hong Kong HSI dropped -1.43%. China Shanghai SSE rose 0.25%. Singapore Strait Times dropped -0.05%. Japan 10-year JGB yield dropped -0.0012 to 0.096.
Germany ZEW dropped to 22.3 in Oct, outlook dimmed noticeably
Germany ZEW Economic Sentiment dropped from 26.5 to 22.3 in October, below expectation of 20.4. That's the fifth decline in a row. Germany Current Situation Index tumbled sharply from 1.9 to 21.6, well below expectation of 29.5, and the first decline since February.
Eurozone ZEW Economic Sentiment dropped from 31.3 to 21.0, below expectation of 26.5. Eurozone Current Situation dropped -6.6 pts to 15.9. Eurozone inflation expectations indicator dropped -3.0 pts to 17.1. But 49.1% of experts still expect inflation to rise further in the next six months.
ZEW President Professor Achim Wambach said: "The economic outlook for the German economy has dimmed noticeably. The further decline of the ZEW Indicator of Economic Sentiment is mainly due to the persisting supply bottlenecks for raw materials and intermediate products. The financial market experts expect profits to go down, especially in export-oriented sectors such as vehicle manufacturing and chemicals/pharmaceuticals."
UK employment back to pre-pandemic level in Sep
UK number of payroll employees rose 207k to record 29.2m in September, returning to pre-coronavirus pandemic level in February 2020. For the three months to August, unemployment rate dropped to 4.5% in August, down from 4.6%, matched expectations. Employment rate rose 0.5% on the quarter to 75.3%. Average earnings including bonus rose 7.2% 3moy. Average earnings excluding bonus rose 6.0% 3moy.
Japan wholesale prices rose 6.3% yoy in Sep, highest in 13 years
Japan corporate goods price index, a PPI equivalent, rose 6.3% yoy in September, above expectation of 5.9% yoy. That's also the highest level in 13 years. Yen based wholesale import prices rose a record 31.3% yoy. Petroleum and coal costs rose 32.4% yoy. Wood products spiked 48.3% yoy.
Some analysts noted that the surge in wholesale prices would be absorbed mainly by businesses, with little impact on consumers. But according to a BoJ survey published on Monday, 68.2% of Japanese households are expecting prices to rise a year from now, up from 66.8% three months ago. Median projection of inflation a year from now rose to 3.0%, up from June's 2.0%.
Australia NAB business confidence jumped to 13, but condition tumbled to 5
Australia NAB Business Confidence jumped sharply from -6 to 13 in September. Strong improvement was seen in New South Wales (up 52 pts to 27) and Victoria (up 16 pts to 5). Business Conditions, however, dropped from 14 to 5. Trading condition dropped from 20 to 10. Profitability condition dropped from 15 to 2. Employment confidence dropped from 9 to 1.
NAB said, "Interpreting this month's results really depends if you are an optimist or a pessimist. Businesses are really looking forward to reopening, and confidence increased markedly on the back of NSW and Victoria's reopening roadmaps. The rise in confidence suggests they see the roadmaps that have been announced as sufficient to allow activity to really rebound in the coming months."
"Still, confidence is more about hope for the future than what is happening in the present. On that front, conditions really deteriorated which shows that lockdowns are taking a toll, despite the resilience the economy has shown through this period."
EUR/AUD Mid-Day Outlook
Daily Pivots: (S1) 1.5663; (P) 1.5761; (R1) 1.5823; More...
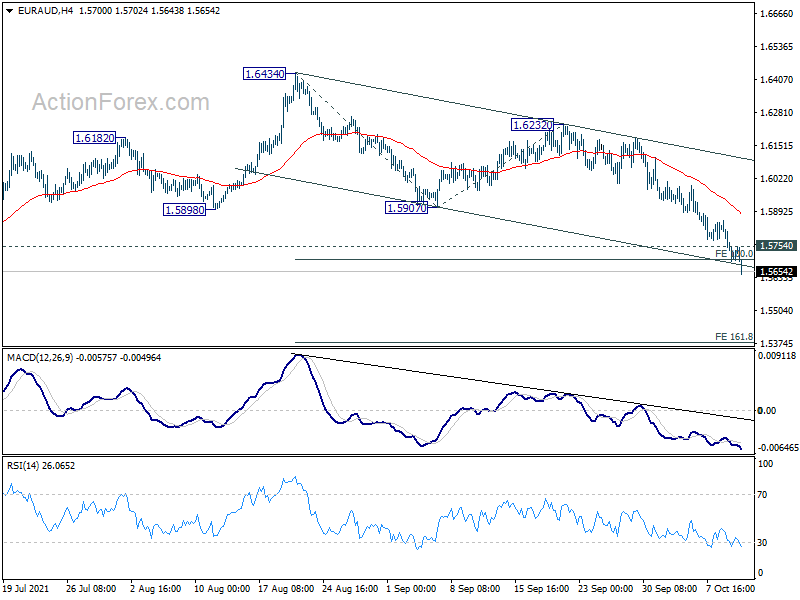
EUR/AUD's decline continues today and hit as low as 1.5643 so far. The break of 100% projection of 1.6434 to 1.5907 from 1.6232 at 1.5705 and near term falling channel support indicates downside acceleration. Intraday bias stays on the downside for 161.8% projection at 1.5379 next. On the upside, above 1.5754 minor resistance will turn intraday bias neutral and bring consolidations. But recovery should be limited below 1.5907 support turned resistance to bring another decline.
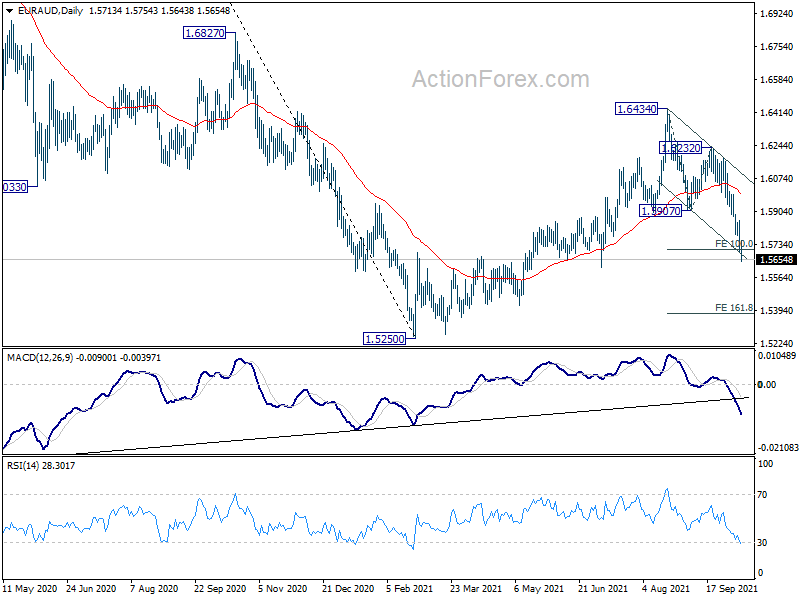
In the bigger picture, rise from 1.5250 medium term bottom is seen as a correction to the down trend from 1.9799 (2020 high) only. With 38.2% retracement of 1.9799 to 1.5250 at 1.6988 intact, such down trend is expected to resume at a later stage. Firm break of 1.5250 will target 61.8% retracement of 1.1602 (2012 low) to 1.9799 at 1.4733. In any case, sustained break of 1.6988 fibonacci level is needed to indicate long term reversal.
Economic Indicators Update
| GMT | Ccy | Events | Actual | Forecast | Previous | Revised |
|---|---|---|---|---|---|---|
| 23:01 | GBP | BRC Like-For-Like Retail Sales Y/Y Sep | -0.60% | 1.50% | ||
| 23:50 | JPY | Bank Lending Y/Y Sep | 0.60% | 0.80% | 0.60% | |
| 23:50 | JPY | PPI Y/Y Sep | 6.30% | 5.90% | 5.50% | 5.80% |
| 0:30 | AUD | NAB Business Confidence Sep | 13 | -5 | -6 | |
| 0:30 | AUD | NAB Business Conditions Sep | 5 | 14 | ||
| 6:00 | GBP | Claimant Count Change Sep | -51.1K | -58.6K | ||
| 6:00 | GBP | ILO Unemployment Rate (3M) Aug | 4.50% | 4.50% | 4.60% | |
| 6:00 | GBP | Average Earnings Including Bonus 3M/Y Aug | 7.20% | 8.40% | 8.30% | |
| 9:00 | EUR | Germany ZEW Economic Sentiment Oct | 22.3 | 20.4 | 26.5 | |
| 9:00 | EUR | Germany ZEW Current Situation Oct | 21.6 | 29.5 | 31.9 | |
| 9:00 | EUR | Eurozone ZEW Economic Sentiment Oct | 21 | 26.5 | 31.1 | |
| 10:00 | USD | NFIB Business Optimism Index Sep | 99.1 | 99.7 | 100.1 |
EUR/AUD Mid-Day Outlook
Daily Pivots: (S1) 1.5663; (P) 1.5761; (R1) 1.5823; More...
EUR/AUD's decline continues today and hit as low as 1.5643 so far. The break of 100% projection of 1.6434 to 1.5907 from 1.6232 at 1.5705 and near term falling channel support indicates downside acceleration. Intraday bias stays on the downside for 161.8% projection at 1.5379 next. On the upside, above 1.5754 minor resistance will turn intraday bias neutral and bring consolidations. But recovery should be limited below 1.5907 support turned resistance to bring another decline.
In the bigger picture, rise from 1.5250 medium term bottom is seen as a correction to the down trend from 1.9799 (2020 high) only. With 38.2% retracement of 1.9799 to 1.5250 at 1.6988 intact, such down trend is expected to resume at a later stage. Firm break of 1.5250 will target 61.8% retracement of 1.1602 (2012 low) to 1.9799 at 1.4733. In any case, sustained break of 1.6988 fibonacci level is needed to indicate long term reversal.
OPEC+ Under-produced Despite Energy Crisis
OPEC+ produced less than promised despite global energy shortage. The alliance comprised of 10 OPEC members, 9 non-OPEC producers and 3 OPEC members exempted from quotas produced a total of 40.73M bpd in September, compared with 40.26M bpd a month ago. Output from OPEC-10 and non-OPEC aggregated to 36.57M bpd, missing the quota of 36.74M bpd. The compliance level reached 111.5% during the month. A reading above 100% signals underproduction.
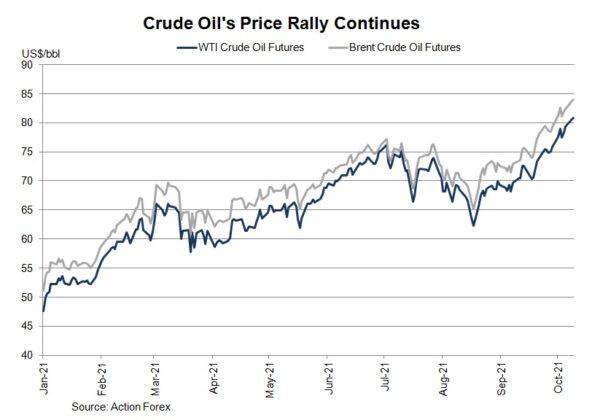
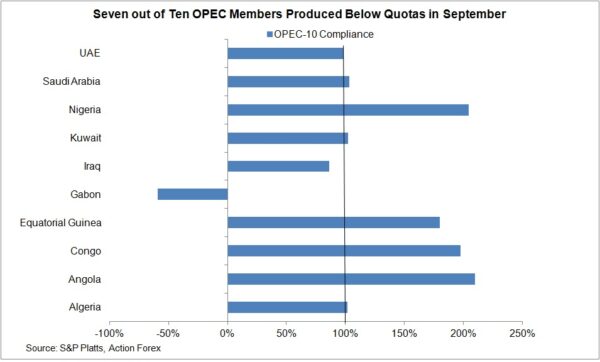
After refusing to accelerate output to alleviate the energy crisis last week, the OPEC cartel and some non-OPEC producers reportedly produced less than their assigned quota in September. According to S&P Platts’ estimates, the 10 OPEC members bound by quotas produced a total of 23.13M bpd in September, up +0.32M bpd from August. Yet, it was short of the aggregate quota of 23.29M bpd. Saudi Arabia, the largest producers in the cartel, pumped 9.66M bpd, up slightly from 9.57M bpd in August. Countries that produced less than quotas include Angola, Congo, Equatorial Guinea and Nigeria. Iran, Libya and Venezuela, the 3 OPEC members exempted from output limit, collectively pumped 4.16M bpd to the market, largely unchanged from August.
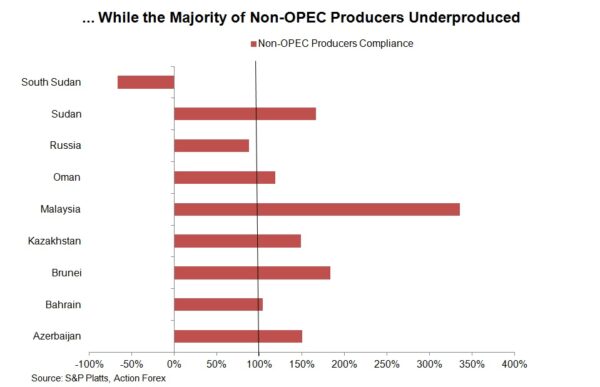
Concerning non-OPEC producers in the alliance, Russia raised output by +0.09M bpd to 9.86M bpd in September, compared with the quota of 9.6M bpd. Yet, this group collectively pumped 13.44M bpd, below the quota of 13.45M bpd.
Earlier this month, the OPEC+ decided to maintain an approach to gradually unwind the output reduced amidst the pandemic. It decided to raise an aggregate production by +0.4M bpd every month although energy prices have skyrocketed. With demand prone to accelerate as the heating season approaches, persistent supply shortage should continue to support the elevated energy prices.
GBP/USD Technical Bearish Trend Continuation
GBP/USD is in downtrend.
- The pattern is a bearish continuation sign.
- Q L3 should be the target.
- Bearish Zig-zag.
D1 chart GBP/USD
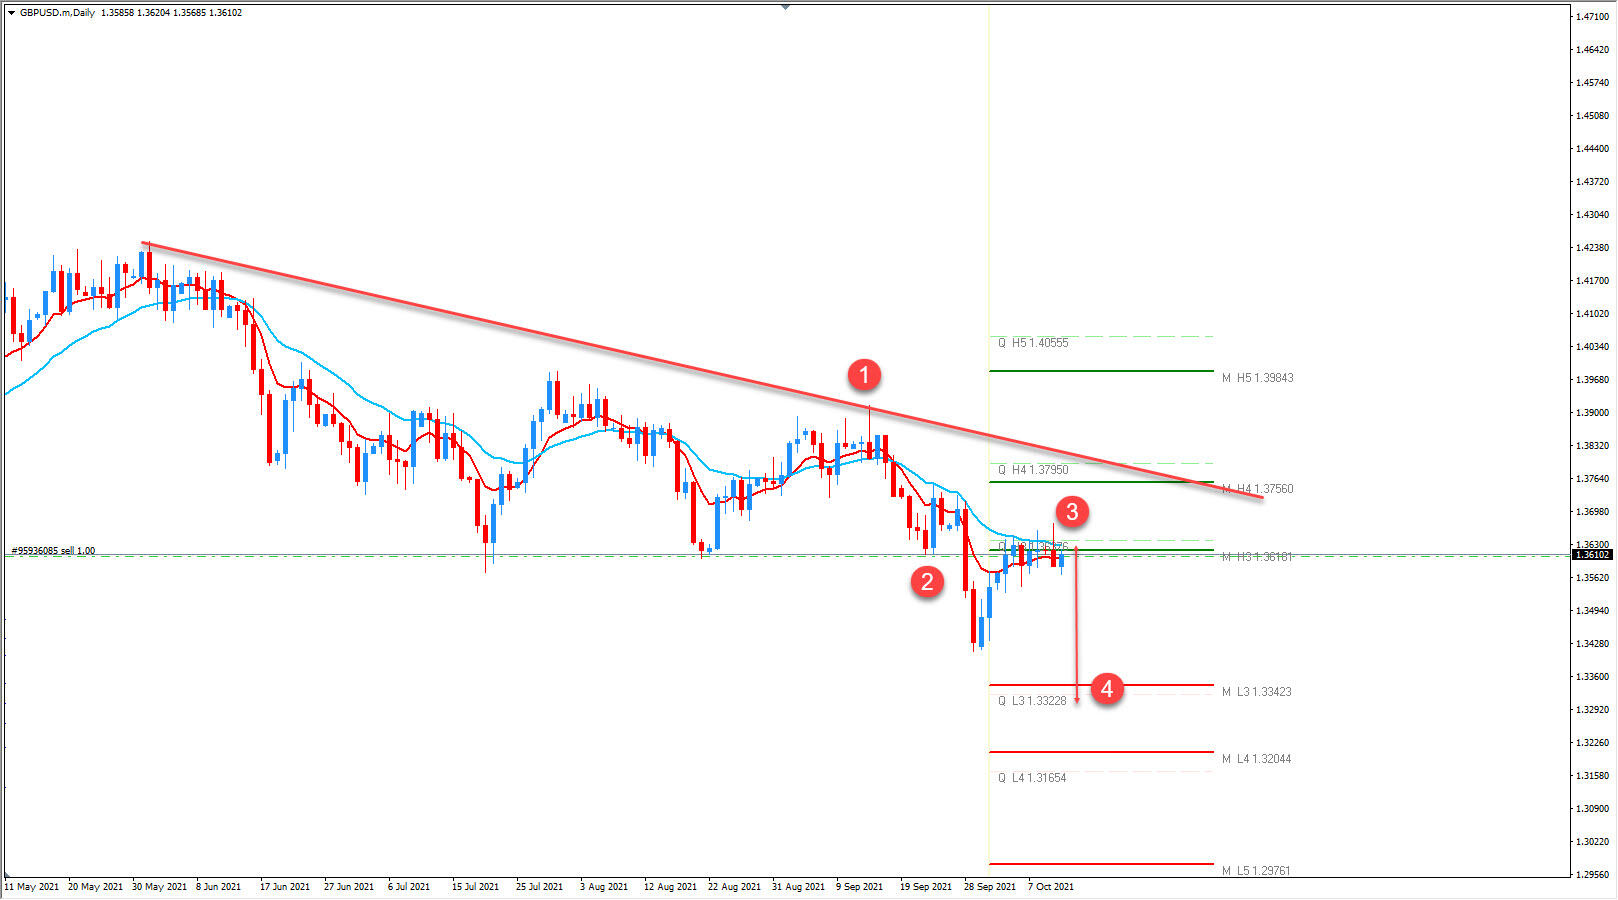
1. Descending Trendline.
2. Bearish Order block.
3. Pinbar Bearish.
4. Q L3 and M L3 Pivot targets.
The price is currently bearish and supported around 1,3600. We can see lots of selling pressure from the M H3 resistance. Candlesticks are bearish and imply a possible breakout and continuation move down. The trend line acts as a resistance and it's keeping bulls from advancing. If the break of the trendline happens the market will go higher. The move higher would disrupt the overall scenario of bearish GBP/USD. We should see a move down towards 1.3550 followed by 1.3500. The final target is 1.3340 but only as a part of a stronger swing and move down.