Sample Category Title
GBPUSD Stays On The Sidelines As Negative Risks Still Linger
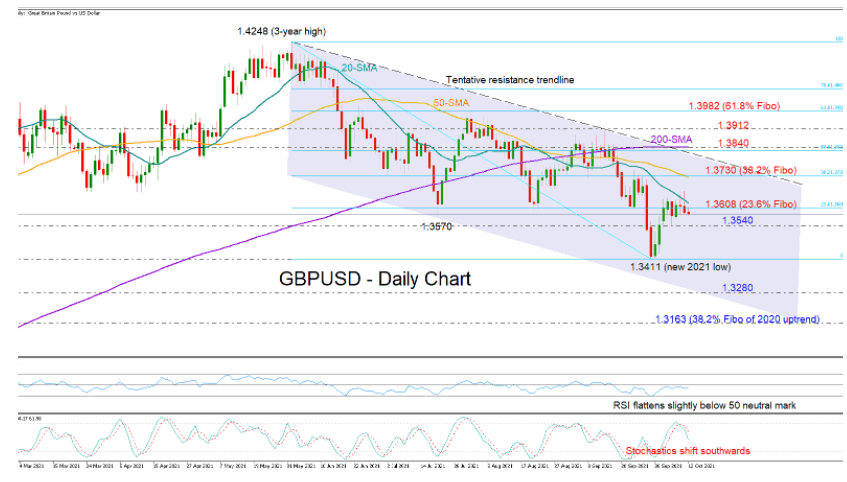
GBPUSD continued its short consolidation phase marginally below the 20-day simple moving average (SMA), as it was unable to close decisively above the 1.3600 level over the past week.
The 23.6% Fibonacci retracement of the 1.4248 – 1.3411 downtrend is currently keeping the bulls under control around 1.3608 as the technical picture is providing little hope for a change in the downbeat market sentiment. Despite the quick rebound off the 30 oversold level, the RSI remains stuck below its 50 neutral mark, while the Stochastics have clearly shifted southwards. Likewise, the negative intersections between the shorter- and longer-term SMAs keep promoting the bearish trend from the top of 1.4248.
Traders may remain on the sidelines unless the price motivates fresh selling below 1.3540, shifting all the attention towards the new 2020 low of 1.3411. Moving lower, the decline could next take a breather around the 1.3280 barrier, which has been acting both as support and resistance at the end of 2020. If this fails to hold too, it would be interesting to see if the 1.3163 area, which encapsulates the 38.2% Fibonacci of the 2020-2021 upleg can come to the rescue.
Otherwise, a sustainable move above the 20-day SMA at 1.3626 may see a test near the 50-day SMA and the 38.2% Fibonacci of 1.3730. However, a more challenging obstacle is placed between the tentative descending trendline and the 200-day SMA at 1.3840. Note that the 50% Fibonacci is also located within these boundaries. Hence, any step higher from here may switch the focus towards the 61.8% Fibonacci of 1.3982, unless the 1.3912 bar stands tall once again.
Summarizing, the short-term risk is still tilted to the downside for GBPUSD, but traders may wait for a close below 1.3540 before they engage in more selling.
EURJPY Posts 3-Month High, Recording Double Bottom Pattern
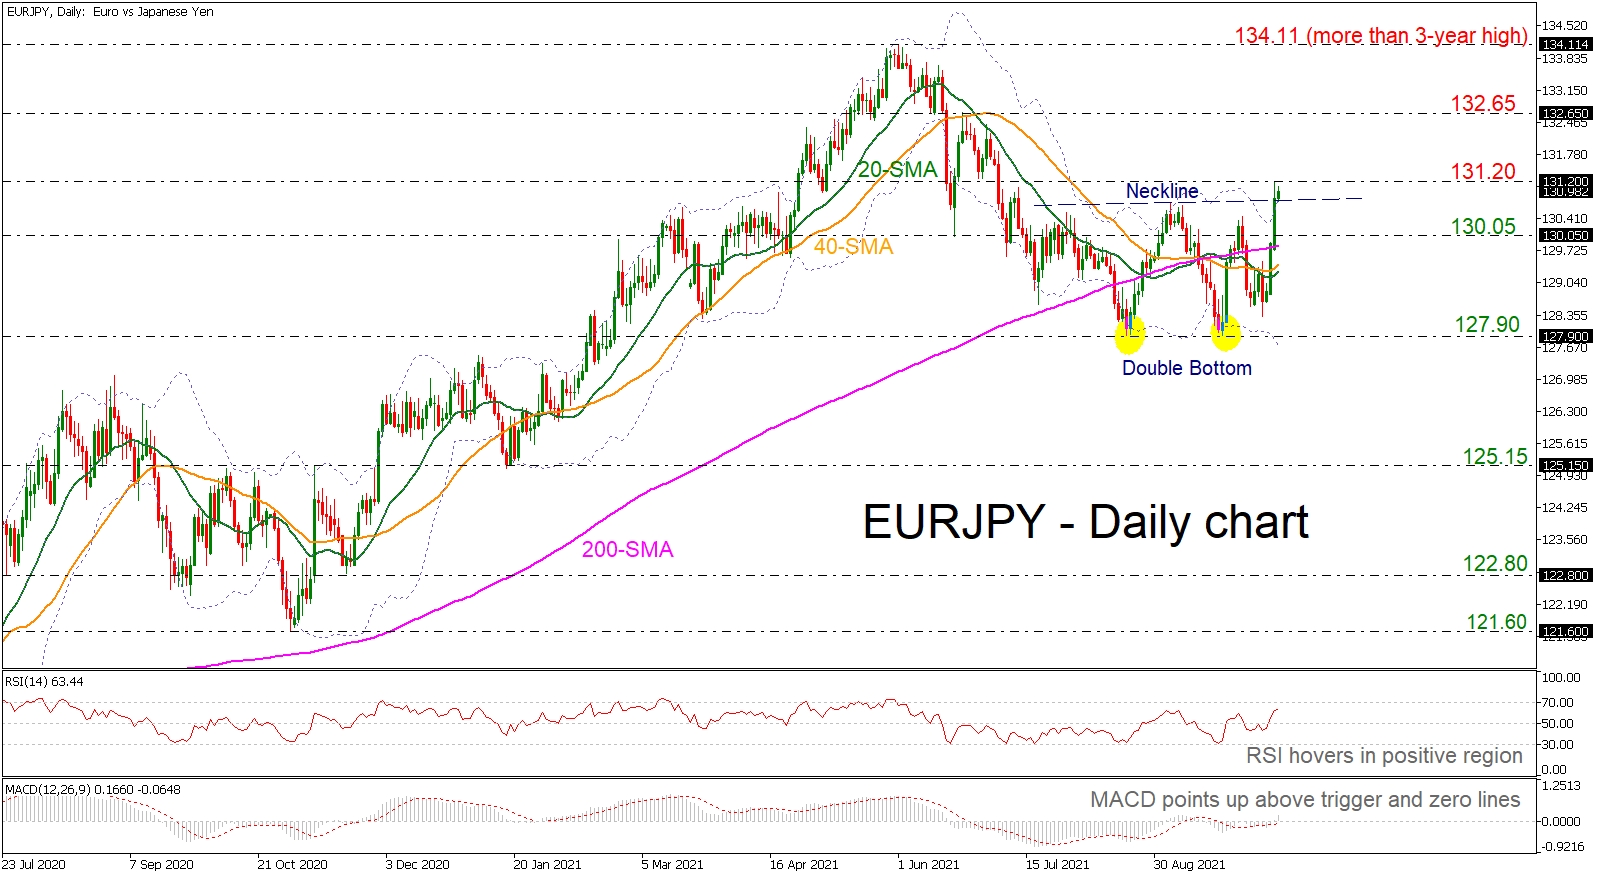
EURJPY has been posting an aggressive bullish rally over the past couple of days, reaching a fresh three-month high around the 131.20 resistance level and is in the process of completing a double bottom formation.
Technically, the RSI indicator is moving hovering in the positive region, while the MACD oscillator is ticking higher, surpassing its trigger and zero lines. Moreover, the 20- and 40-day simple moving averages (SMAs) are ready for a bullish crossover in the short-term, while the price has overcome the upper Bollinger band.
Should the pair strengthen its positive momentum and create a higher high than Monday’s session, the next resistance could come around 132.65. A break above this level would take the market until the more-than-three-year-high of 134.11, while even higher the market would shift the bias to a more bullish one.
However, if prices are unable to break 131.20, the risk would shift back to the downside, with the 130.05 support coming into focus as well as the 200-day SMA at 129.20. A drop lower would drive the pair until the 20- and 40-day SMAs around 129.40. The next key support to watch lower down is 127.90, which overlaps with the lower Bollinger band and is acting a significant support level, creating a double bottom pattern.
Briefly, in case EURJPY surpasses the 131.20 barrier, this would shift the three-month neutral bias to bullish and confirm the reversal double bottom pattern.
US 30 Hits Resistance
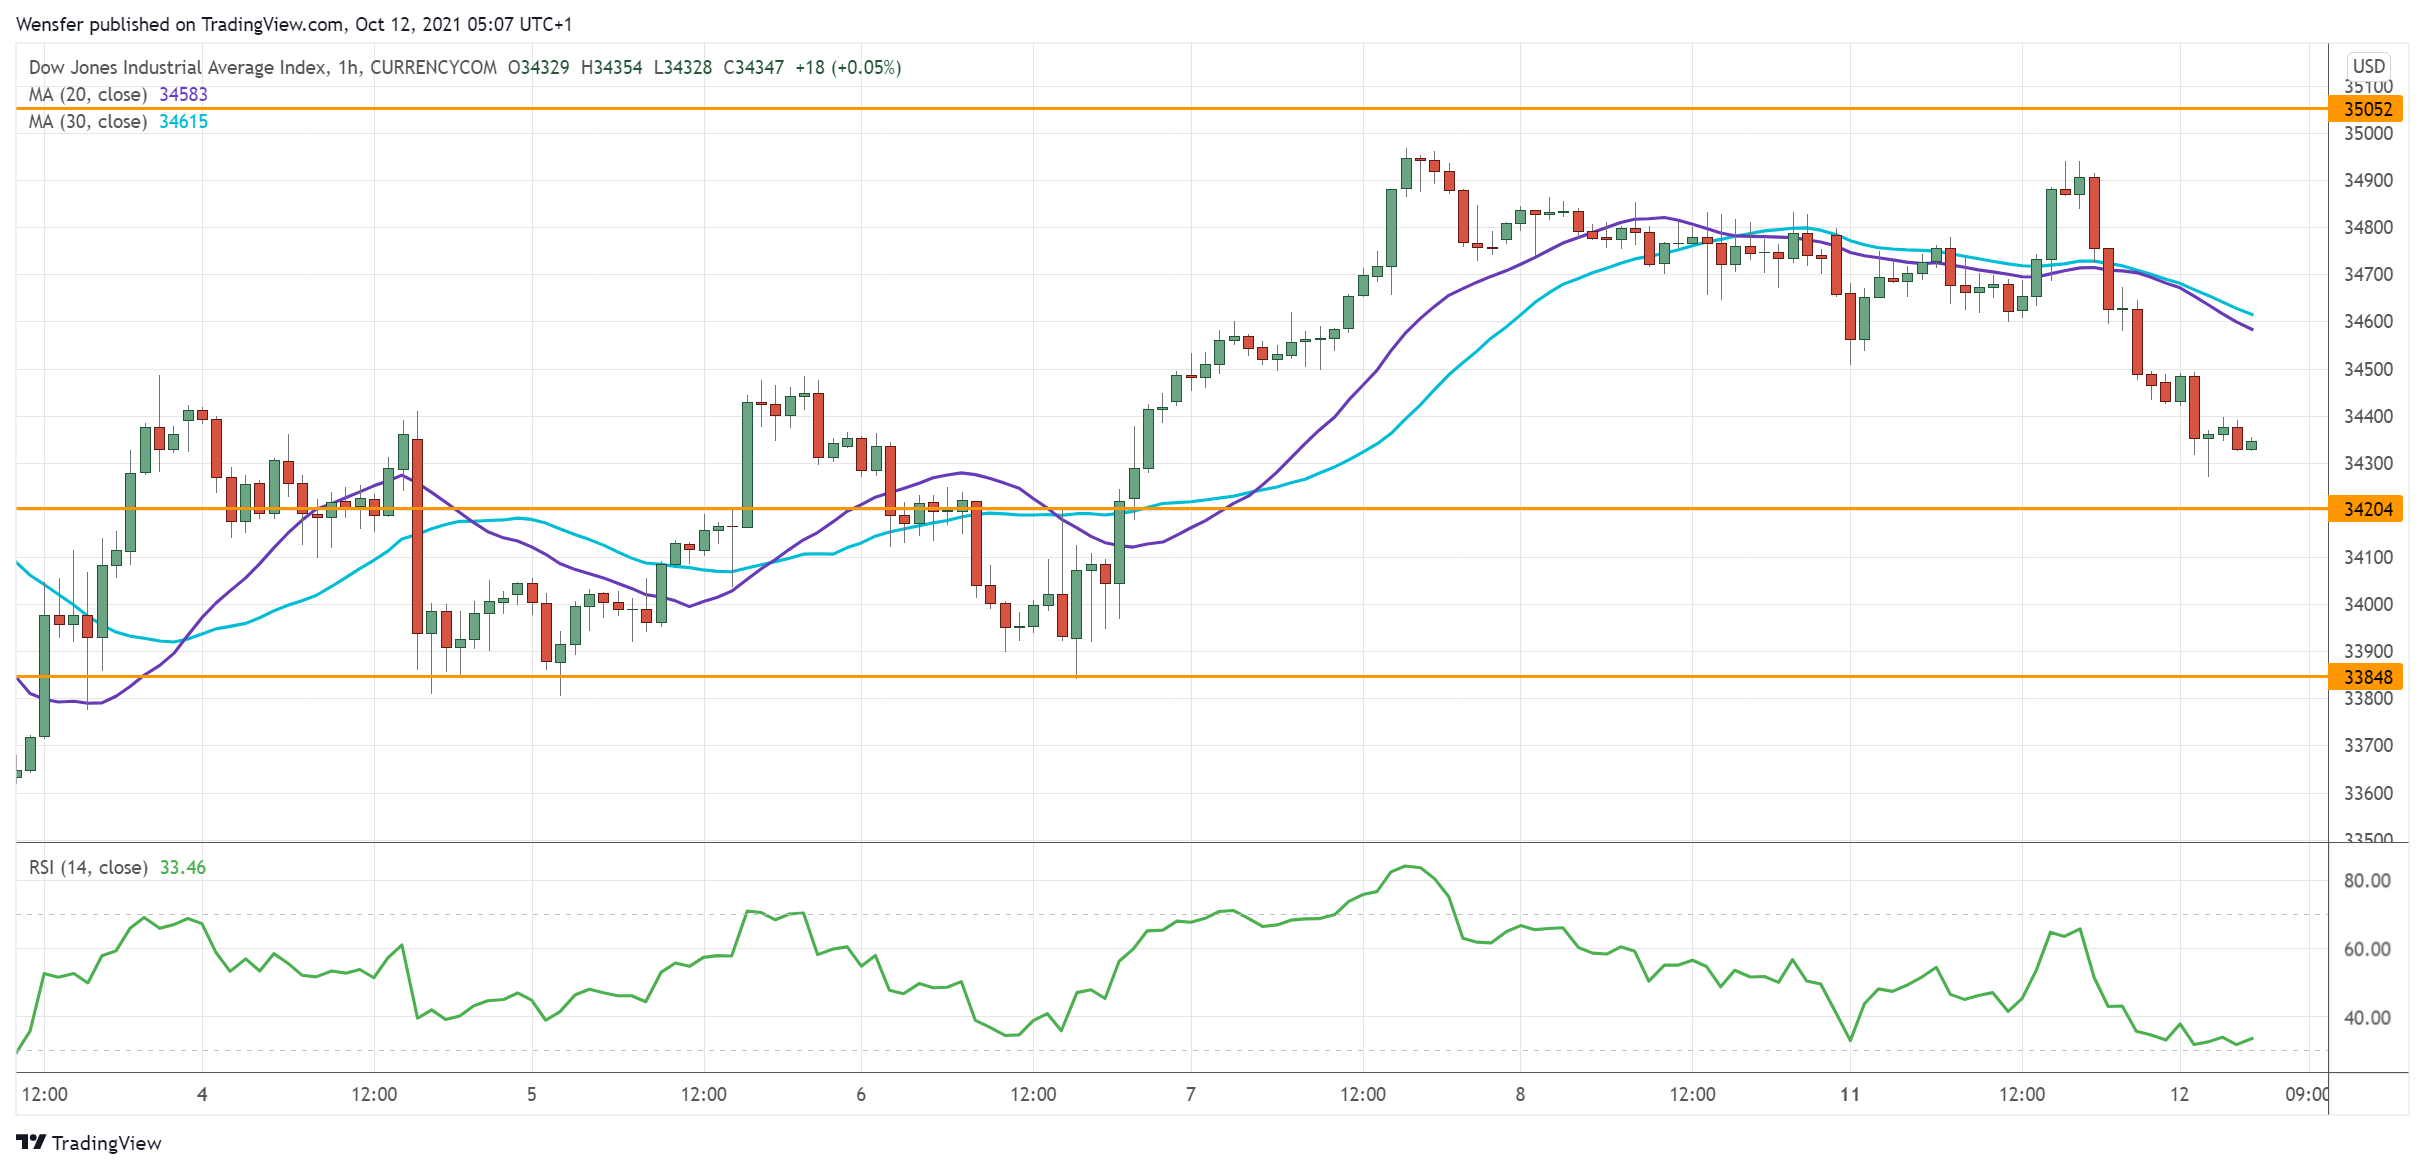
The Dow Jones climbs back as investors rotate into blue-chip values amid economic recovery.
Multiple tests of the demand zone around 33500 reveal the bulls’ commitment to keeping the index afloat. A close above 34660, the last leg of the previous sell-off, is an encouraging sign.
A push above 35050 would open the door to 35000 near the all-time high. An overbought RSI has temporarily held the bullish fever back.
34200 is the immediate support for buyers to build momentum. Further down, 33850 is their second line of defense.
NZD/USD Struggles To Rise
The New Zealand dollar bounces back as risk appetite makes a timid return after a mixed NFP.
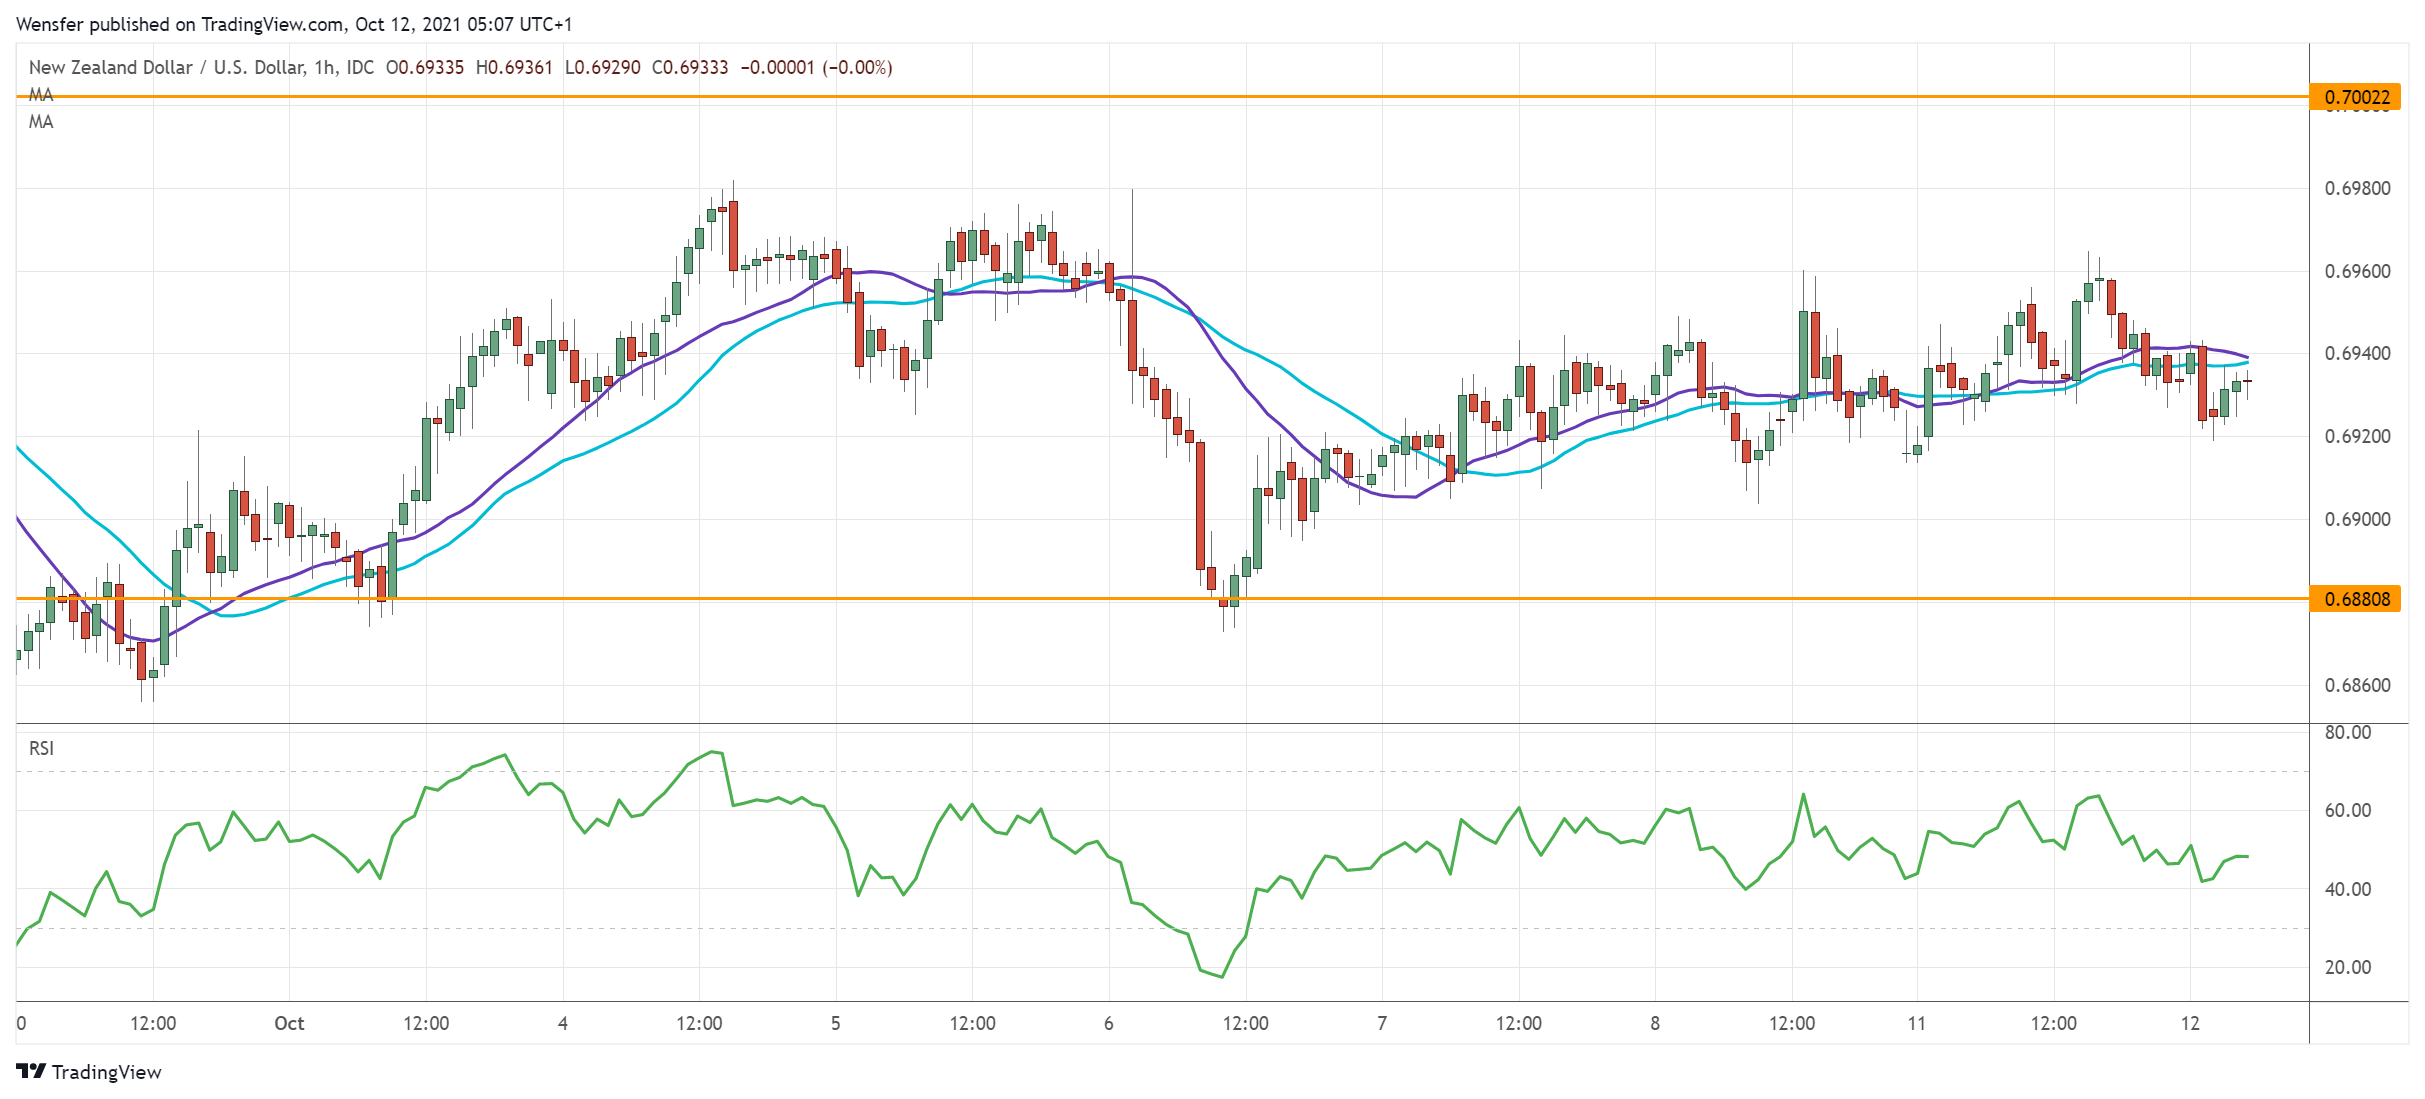
The pair is in a narrow consolidation range between 0.6880 and the psychological level of 0.7000. However, the short-term mood remains downbeat after the kiwi almost gave up all its gains from late August.
The RSI’s double-dip in the oversold area has attracted some buying interest. But the bulls will need to lift the major resistance before they could jump-start a reversal. Failing that, the kiwi would be testing the daily support at 0.6810.
USD/JPY Climbs To 3-Year Highs
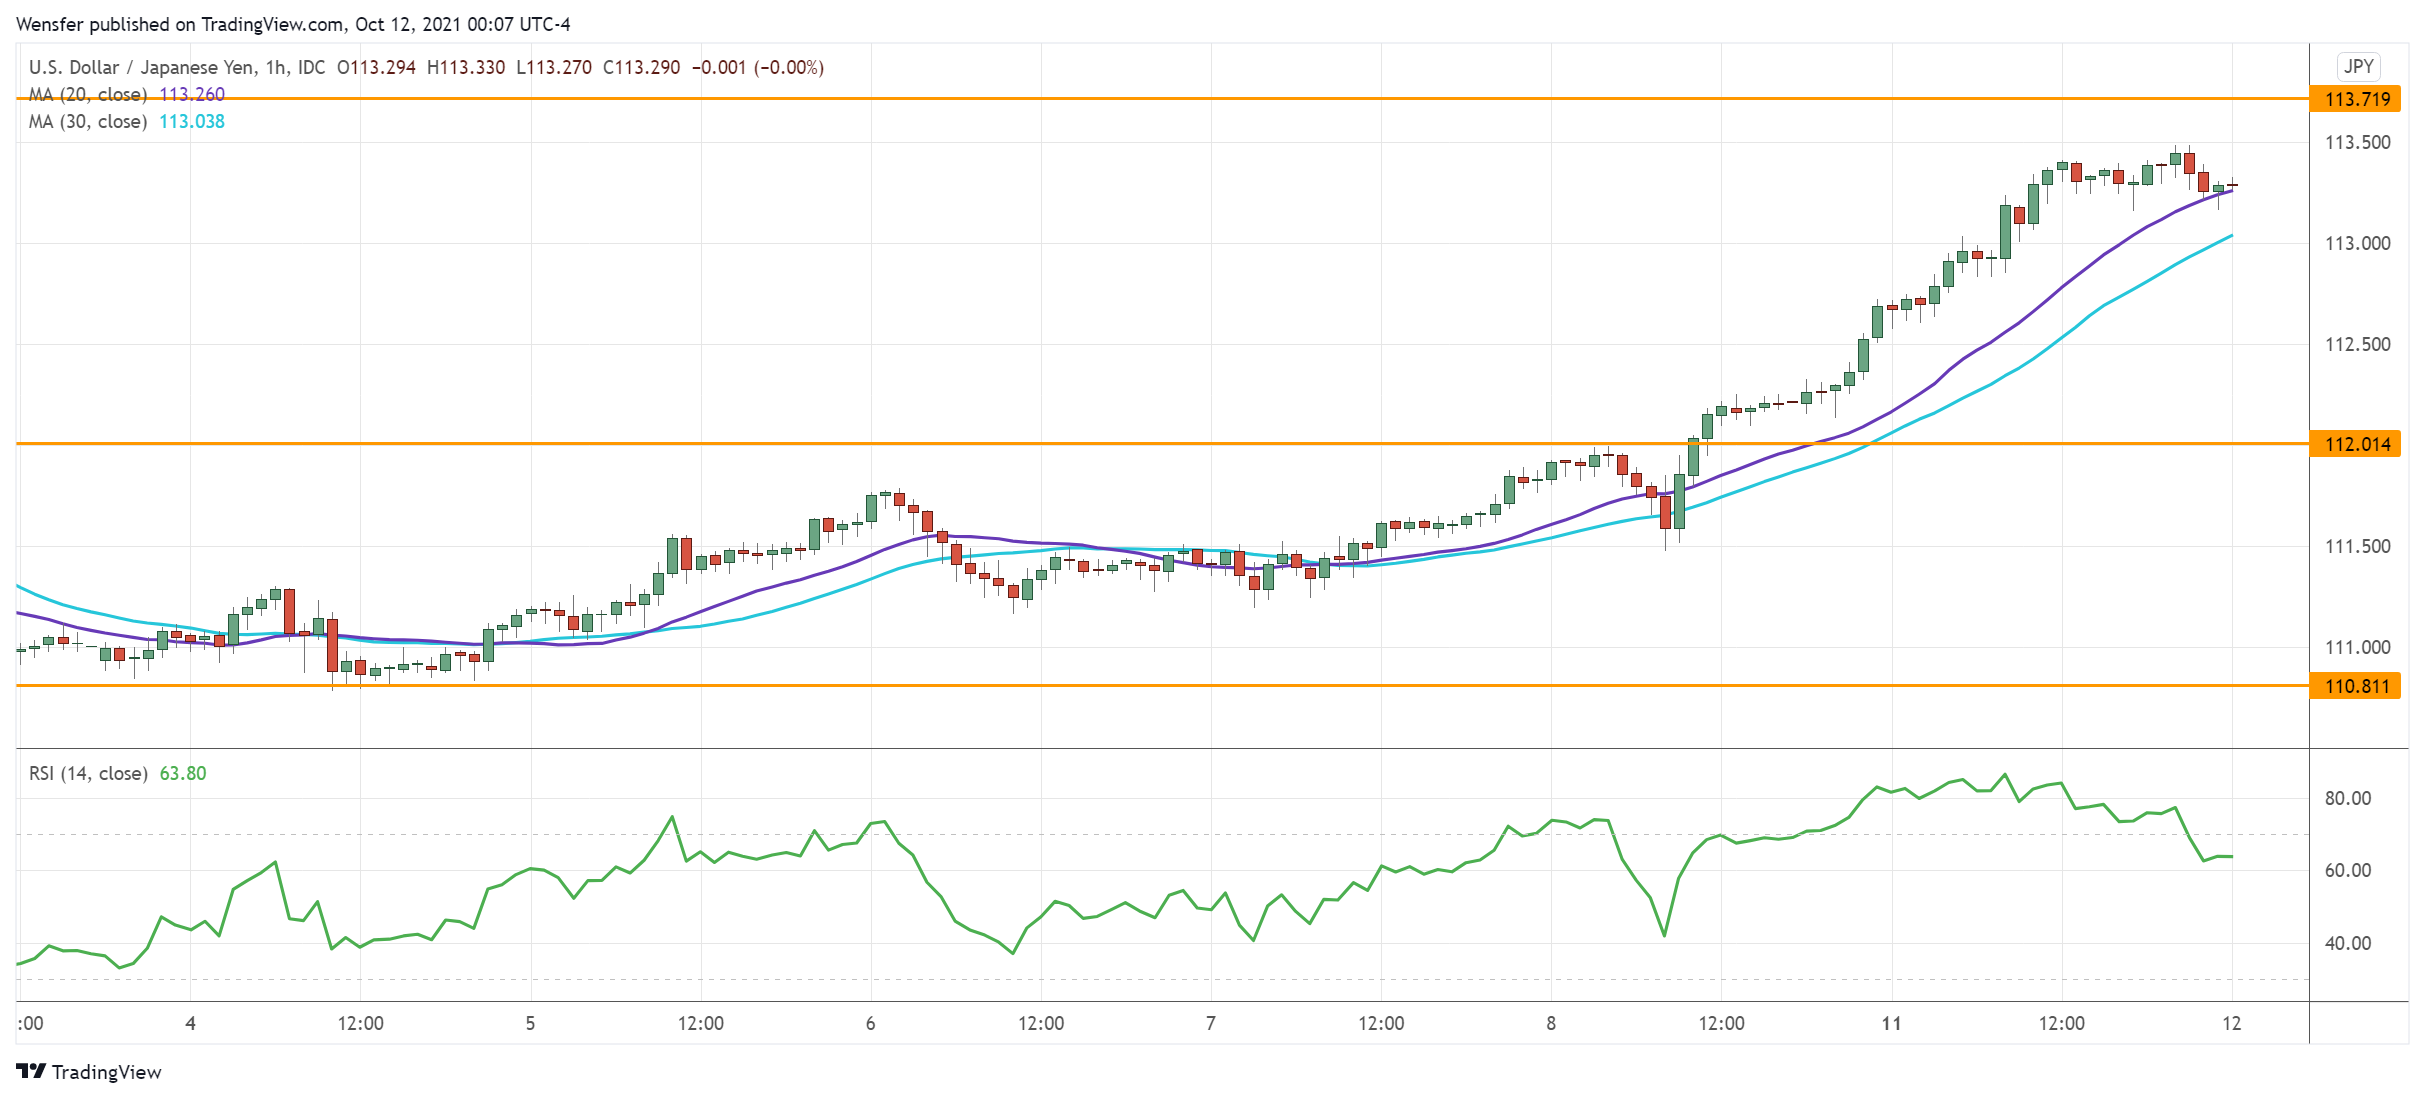
The yen plunges as low Japanese bond rates reflect the divergence in monetary policies. A close above the pre-pandemic peak around 112.10 has triggered a runaway rally.
A bullish MA cross indicates an acceleration to the upside. Strong momentum and a lack of resistance are lifting the greenback towards November 2018’s high at 113.70.
The RSI’s repeated overbought situation may lead to profit-taking, causing a limited pullback. Patient buyers may be waiting to stake in near the round number of 112.00.
Yen Sell-Off: The Pressure On Markets Is Back
The Japanese Yen collapsed by more than 1% to 113.50 in the past 24 hours. It was the biggest intraday gain since November 2020 that sent the pair to its high since December 2018.
Often the pressure on the yen is a sign of a recovery in demand for risky assets, as investors shift out of the country's low-yielding bonds in the expectation of rising yields. But yesterday's case stands out of that line. The weakening of the yen came along with pressure in the US and Chinese stock markets. Moreover, Japan's Nikkei225 is losing by 0.75% today, reducing this week's gains to 0.77%.
Technically, the pressure on Nikkei225 intensified as it approached an area of the 50- and 200-day moving averages convergence near 28800, marking bearish dominance for now. From current levels at 28300, short-term traders should pay attention to limits of the recent trading range at 28800-27000. A move beyond these boundaries could be a sign of capitulation by one side, reinforcing the amplitude of a breakout.
Among fundamental drivers for the Japanese market are the policies of the new Prime Minister. For all markets in Asia and, to a large extent, Europe, energy prices are a significant factor. Although gas quotes have retreated from record levels, oil and coal prices continue their climb to multi-year highs. Prices and pace of its growth have surpassed levels typical for healthy economic growth. Now, markets are beginning to worry about the impact of expensive energy on the economy. In this environment, rising oil and gas prices are putting pressure on stock bourses in energy-importing countries. However, it is easy to find historical examples when crushing energy prices was a drag.
Practice shows that the festive mood among energy producers and exporters rarely lasts long. Very soon, the balance of power shifts in favour of consumers.
Separately, Chinese markets remain heavy, once again hit by a sell-off due to headlines that the country's government is seeking to legally restrict the expansion and profit growth of internet companies, as well as investigating links between banks and financial firms with private companies. Chinese indices have returned to last week's closing levels, and European and US index futures have lost 1.0-1.5% since the start of the week.
GBPUSD Retreats Ahead Of UK Jobs Data
Cryptocurrency prices rallied as Bitcoin crossed the important resistance at $57,000 for the first time since May this year. The rally pushed its total market capitalization to more than $1 trillion. The combined market cap of all digital currencies rallied to more than $2.3 trillion. There were several reasons why these currencies rallied. First, there are signs that the Securities and Exchange Commission (SEC) will allow Bitcoin futures to be listed. Analysts believe that this will lead to more demand for Bitcoin. Also, they cited its role as a hedge against inflation and the fact that hash rates have been on a bullish trend.
The price of crude oil rallied as the ongoing supply and demand imbalance continued. With the global economy recovering, analysts expect that demand will keep rising in the coming year. At the same time, OPEC and its allies are not boosting production as fast as they should. In a meeting last week, the cartel agreed to continue increasing supplies gradually in a bid to boost prices. The next key mover for oil prices will be the latest monthly report by OPEC. The report is expected to show that demand remains steady and is expected to keep rising.
The British pound declined slightly ahead of the latest UK employment numbers that will come out in the morning session. The numbers are expected to show that the country’s labour market remained steady in August as the reopening continued. Economists polled by Reuters expect the data to show that the economy created more than 243k jobs in the three months to August. At the same time, wages are expected to have risen to 7.0% while the number of people filing for claims declined.
GBPUSD
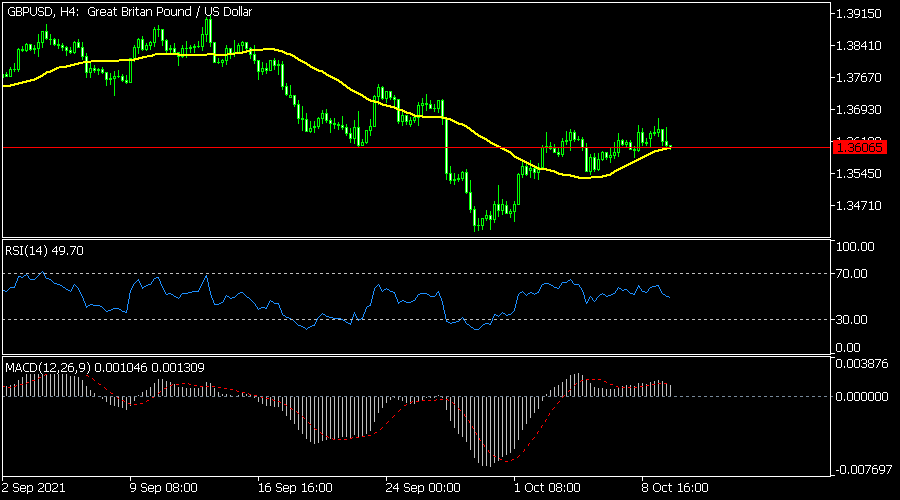
The GBPUSD retreated slightly in the overnight session. It is trading at 1.3600, which is slightly below this week’s high of 1.3670. The pair has formed a bullish flag pattern, which is a positive sign. It has also formed an inverted head and shoulders pattern. It is being supported by the 25-day moving average. Therefore, the pair will likely break out higher later today.
EURUSD
The EURUSD pair was little changed as traders wait for upcoming US inflation data. The pair is trading at 1.1557, which was slightly below this week’s high at 1.1585. On the four-hour chart, the pair has formed a bearish flag pattern and is also below the 25-day moving average. The Williams %R has also declined sharply. Therefore, the pair will likely break out lower in the next few trading sessions.

BTCUSD
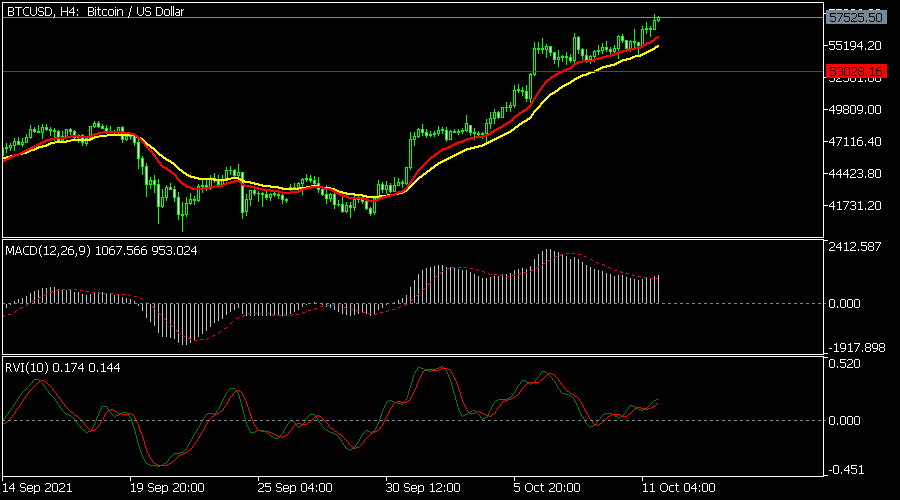
The BTCUSD pair rallied sharply overnight. It rose to a high of 57,500, which was its highest level since May this year. The pair also rose above all moving averages while the MACD and the Relative Vigor Index (RVI) are above the neutral level. The pair has also formed a bullish flag pattern. Therefore, the pair will likely keep rising in the near term.
GBP/JPY Daily Outlook
Daily Pivots: (S1) 153.04; (P) 153.77; (R1) 154.81; More...
Intraday bias in GBP/JPY remains on the upside at this point. As noted before, corrective pattern from 156.05 should have completed after defending 149.03 key support. Further rise would be seen to retest 156.05 high. On the downside, below 152.69 minor support will turn intraday bias neutral and bring consolidations first, before staging another rally.
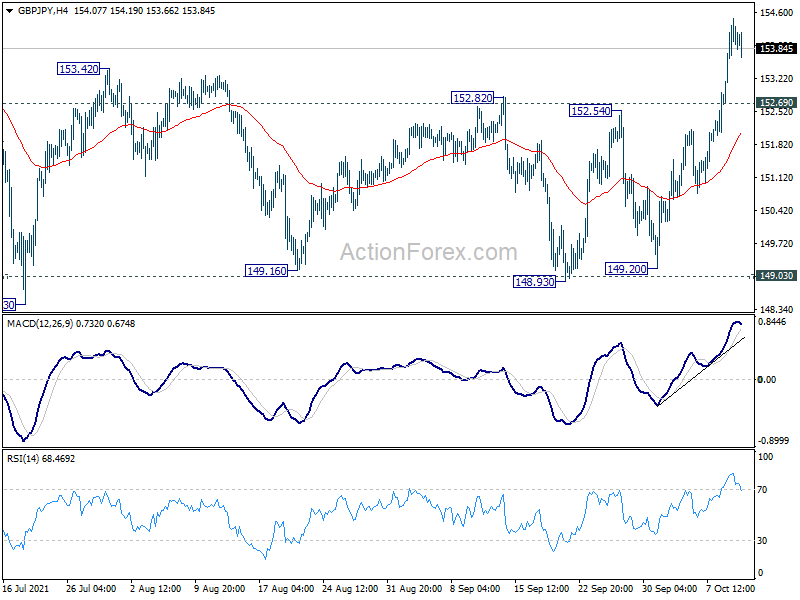
In the bigger picture, rise from 123.94 is seen as the third leg of the pattern from 122.75 (2016 low). As long as 149.03 support holds, such rise would still resume at a later stage. However, sustained break of 149.03 support will indicate rejection by 156.59 (2018 high). Fall from 156.05 would at least be correcting the whole rise from 123.94 (2020 low). Deeper fall would be seen back 38.2% retracement of 123.94 to 156.05 at 143.78 first.
USD/CAD Bounces Off Support
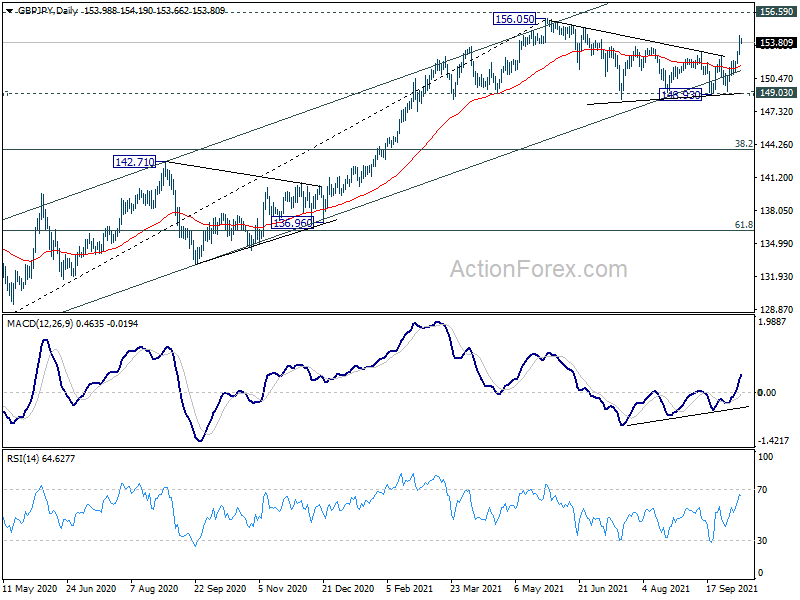
On Monday, the USD/CAD currency pair bounced off a support level at 1.2450. As a result, the US Dollar edged higher by 46 pips or 0.37% against the Canadian Dollar during Monday's trading session.
The exchange rate is currently trading near a resistance level formed by the 50– hour simple moving average at 1.2488.
If the resistance line holds, sellers may continue to pressure the pair lower within this session.
However, if the currency exchange rate breaks the 50– hour SMA, a surge towards the 1.2550 level could be expected today.
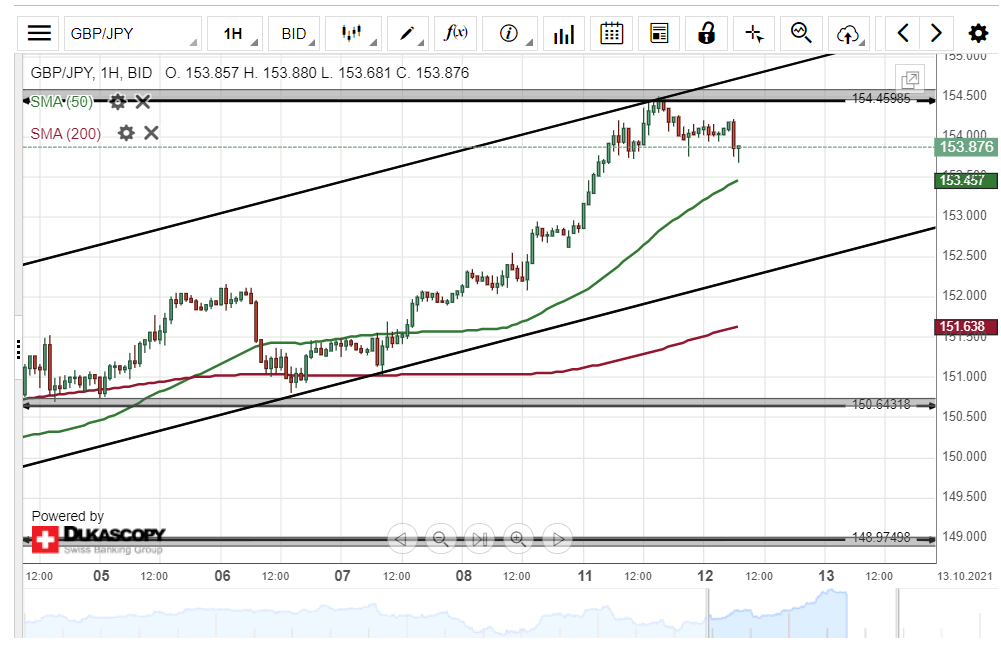
GBP/JPY Breakout Could Occur
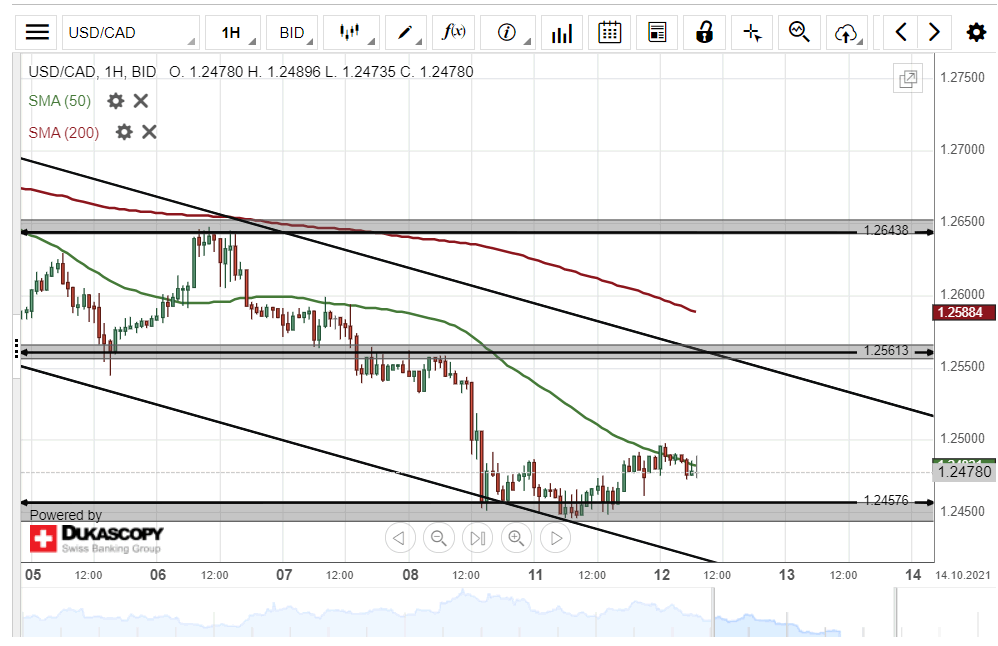
On Monday, the British Pound edged higher by 157 pips or 1.03% against the Japanese Yen. The currency pair tested the upper line of an ascending channel pattern at 154.45 during yesterday's trading session.
All things being equal, the exchange rate could continue to trend higher during the following trading session. A breakout could occur through the upper boundary of the channel pattern.
However, if the channel pattern holds, sellers might target the psychological support level at 153.00 within this session.