

Sample Category Title
USDCAD Approaches The Lower Bollinger Band Near 1.25
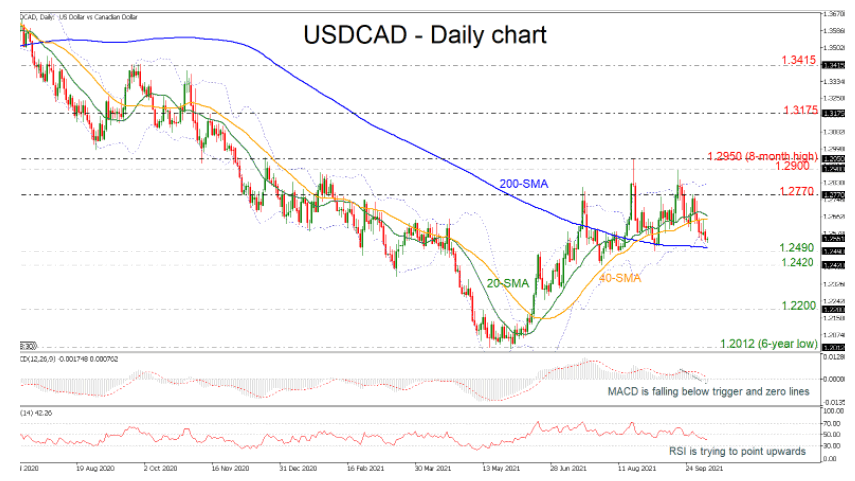
USDCAD is falling after the pullback off the 1.2770 resistance level last week. The price is approaching the lower Bollinger band, while the 20-day simple moving average (SMA) is ready to cross the 40-day SMA to the downside. The MACD is stretching its negative momentum below its trigger and zero lines, while the RSI is holding in the negative region.
If the pair dives beneath the 200-day SMA, which overlaps with the lower Bollinger band, it could open the way for a retest of the 1.2490 support level ahead of the 1.2420 barrier. More losses could drive the bears until the 1.2200 psychological level before meeting again the six-year low of 1.2012.
On the other side, a successful attempt beyond the short-term SMAs could push the price until 1.2770 and the upper Bollinger band around 1.2828. Overcoming these obstacles, the 1.2900 and 1.2950 levels could be the next targets.
Overall, USDCAD has been in a bullish tendency over the last four months; however, any declines below the 200-day SMA could shift the bias to neutral.
EUR/USD Outlook: Strong US Jobs Report Could Push Euro Significantly Lower
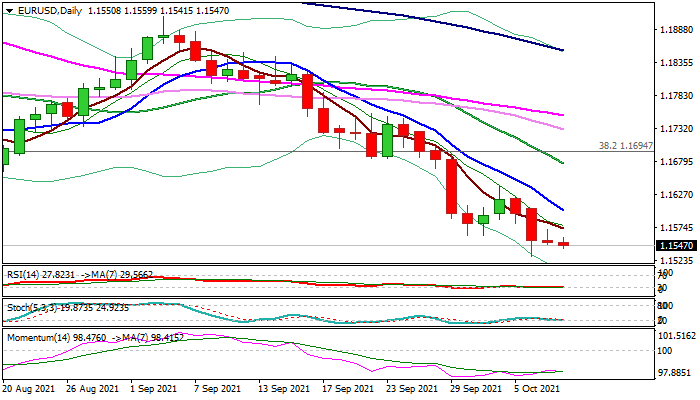
The Euro remains at the back foot but Thursday’s Doji and tight ranges in early Friday, signal hesitation, as bears face headwinds from cracked weekly cloud base (1.1538).
Traders await US jobs report for stronger signals with likely scenario of fresh dollar’s rally on expected solid NFP numbers, as well as lower unemployment in September.
Daily studies remain in full bearish setup and maintain downside pressure, with Friday’s close below weekly cloud to generate strong bearish signal, which would be boosted by break of next key support at 1.1492 (50% retracement of 1.0635/1.2349 ascend).
Falling 10DMA (1.1602) marks pivotal barrier, with sustained break here to sideline immediate bears, while lift and close above 1.1675 (falling 20DMA/Fibo 38.2% of 1.1909/1.1529) would signal reversal in the scenario which could be triggered by strong NFP miss.
Res: 1.1574, 1.1602, 1.1675, 1.1695.
Sup: 1.1538, 1.1492, 1.1402, 1.1290.
CAD/CHF Two Scenarios Likely
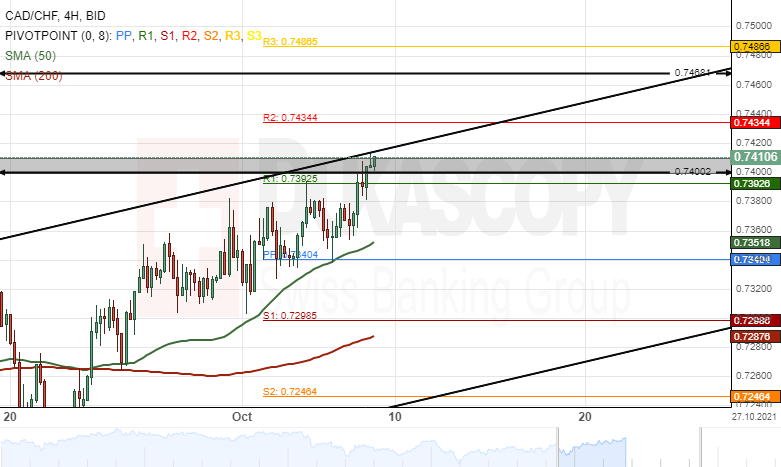
Since September 22, the Canadian Dollar has edged higher 2.86% against the Swiss Franc. The CAD/CHF currency pair breached the 0.7380 area during this week's trading sessions.
Currently, the exchange rate is trading near the upper line of an ascending channel pattern and could be set for a breakout.
If the breakout occurs, a surge towards the 0.7500 level during the following trading sessions.
However, if the channel pattern holds, sellers might target the weekly support level at 0.7298 during the coming weeks.
NZD/JPY Breakout Could Occur
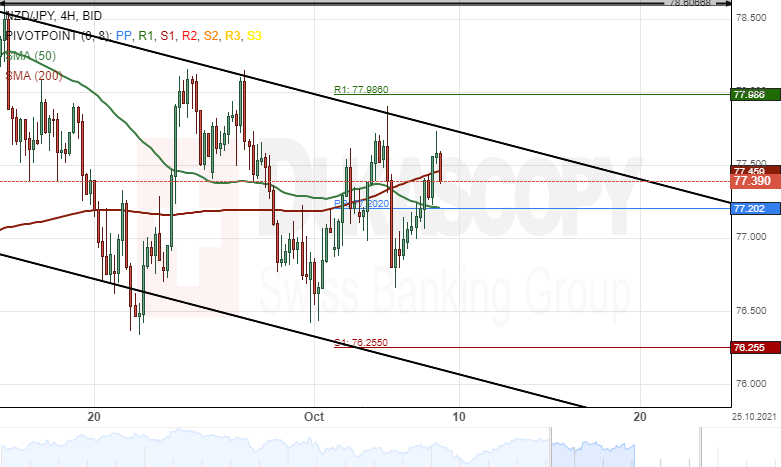
The NZD/JPY currency pair bounced off a support level at 76.50 on October 1. As a result, the New Zealand Dollar surged by 1.22% against the Japanese Yen during this period.
All things being equal, the exchange rate could continue to edge higher. A breakout through the upper boundary of a descending channel pattern could occur during the following trading sessions.
However, if the channel pattern holds, bearish traders might target the support level at 76.25 next week.
EUR/USD Analysis: Finds Resistance In SMA
The recovery of the EUR/USD found resistance on Thursday in the 55-hour simple moving average. On Friday morning, the rate was being pushed down by the SMA into the support of the weekly S1 simple pivot point at 1.1532.
If the EUR/USD passes the support of the weekly S1 simple pivot point, the rate might find support in the round exchange rate level of 1.1500. Below this level, the weekly S2 simple pivot point at 1.1464 might stop a larger decline.
On the other hand, the currency exchange rate might pass the resistance of the 55-hour simple moving average. A passing of the SMA might find resistance in the 100-hour SMA at 1.1580. Above the 100-hour SMA, the 200-hour SMA and the 1.1600 level might act as resistance.

GBP/USD Analysis: Bounces Off Weekly High
On Thursday, the GBP/USD bounced off the week's high level zone at 1.3640/1.3650. On Friday morning, the rate was looking for support in the 55 and 100-hour simple moving averages at 1.3600.
A passing of the support of the 55 and 100-hour SMAs and the 1.3600 level would most likely result in a decline to the weekly simple pivot point at 1.3563 and the 200-hour SMA at 1.3559. Below these levels, there is no technical support as low as 1.3397.
However, if the pair starts a surge, it would once again test the week's high level zone at 1.3640/1.3650. Above this zone, the weekly R1 simple pivot point at 1.3714 might act as resistance.

USD/JPY Analysis: Could Reach 112.00
At midnight to Friday, the USD/JPY currency exchange rate passed the October 6 high level near 111.80. On Friday morning, the currency exchange rate had almost reached the 112.00 mark. Note that the zone above the 112.00 level at 112.05/112.10 might once again act as resistance, as it did on September 29 and 30.
A move above the 112.05/112.10 level might result in a surge to the weekly R2 simple pivot point at 112.78. However, the 112.50 mark might act as a resistance level and slow down a potential move upwards.
Meanwhile, a decline from the 112.00 level or the 112.05/112.10 zone might look for support in the previous high level at 111.80. Below the 111.80 mark, the 55, 100 and 200-hour simple moving averages might serve as support levels in the 111.40/111.60 range.

Gold Analysis: Remains Near Previous Level
The recovery of the yellow metal on Thursday stopped at the 1,765.00 level. Since the encounter of the resistance, the price has been trading sideways in the 1,750.00/1,765.00 zone.
In the case of a decline, the bullion's price might look for support in the 200-hour simple moving average at 1,751.00, the 1,750.00 mark and the support zone of this week's low levels below the 1,750.00 level.
On the other hand, a potential surge might find resistance in round price levels, as it has done before. However, note the resistance of the 1,781.00/1,784.00 zone.

Oil Bounces Back, Gold Range-Trading
Oil prices rebound
As expected, oil’s sell-off proved very temporary and oil prices rebounded sharply overnight. Brent crude rose by 2.0% to USD 82.45, and WTI leapt 2.50% higher to USD 78.85 a barrel, with no indications from the government that any reserves from the SPR would be released onto the market. The return of China mainland markets today has seen the rally continue, with both contracts 0.50% higher to USD 82.85 and USD 79.20 a barrel.
The Russian-inspired sell-off in natural gas prices has quickly come to a halt with prices steady overnight, as the markets digest the reality of the high in rhetoric, but low in specifics nature of the announcements. With China in the market “at all costs” for energy supplies and no instant magical panacea for Europe and the UK’s energy woes, the Russian announcements were never likely to have more than a transitory effect. By default, that will continue to support oil prices. Similarly, China’s announcement allowing inner Mongolia coal mines to ramp up production has had zero impact, emphasising that higher prices are the path of least resistance.
With the relative strength indexes (RSIs) on both contracts moving lower into neutral territory, oil prices now have plenty of room to continue rising from a technical analysis perspective. Brent crude has initial support at USD 79.50 but only a fall through USD 76.00 a barrel would alter the bullish outlook. Resistance is nearby at USD 83.50 a barrel, and a test of USD 88.00 a barrel cannot be ruled out next week. Likewise, only a fall through USD 73.00 would alter the bullish outlook for WTI. A rise through resistance at USD 80.00 a barrel opens the door for further gains targeting USD 84.00 a barrel initially.
I continue to expect any oil price sell-off to be short-lived given the physical demand out there on spot markets for energy. Likewise, I expect the US Non-Farm Payroll data to only have a short-term impact on prices, not a structural one.
Gold trades in narrow range ahead of US data
Gold prices held steady at USD 1755.00 overnight, rising slightly to USD 1758.50 an ounce in Asia this morning. The usual pre-weekend, pre-data risk hedging by Asian investors accounting for the modest price rise. Overall, though, gold remains confined within a narrow USD 1750.00 to USD 1770.00 an ounce range as it awaits the US Non-Farm Payroll data this evening.
Like other asset classes, the US data presents a very binary outcome for gold prices. Weak data should see gold rise back towards USD 1800.00 as tapering expectations are reigned in. Conversely, a strong number puts the Fed taper front and centre. US yields and the US dollar are likely to rise, and gold’s medium-term descent should resume.
Gold has initial resistance at USD 1770.00 an ounce, followed by USD 1790.00 and then the formidable USD 1800.00 to USD 1810.00 zone, containing the 100 and 200-day moving averages. Support lies at USD 1750.00 initially and strong US data should see gold retest support at USD 1720.00 an ounce. A weekly close below USD 1680.00 signals a much deeper correction is in place extending below USD 1600.00 an ounce.
Dollar Eases On Debt Ceiling Agreement
The US dollar edges lower on Senate debt deal
The US dollar gave back some of its recent gains overnight after a short-term US debt ceiling compromise increased investor risk appetite and a rotation out of US dollars. The dollar index finished only slightly lower though, falling just 0.04% to 94.20, thanks in part to weak German data eroding the euro. In Asia, the index has resumed its climb, rising to 94.26. Overall, my expected range of 93.50 to 94.50 has held well through the week.
Currency markets continue to take a less reactionary stance than equities, helped in part, by US yields remaining stubbornly at the high end of the week’s ranges. That suggests that currency markets and bond markets are taking the threat of a Fed taper rather more seriously than the equity space and that tonight US data will be pivotal. A high print should see the dollar index retest 94.50 and rise into next week. Conversely, a disappointing print will delay taper expectations and lead to short-term US dollar weakness.
Weak German data capped EUR/USD overnight and saw EUR/GBP sold heavily. EUR/USD remains near the bottom of its weekly range, at 1.1500 this morning. The single currency remains vulnerable to more US dollar strength and robust employment data tonight sets up EUR/USD for another move lower targeting 1.1400 next week. Resistance at 1.1600 and 1.1650 look safe for now. GBP/USD continues to flirt with its breakpoint point, trading at 1.3610 in Asia. The rally by sterling is mostly due to EUR/GBP selling, driven by weak German data and hawkish comments from UK officials. Rallies toward resistance at 1.3650 have been well contained and strong US data tonight could see sterling’s sell-off resume. USD/JPY has continued creeping higher to 111.85 today as US yields remain anchored at recent highs, ignoring the short-term exuberance in equity markets over the debt ceiling compromise. A weekly close above 112.00 will signal further losses for the yen into next week.
AUD/USD and NZD/USD have risen modestly to 0.7310 and 0.6930 as investor caution ebbs after the debt ceiling compromise. Both remain vulnerable to a firm US Non-Farm print tonight if that swings market opinion back to the Fed taper. With Covid-19 cases spreading and rising in New Zealand, which is tempering RBNZ hiking expectations, the kiwi looks the more vulnerable of the two. Strong US data could see NZD/USD retest 0.6800 next week.
The return of mainland China markets has passed with a whimper, with the PBOC adding just CNY 10 bio of liquidity and setting a neutral USD/CNY fixing at 6.4604. Onshore CNY is trading on the firmer side of the fix at 6.4500 today, lending some support to regional Asian currencies which have suffered at the hands of a stronger US dollar this week. One notable exception is USD/INR, which has continued firming overnight and this morning ahead of the RBI policy decision shortly. Forex markets look poised to sell INR once again if the RBI remains fully on hold, and a test of 75.000 looms into the end of the week. Once again, Asian currencies face a very binary outcome once US employment data is released. On hold today ahead of the data, a high Non-Farm print will resume the downward pressure on Asia FX, while a weak number will provide some short-term relief.