

Sample Category Title
The Analytical Overview Of The Main Currency Pairs
The EUR/USD currency pair
Technical indicators of the currency pair:
Prev Open: 1.1598
Prev Close: 1.1556
% chg. over the last day: -0.36%
The data from ADP showed that US private sector employment increased by 568,000 jobs beating analysts' expectations. Eurozone retail sales increased by 0.3% in August compared to a 2.6% decline in July. Economists forecast an increase of 0.8% in August. German factory orders fell sharply by 7.7% month-over-month.
Trading recommendations
Support levels: 1.1502, 1.1453
Resistance levels: 1.1583, 1.1671, 1.1717, 1.1772, 1.1802, 1.1835
From the technical point of view, the EUR/USD trend is bearish. Yesterday, the price went down sharply again. The MACD indicator shows divergence on the higher timeframes. Under such market conditions, traders should consider sell deals from the resistance levels near the moving average, as the price has deviated from the middle line. Buy trades should be considered only from the support levels with additional confirmation in the form of a buyers' initiative.
Alternative scenario: if the price breaks out through the 1.1717 resistance level and fixes above, the mid-term uptrend will likely resume.

News feed for 2021.10.07:
- German Industrial Production (m/m) at 09:00 (GMT+3);
- Publication of the Eurozone ECB Account of Monetary Policy Meeting at 14:30 (GMT+3);
- US Initial Jobless Claims (w/w) at 15:30 (GMT+3).
The GBP/USD currency pair
Technical indicators of the currency pair:
Prev Open: 1.3627
Prev Close: 1.3582
% chg. over the last day: -0.33%
Inflation expectations in the UK have reached a 13-year high. The 10-year breakeven rate reached 4%, which is twice the target of the Bank of England. The increase came on the back of a record rise in UK gas prices this week. The growth of the construction sector also slowed down in September.
Trading recommendations
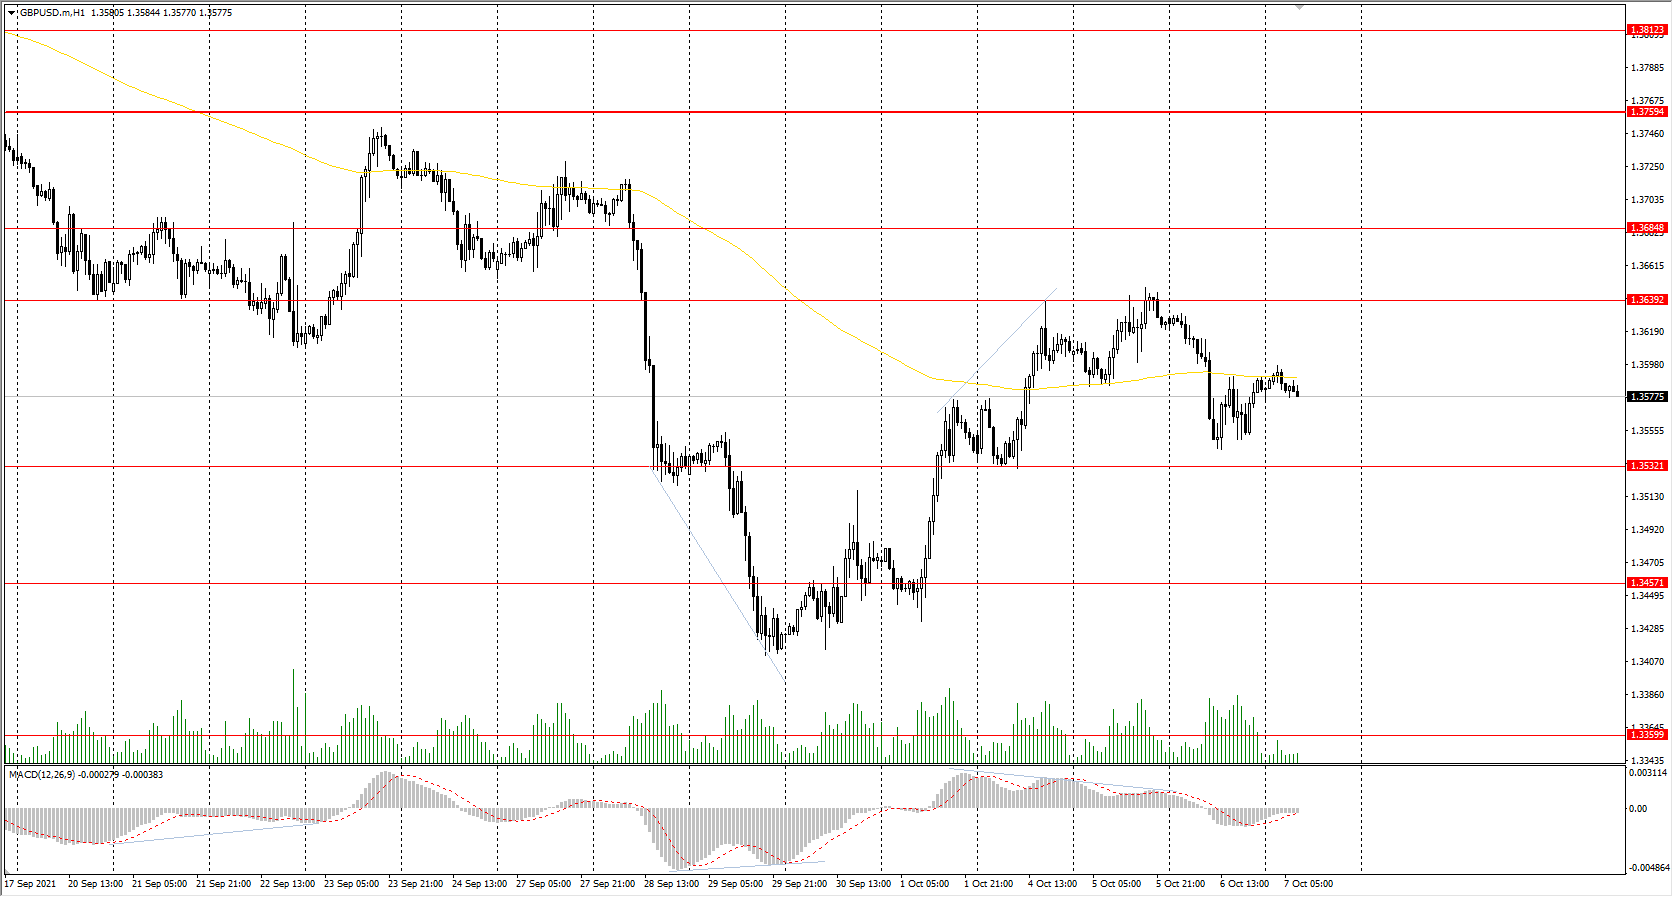
Support levels: 1.3532, 1.3457, 1.3360, 1.3282
Resistance levels: 1.3639, 1.3685, 1.3759, 1.3812, 1.3886
On the hourly time frame, the GBP/USD trend is bearish. The British currency looks more confident than the euro, due to a direct correlation with oil prices. The MACD indicator has become inactive. Buy trades should be considered only throughout the day and only with short targets from the support levels after the buyer’s initiative. Sell trades can be found at the resistance levels near the moving average line.
Alternative scenario: if the price breaks out through the 1.3759 resistance level and consolidates above, the bullish scenario will likely resume.
The USD/JPY currency pair
Technical indicators of the currency pair:
Prev Open: 111.46
Prev Close: 111.41
% chg. over the last day: -0.04%
The Japanese yen is highly correlated with the dollar index. The dollar index is growing fundamentally, which contributes to the growth of USD/JPY quotes.
Trading recommendations
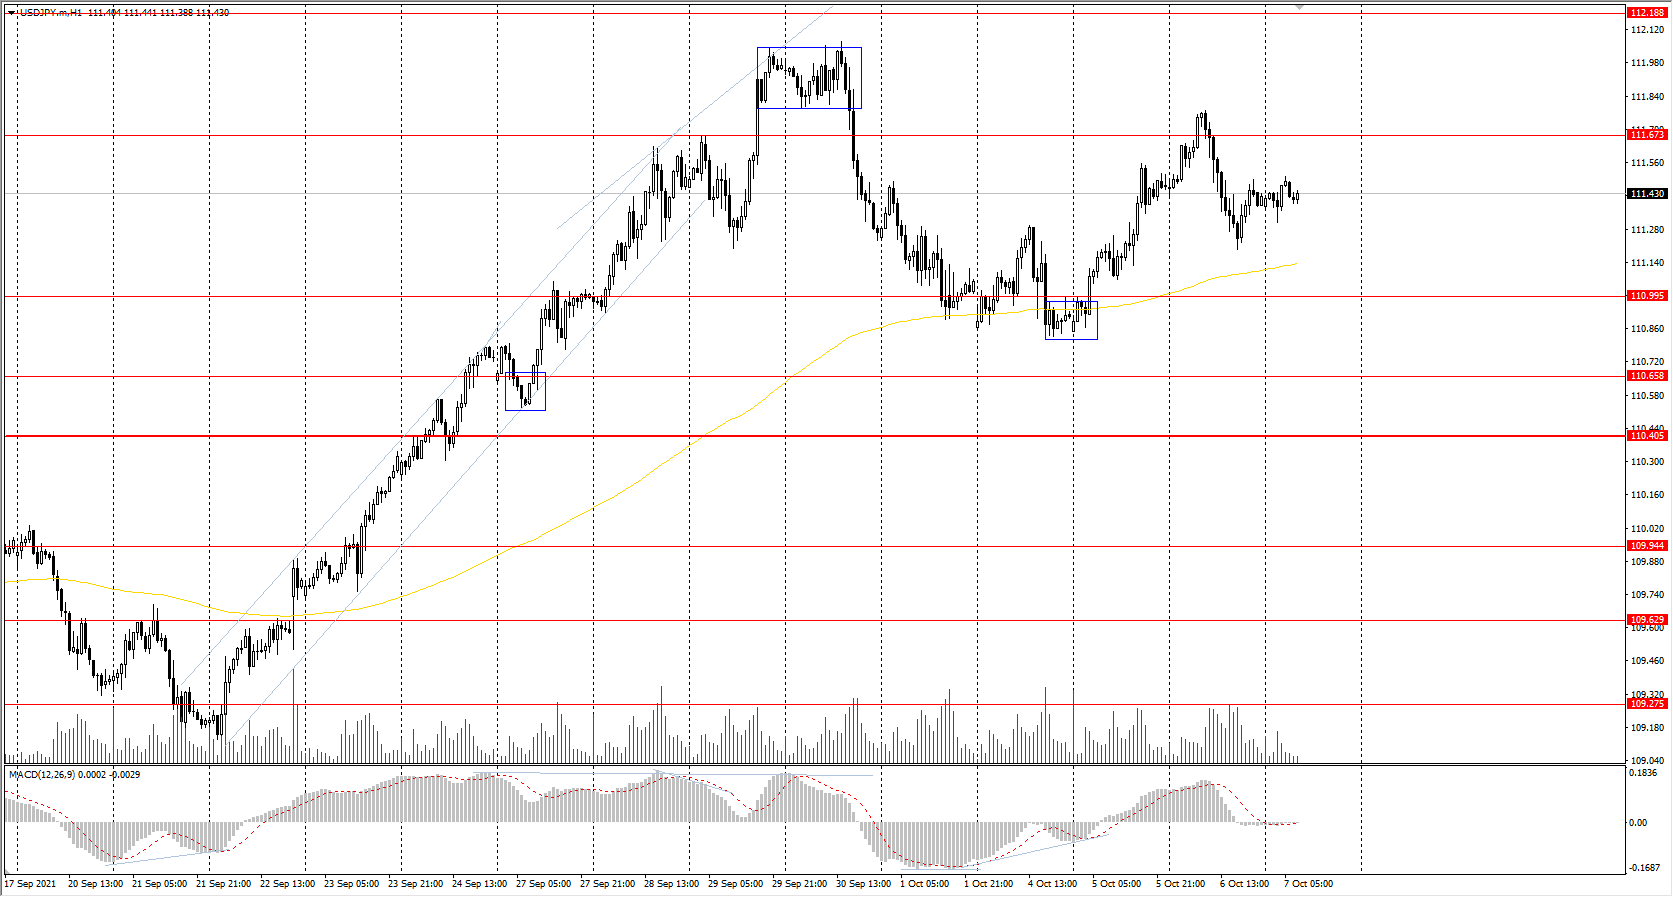
Support levels: 110.99, 110.65, 110.40, 109.95, 109.63, 109.27
Resistance levels: 111.67, 112.19
The main trend of the USD/JPY currency pair is bullish. The MACD indicator has become inactive, the price begins trading flat. Under such market conditions, it’s better to look for buy positions from the support levels near the moving average. Sell positions should be considered only throughout the day from the resistance levels, given there is sellers' initiative.
Alternative scenario: if the price falls below 110.45, the uptrend is likely to be broken.
The USD/CAD currency pair
Technical indicators of the currency pair:
Prev Open: 1.2576
Prev Close: 1.2590
% chg. over the last day: +0.11%
The Canadian dollar is a commodity currency, so USD/CAD is highly dependent on the dynamics of the dollar index and oil prices. The dollar index was slightly stronger yesterday, while oil prices decreased. As a result, the USD/CAD quotes have slightly increased, but the price is still trading in a wide flat.
Trading recommendations
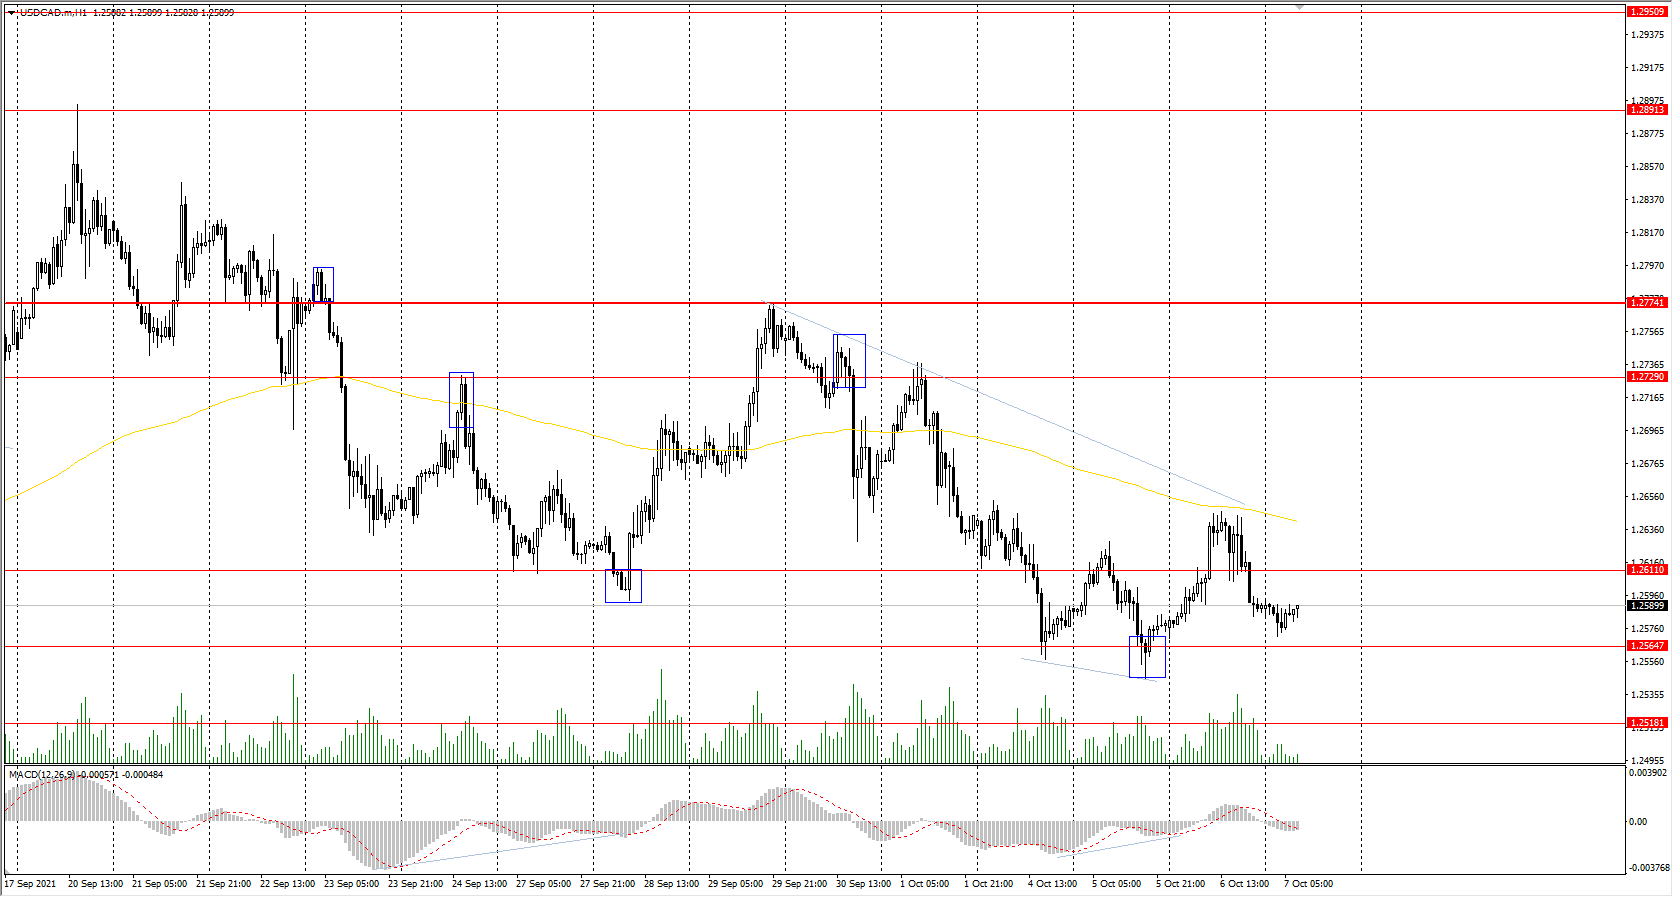
Support levels: 1.2565, 1.2518, 1.2425
Resistance levels: 1.2611, 1.2729, 1.2774, 1.2891
From the technical point of view, the trend of the USD/CAD currency pair is bearish. But the MACD indicator is showing the divergence in the direction of buying. Under such market conditions, it is better to look for sell deals from the resistance levels near the moving average. Buy deals should be considered from the false breakdown zone but with short targets.
Alternative scenario: if the price breaks out through the 1.2774 resistance level and fixes above, the uptrend will likely resume.
News feed for 2021.10.07:
- Canada Ivey PMI (m/m) at 17:00 (GMT+3);
- Canada BoC Gov Tiff Macklem’s Speech at 19:00 (GMT+3).
USD Remains Elevated On Inflation Fears
The USD gained against most of its counterparts yesterday according to the Dollar index, while retained a 14-month high against the EUR. The greenback was supported as worries for inflationary pressures remain high, while at the same time the frequent comments made by Fed's policymakers about the issue and a tapering of the bank's QE program tend to reinforce such expectations. It's characteristic that the US bond yields remained at rather high levels also providing further support for the USD. Also yesterday, US stock markets seemed to be on the rise as worries about the US debt ceiling issue seemed to ease. On the other hand, gold prices showed little volatility yesterday. The market's attention increasingly turns towards the release of the US employment report for September and it should be noted that the ADP employment figure released yesterday, rose more than expected, implying a tightening of the US employment market. Today we note the release of the weekly initial jobless claims figure while Cleveland Fed President Mester is scheduled to speak.
The USD index continued to be on the rise breaking the 94.10 (S1) resistance line, now turned to support. We tend to maintain a bias for a wide sideways movement for the index between the 94.60 (R1) and the 93.70 (S2) levels currently. The RSI indicator on the other hand, is above the reading of 50 implying an advantage for the bulls. Should the bulls actually take charge of the index we may see it breaking the 94.60 (R1) resistance line and aim for the 95.00 (R2) level. Should the bears take over, we may see the index breaking the 94.10 (S1) resistance line and take aim or even breech the 93.70 (S2) level.
Natural Gas corrects lower
The price for natural gas has corrected lower yesterday after reaching a record high level not seen in years.
It should be noted that Russian President Vladimir Putin stated that Russia is ready to help stabilize the global energy markets. The statements caused a correction of Dutch and UK natural gas prices, yet the market seems to remain rather volatile and uncertain. However, a substantial increase of Russian exports of natural gas to Europe may entail a quick certification of Nord Stream 2, which was halted by the European courts and some European states may be unwilling to allow. Besides Gas also WTI prices seem to have started to retreat probably also affected by another surprise substantial build up of the US oil inventories as shown by the EIA weekly figure yesterday. We tend to maintain our worries for the energy market and expect fundamentals to play a key role in its price configuration.
The price of natural gas dropped yesterday after reaching a multi-year high and landed just above the 5.670 (S1) support line. Given that the commodity's price, in tis downward movement also broke the upward trendline guiding it since the 23rd of September, we switch our bullish outlook in favour of a bias for a sideways movement, at least initially. Please note though that some bearish tendencies could be present, given that the RSI indicator below our 4-hour chart has dropped below the reading of 50. Should a selling interest be displayed by the market for the commodity, we may see its price breaking the 5.670 (S1) support line and take aim for the 5.200 (S2) level. Should buyers take charge of the commodity's direction, we may see its price aiming if not breaching the 6.320 (R1) resistance line in an effort for a new multi-year high.
Today's events and expectations
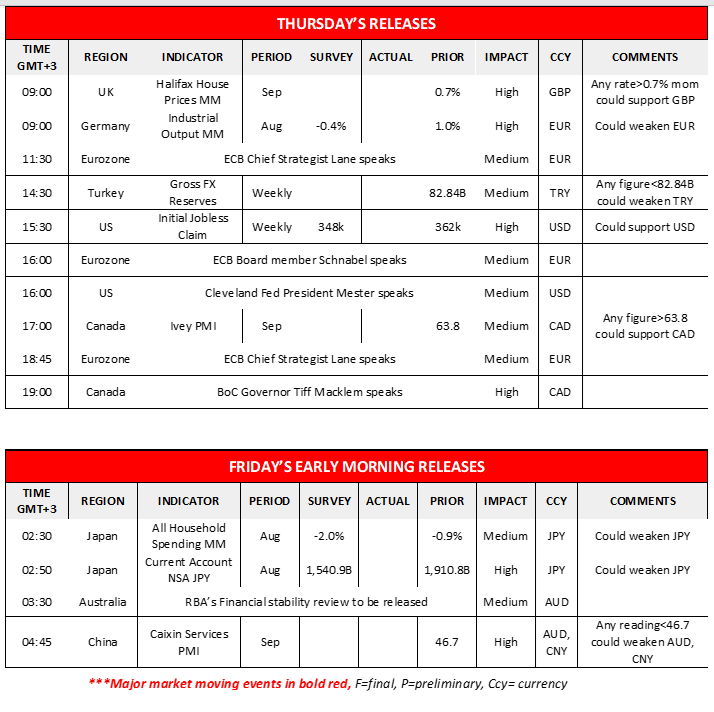
Today in the European session, we get UK's Halifax House prices for September and Germany's industrial output for August. In the American session we note the weekly initial jobless claims figure, while on the monetary front we note the planned speeches of ECB's Lane and Cleveland Fed President Mester. During tomorrow's Asian session we get Japan's current account balance for August, and China's Caixin Services PMI for September, while RBA's Financial stability review is to be released.
USD Index H4 Chart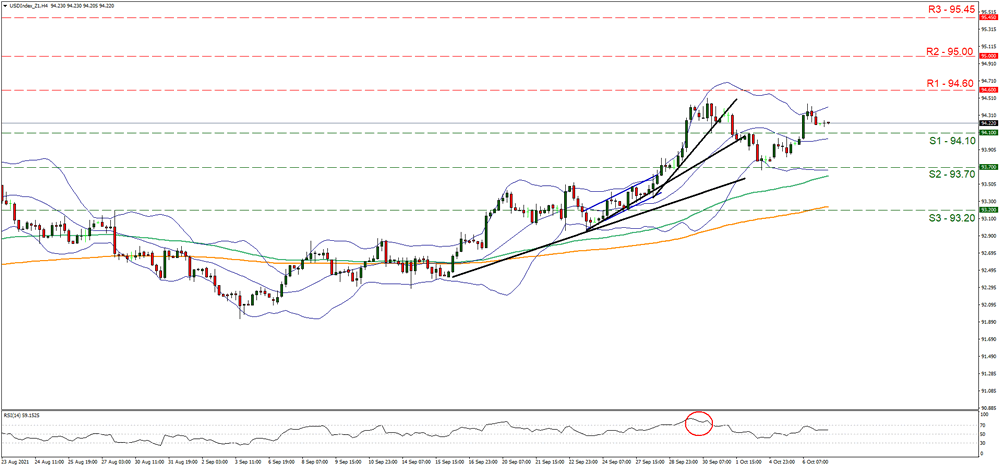
Support: 94.10 (S1), 93.70 (S2), 93.20 (S3)
Resistance: 94.60 (R1), 95.00 (R2), 95.45 (R3)
Natural Gas H4 Chart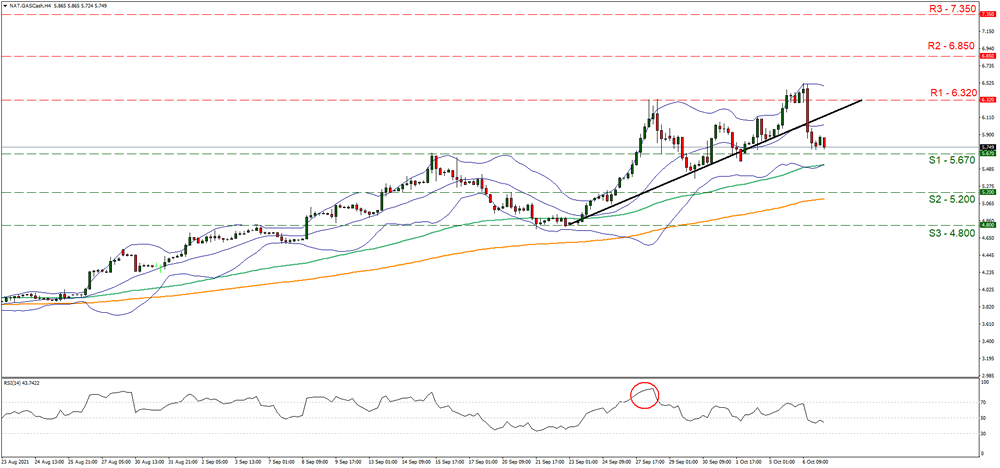
Support: 5.670 (S1), 5.200 (S2), 4.800 (S3)
Resistance: 6.320 (R1), 6.850 (R2), 7.350 (R3)
Energy Prices Raise Concerns Over Further Growth In Inflation Worldwide
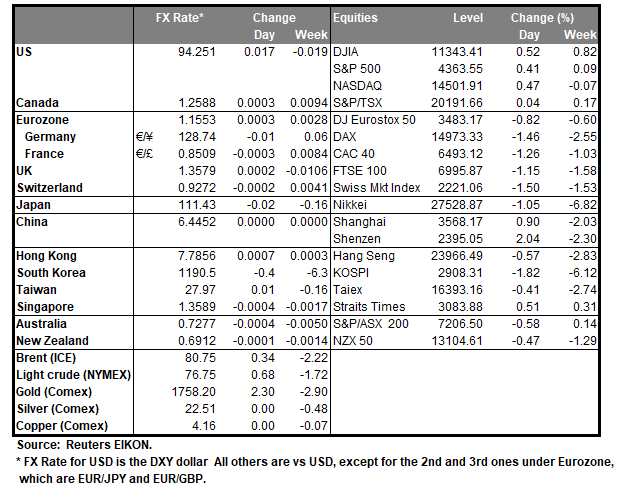
The US stock market closed in the green zone due to the strength of the utilities, technology, and industrial sectors. The Dow Jones increased by 0.30%, the S&P 500 added 0.41%, and the NASDAQ Composite increased by 0.47%. Reducing the QE program seems to be a done deal for the Federal Reserve's November meeting. Fed Chairman Jerome Powell has set a very low bar for the labor market in terms of what the Fed needs to see in order to begin cutting the stimulus program.
The well-known investor and manager Warren Buffett claims that the US will not face a debt crisis as long as the country issues debt in its own currency. He says that inflation and excessive money printing are the only real risks of government borrowing.
According to Bloomberg, more than $1.5 billion has been injected into four of the highest-yielding exchange-traded funds in the US in recent days. The infusion of funds came just as the chairman of the Securities and Exchange Commission warned that a derivatives-based style of investing was not suitable for everyone.
European stock markets decreased yesterday amid inflation fears and rising government bond yields. The Stoxx Europe 600 composite index of major companies lost 1.03%, Germany's DAX index decreased by 1.5% (to its lowest in five months), the British FTSE 100 decreased by 1.15% (to its lowest since late September), the French CAC 40 lost 1.3%, Spain's IBEX 35 and Italy's FTSE MIB lost 1.7% and 1.35%, respectively. Analysts are worried about the effects of the cold winter and energy shortages in Europe, as EU energy demand hit a 25-year high and credit risk in Europe rose to its highest level since March.
Denmark and Sweden have temporarily stopped offering Moderna Covid-19 vaccines to people under 18 because of the risk of side effects for the heart muscle.
US oil reserves increased by 2.3 million barrels in a week. Goldman Sachs predicts that the energy crisis will lead to an increase in oil consumption later this year, as China has ordered state-owned firms to ensure energy supplies for the winter at any cost. But OPEC officials believe a price of $70 to $80 a barrel is optimal for both producer and consumer. The electricity crisis is worrying energy markets from Europe to Asia, where fuels that can be used for heating or power generation, such as propane, diesel, and fuel oil, are in high demand.
Today, Asia-Pacific stock indices returned to the green zone. All major Asian indices (Hang Seng, Kospi, Nikkei 225, ASX 200) increased yesterday. Mainland China’s exchanges are closed for holidays this week.
US Secretary of State Blinken says that China should stop its actions against Taiwan because China's steps are provocative and destabilizing.
China's state-owned COMAC is close to bringing the C919 passenger airliner to market, which is a direct competitor to the Airbus A320 and Boeing 737 MAX.
India's Silicon Valley, Karnataka state has banned online gambling.
Main market quotes:
- S&P 500 (F) 4,363.55 +17.83 (+0.41%)
- Dow Jones 34,416.99 +102.32 (+0.30%)
- DAX 14,973.33 −221.16 (−1.46%)
- FTSE 100 6,995.87 −81.23 (−1.15%)
- USD Index 94.21 +0.23 (+0.25%)
Important events for today:
- Switzerland Unemployment Rate (m/m) at 08:45 (GMT+3);
- German Industrial Production (m/m) at 09:00 (GMT+3);
- Publication of the Eurozone ECB Account of Monetary Policy Meeting at 14:30 (GMT+3);
- US Initial Jobless Claims (w/w) at 15:30 (GMT+3)
- Canada Ivey PMI (m/m) at 17:00 (GMT+3);
- US Natural Gas Storage (w/w) at 17:30 (GMT+3);
- Canada BoC Gov Tiff Macklem’s Speech at 19:00 (GMT+3).
Oil Dips, Gold Trading Sideways
Oil prices fall on Russia and US crude inventories
The offer by Russia to pump more natural gas to Europe, while short on detail, was enough to send natural gas prices 10% lower overnight, capping oil’s potential gains. That was followed by official US Crude Inventory data which showed a large jump of 3.25 million barrels. Heating oil, gasoline and distillate inventories showed equally large jumps, suggesting that US production is now back on track after Hurricane Ida. That was enough to spark a sell-off by oil which was already heavily long.
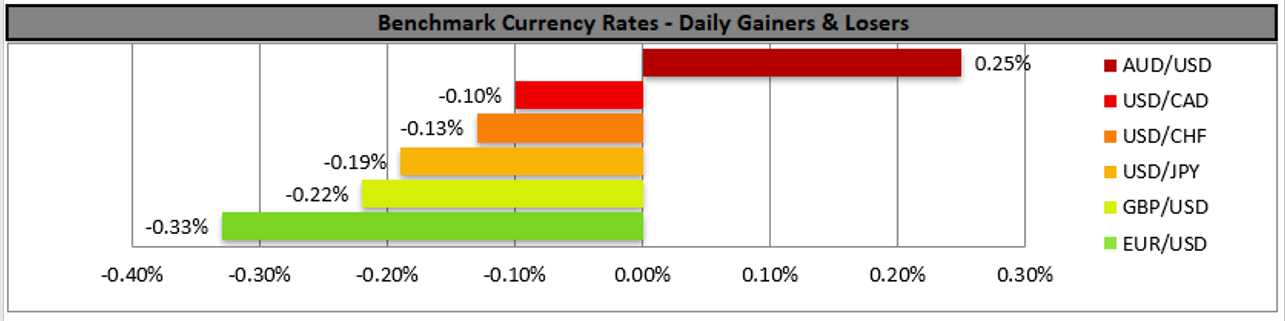
Brent crude fell by 2.10% to USD 80.80, and WTI slumped by 2.70% to USD 76.90 a barrel. Oil prices have continued easing slightly in Asia, with Brent crude trading at USD 80.70 and WTI at USD 76.70 a barrel. For context, however, both contracts remain comfortably higher for the week.
I am looking at the overnight slump as a technical move that was overdue, with fast money speculative longs pushing the relative strength indexes (RSIs) on both contracts into heavily overbought territory. The RSIs are usually a good indicator of technical price reversals when they move into deep overbought or oversold territory. The northern hemisphere energy crisis has not magically vanished overnight, and nor can it be magically solved overnight. Russia’s gas proposal, for example, was high on rhetoric, but low on specific details of how much, how, and when. China also returns to work tomorrow, and you can guarantee they won’t be feeling any more comfortable about their energy situation than before the long break.
The fall overnight looks more like a speculative washout of short-term positioning, and as I have contended all week, the dip in prices is likely to be short in duration. Natural gases prices would have to fall a very long way still to change my mind. I fully expect China buyers to take advantage of this price dip in line with their “at any costs” instruction from the central government.
On Brent crude, I expect physical buyers to be lining up between USD 79.00 and USD 76.00 a barrel, while WTI should find support between USD 76.00 and USD 73.00 a barrel. A few days of sideways price action would further reduce overbought RSI technical indicators, allowing for a retest of USD 83.00 by Brent crude, and USD 80.00 a barrel for WTI, by early next week.
Gold remains sidelined but supported
Gold prices continue showing resilience, trading sideways once again overnight despite a stronger US dollar. Gold rose slightly to USD 1763.00 overnight, slipping to USD 1760.00 an ounce in Asia as listless trading continues. Despite gold seemingly slipping off the radar, its refusal to retreat in the face of firm US yields, a continuing rally by the US dollar and short-term exuberance in the equity market, is telling. Gold’s refusal to roll over in the face of usually bearish headwinds suggests that nervous investors are continuing to quietly hedge risks via long gold positions. If anything, gold’s tenaciousness at these levels signals that today’s equity rally has very shaky foundations.
Gold appears set to retain its haven bid into tomorrow’s US employment data, although that data will cause a very binary outcome for gold into the end of the week. A firm US payrolls should see gold head south once again and potentially test USD 1720.00 an ounce. A weak number could spur a rally through USD1780.00 to USD1800.00 an ounce.
In the meantime, gold looks set to continue finding support into USD1750.00, with gains limited to USD1770.00 an ounce. That narrow range will probably persist into the US data, although pre-weekend Asian buyers tomorrow could keep it near the upper end of that.
US Dollar Ignores Debt Ceiling Hopes
US dollar ignores debt ceiling hopes
Currency markets reacted only marginally to the short-term debt ceiling compromise from the US Republicans overnight. Risk sentiment currencies such as the AUD and NZD narrowed losses, but overall, the US dollar continued marching higher, despite US long-dated yields easing slightly. The dollar index rose 0.27% to 94.23, where it remains in Asia today. Although the dollar index continues to rise, my earlier view remains the same, the 93.50 to 94.50 range will contain until the US employment data is released tomorrow night.
EUR/USD faded 0.35% to 1.1555 overnight, and the single currency has failed to meaningfully test resistance at 1.1650, with 1.1600 now forming a short-term barrier. The euro still looks vulnerable to further pricing of the Fed taper, and a weekly close under 1.1500 tomorrow night will be a powerful bearish signal. GBP/USD continues to just keep its head above water, trading at 1.3585 today. It has failed to recapture its downside breakout line, today at 1.3620, and it is probably only EUR/GBP selling keeping it afloat. GBP/USD remains vulnerable to further falls that retest last weeks 1.3415 lows, as the energy/logistic crisis continues, and the circling wolves of the European Union Brexit lawyers sharpen their pencils. With US yields hardly moving overnight, USD/JPY remains anchored around 111.50. A weekly close above 112.00, or below 109.00, is required to signal USD/JPY’s next directional move.
AUD/USD has now reclaimed all of yesterday’s losses by rising 0.20% to 0.7285 today. The technical picture suggests that gains above 0.7300 will be challenging. However, a soft US Non-Farms tomorrow should see risk sentiment jump, which could propel AUD/USD back towards a 0.7400 handle. NZD/USD looks the more vulnerable right now, remaining 0.70% lower from yesterday at 0.6920. New Zealand’s level 3 virus containment zone was widened to areas south of Auckland today, and I believe Delta’s escape from the metropolis is causing disquiet and is limiting NZD gains. The kiwi remains vulnerable on the AUD/NZD cross and could test 0.6800 if the virus situation darkens or the US Non-Farms outperform.
The Republican debt ceiling compromise offer has given Asian currencies a temporary respite from US dollar strength. Overall, however, regional currencies remain near recent lows versus the greenback. Regional Asian currencies are almost unchanged from yesterday’s open and will have little incentive to move far today, with the major currency space trading quietly, China due to return tomorrow, and US Non-Farm payroll data due tomorrow night. The US data will determine Asia FX’s next directional move, although high energy prices, that are mostly priced and transacted in US dollars, are likely to limit any possible gains, with most of Asia being an energy price taker.
Asia Follows Wall Street Lead With Gains
Debt-ceiling offer tempts Asian equities higher
Asian equity markets are to a positive start today after hopes of a US debt ceiling compromise saw Wall Street sharply reverse losses overnight and move into positive territory. The S&P 500 finished 0.41% higher, the Nasdaq closed 0.47% higher, and the Dow Jones ended 0.30% higher overnight. Interestingly, the US rally continues vigorously in Asia, with US index futures staging powerful gains. Nasdaq futures have jumped 0.75% higher, while S&P 500 and Dow futures have climbed by 0.50%. No one wants to be the FOMO-gnome left behind in US markets.
The strong showing by US markets has been enough to lift animal spirits in Japan and South Korea, which have shown a high correlation to Wall Street of late. The Nikkei 225 is 0.95% higher, while the Kospi has leapt 1.55% higher today. Mainland China remains closed until tomorrow, but Hong Kong is also rallying powerfully today, with Evergrande stock resuming trading. News that the Hong Kong Government will build 90,000 new homes has been received positively and the Hang Seng has leapt 2.15% higher today.
Singapore has climbed by a healthy 0.90% with Taipei up only 0.15%. Gains in Taiwan are perhaps being limited because China’s President Xi is due to make a speech about the island on Saturday. Bangkok has jumped 0.95% higher while Jakarta is 0.40% higher ahead of an important tax law vote today. Falling oil prices have pushed Kuala Lumpur down by 0.20%, while Manila is 0.50% lower.
Australian markets have only rallied modestly, with New South Wales reopening news offset by lower energy prices overnight and the tightening of mortgage lending criteria by the prudential regulator. Still, markets down under are in the green, the ASX 200 and All Ordinaries climbing by 0.55%.
After a horror story day yesterday for European equities, which missed out on the goodies dangled by McConnell and Putin, markets are likely to rebound sharply today. Given the headline-driven nature of the equity moves we have seen this week, I would suggest caution though. We are only one negative headline away from the herd stampeding back the way it came. President Putin’s gas offer was high on rhetoric and short on execution details, and a Democrat rejection of the Republican short-term debt ceiling extension could see normal service resuming.
McConnell-Putin Double Act: The Squid Game
You know we are living in strange times when US Republic Senate Leader McConnell, and Russia’s President Putin, dangle potential rewards from their tentacles and lift markets vigorously, but here we are. Like the compulsively viewable, but ridiculously premised Netflix hit, both men have juicy rewards that millions want, all you have to do is play a few games to get it. Of course, there is some small print, but don’t worry about that.
In the case of Mr McConnell, it is money to fund the US government, lots of it. Sen. McConnell offered a short-term debt ceiling extension to the Democrats until December to allow them to use reconciliation to pass a more permanent measure. Note that word reconciliation. Republicans have no intention of any bi-partisanship regarding a more permanent measure. It will also coincide with trying to pass the equally acrimonious build-back-better multi-trillion-dollar spending package. The fixture congestion would probably kick the latter into touch. Planning for the mid-terms in 2022 is alive and well. The announcement of a two-month kick-the-can-down-the-road offer was enough for desperate buy-the-dippers to reverse course and lift US equities into positive territory.
In President Putin’s case it is energy, namely natural gas. He sparked a near 10% sell-off in natural gas prices overnight after he offered to “stabilise” the natural gas market in Europe by potentially pumping more supplies through the Ukraine. The Russian Vice-President also mentioned certifying Nord Stream 2 once again as a potential solution to Europe’s gaseous woes. President Putin also alluded to the benefit of long-term as to short-term supply contracts. Mr Putin’s comments were high on rhetoric but very low on detail such as how much and when. The message is fairly clear though, you can have all the gas you want in the future, you just need to sign here….
Taken in context, the jump in Wall Street equities overnight didn’t make a dent in the scale of the sell-off on a weekly basis. In the case of natural gases, the 10% fall only unwound the 10% hike in prices from the day before. Rays of hope, yes, but that’s all. Notably, US yields at the long end only flattened marginally and the US dollar kept on rallying, while gold continued to find safety dance bids ahead of the US data tomorrow.
Investors await NFP report
And that brings me back, once again to the US Non-Farm Payrolls. Despite the market chasing its tail and tying itself up in knots each day this week, thanks in part, to a slow data calendar, all roads lead to tomorrow’s US Non-Farm Payrolls. The price reversals were either modest or non-existent on the overnight Squid Game double act. The underlying factor making markets nervous is the trajectory of Federal Reserve monetary policy. In this case, will the Fed taper start in December, or get pushed back into 2022 along with the dot plot? Tomorrow’s US Non-Farm Payroll data should go a long way to answering that question with a print north of 500,000 jobs added locking and loading the taper. I am not expecting a taper-tantrum, but the signs are there to see in the Asian currency space, and I continue to believe the potential taper has not even started to be fully priced into markets. The world will still be a zero per cent one after the taper, but there will be a lot less money-free money sloshing around looking for a home. Don’t sell those US dollars just yet.
Today’s data calendars in Asia and Europe are even more non-existent than yesterday. South Korea’s Current Account and Japan’s Foreign Bond Investment have had no market impact, while the Bank of Japan’s Kuroda said he expects Japan’s CPI to pick up slowly, entirely consistent with the last 25 years I suppose. Patience is a virtue. Japan’s equity markets are entirely focused on Wall Street’s movements now anyway.
Tonight’s weekly US Initial Jobless Claims will allow some last-minute rejigging of Non-Farm forecasts for tomorrow. Overnight, the ADP Employment number rose sharply to 568,000 jobs, well above forecasts. The ADP has been a poor indicator for the Non-Farms of late, is this the month we see a return to the mean?
Otherwise, I expect the headline-driven chop-fest to continue into tomorrow night’s US employment data. All I can say is to be careful accepting the market’s seemingly easy rewards until then; the currency, bond and gold markets are telling us just that. Like the Squid Game, those rewards come with conditions attached and you may not get that perfectly charred calamari.
EUR/USD Analysis: Reaches Weekly S1
The EUR/USD currency exchange rate found support in the weekly S1 simple pivot point at 1.1532. The pivot point held and reversed the rate. On Thursday morning, the following surge appeared to be heading to the resistance of the 55 and 100-hour simple moving averages at 1.1578 and 1.1589.
If the pair passes the resistance of the simple moving averages near 1.1580, the EUR/USD could aim a the 200-hour simple moving average near 1.1620. Above the SMA, the weekly simple pivot point at 1.1631 might serve as resistance.
On the other hand, a bounce off from the 55 and 100-hour SMAs might look for support in the weekly S1 simple pivot point at 1.1532. Below the pivot point, the 1.1500 level would probably provide support.

GBP/USD Analysis: Finds Support
On Wednesday, the GBP/USD passed one support level after another. During the day, all of the technical support levels were passed and the last one of them, the 100-hour simple moving average, was pierced. However, this did not result in a decline, as the combination of the 100-hour SMA and the 1.3550 eventually held and caused a recovery.
By the start of Thursday's European trading hours, the GBP/USD pair had reached above the 100 and 200-hour simple moving averages and the weekly simple pivot point from 1.3563 to 1.3580. In addition, the pair pierced the last technical level, the 55-hour SMA, at 1.3600.
If the GBP/USD clearly passes the resistance of the 1.3600 mark and the 55-hour SMA, the pair could potentially reach for this week's high level zone above the 1.3640 level. Above this zone, the pair might encounter resistance first in the 1.3700 level and afterwards, the 1.3714 level, where the weekly R1 simple pivot point is located at.
On the other hand, a decline would have to move through the support of the 100 and 200-hour SMAs and the weekly simple pivot point at 1.3590/1.3563, before testing the support of the 1.3550 mark.

USD/JPY Analysis: Tests Support Levels
On Wednesday, the USD/JPY declined and found support in the combination of the 55, 100 and 200-hour simple moving averages and the weekly simple pivot point at 111.23/111.29. The support zone held and caused a retracement to the 111.50 mark. On Thursday morning, the 111.50 eventually forced the rate into a decline to the combination of the 100-hour SMA and the weekly simple pivot point at 111.24.
A decline below the 111.24 level would most likely extend as low as the this week's low level zone at 110.85/110.90. Further below this week's low levels, the weekly S1 simple pivot point at 110.39 might serve a support.
Meanwhile, a recovery of the USD/JPY might aim at the 111.50 level first. Afterwards, the 111.80 mark might once again act as a resistance level.
