Sample Category Title
Suspended
Liquidity has been hit in Asia today with mainland China and South Korea on holiday and a partial holiday in Australia. Although Wall Street performed well on Friday, which fed through to lower US yields and the US dollar slipping, news that the Hong Kong Stock Exchange has suspended China Evergrande Group share from trading from today, and related structured products, has put China nerves back front and centre with regional investors.
Evergrande has a USD 260 million offshore note maturing today, which only has a five-day “grace” period, and if no sign of payment occurs, the negative noise around the company and China’s property market will increase once again. There still remains very little visibility from the Chinese government over Evergrande’s fate, although a slow and steady dismantling of the company appears to be the favoured course right now. Mainland China is away until Friday, which is rather unfortunate timing, especially if Evergrande misses that note redemption today.
The data calendar is empty in Asia today, literally, leaving markets at the mercy of headline-driven volatility in a low-liquidity environment. Globally, the calendar is thin as well with only US Factory Orders this evening of moderate importance. By far and away the most important event today will be the OPEC+ meeting, given the surge in energy prices around the world and the blackouts in China. OPEC+ has a regular record of surprising, but I doubt that the grouping will be willing to much more than throw a few bandaids on production levels. With compliance well over 100% amongst members, they probably don’t have the capacity to aggressively ramp up production at short notice anyway. The December production cuts could be brought forward to November as a placation mechanism, but after a torrid 18 months, the temptation to fill depleted state coffers is probably too much to resist right now. I do note that the world was working just fine when oil prices were touching USD 140.00 a barrel. This is a natural gas and coal problem, not an oil problem. Oil is just the accidental tourist.
In the US the USD 3.5 trillion build-back-better and USD 1.0 trillion (or is it 550 billion?) infrastructure packages remain mired in limbo amongst the squabbling democrats. The debt ceiling, kicked down the road to December, also remains up in the air. Perversely, US markets seem to be liking the uncertainty caused by the Democrat “progressive” wing, who need to understand the words “mid-term elections” and “claim the centre.” The stock market, in particular, takes a liking to government paralysis or infighting. That equals no change to policy equals status quo equals buy everything. It wouldn’t surprise me in the least this week, if US stock markets rally inversely proportionally to Democrat infighting.
All roads, of course, will lead to the US Non-Farm Payrolls data from the US on Friday. Easing virus cases and the end of summer holidays, along with school reopening should see an improvement on August’s shocker of a number. Markets are forecasting a gain of around 500,000 jobs for September, although that number becomes a moving target as the week goes on and forecasts are refined. A number much lower than 500k will see Fed taper expectations dialled back, although probably at the expense of increasing stagflation noise. I’m not sure how to position for that but buy-everything seems to usually work no matter what. Conversely, a much higher number will lock and load a December taper start, assuming any FOMC members can be drawn away from their personal trading accounts and are left to vote next month. That should see the slow taper-tantrum-lite of the last two weeks resume.
RBA, RBNZ exepected to hold the course
In Asia-Pacific, we have three central banks announcing policy decisions this week. Australia’s RBA will remain unchanged tomorrow and having already hedged its bets expertly in previous statements, will remain ultra-dovishly on the fence with the optionality to jump each way. The Reserve Bank of India has ignored stagflation for all this year, and I expect them to do so once again and hold rates unchanged. Like the Philippines’ BSP, if the Non-Farm’s this Friday confirm a Fed taper, it’s going to be hard to maintain that low and hope policy. Expect pressure to remain on the rupee, especially with energy prices likely to increases importer INR selling.
New Zealand’s RBNZ policy decision is due on Wednesday with the central bank delaying the last meeting’s scheduled interest rate hike because of the arrival of the delta-variant the day before in Auckland. History is repeating itself it seems, with the virus jumping the Auckland fence into a surrounding province over the weekend. If they spike before Wednesday, I expect the RBNZ to have another “least worst option” and postpone once again. They may telegraph an above 0.25% hike to make up for it in the future, but there probably aren’t many reasons to be aggressively buying kiwi this week.
OPEC Meeting In Focus As Energy Crisis Rages
- Wall Street rebounds after Merck covid pill, but sentiment fragile
- Dollar retreats a little as nonfarm payrolls week kicks off
- OPEC meeting today could be crucial amid unfolding energy crisis
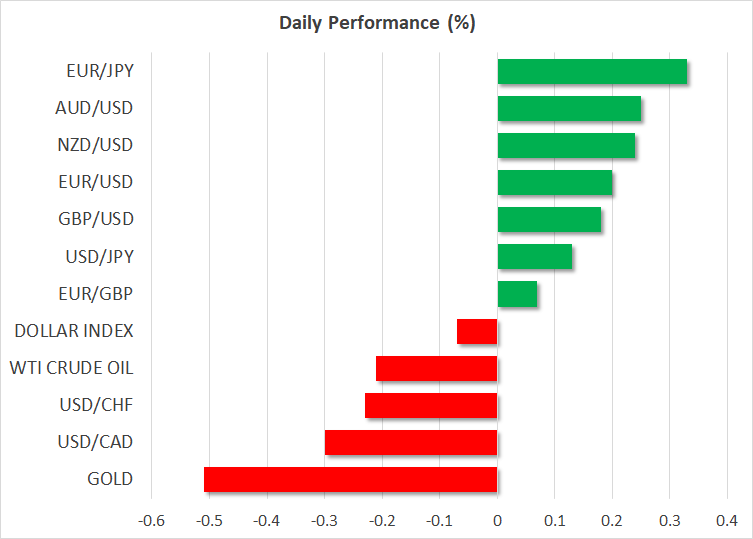
Stocks trapped in limbo
Global markets continue to grapple with a variety of risks, from supply chains being in disarray to an energy crisis that has engulfed Europe and Asia, simultaneously threatening to hamstring economic growth and keep inflation hot for longer.
This is precisely what the latest ISM manufacturing survey revealed. The headline index ticked up in September but for ‘unhealthy’ reasons as supplier delivery times lengthened, while prices paid by manufacturers rose at a faster clip. Every single anecdotal comment was either about damaged supply chains or labor shortages.
Risks emanating from China haven’t faded either, with a hangover in the embattled real estate sector likely to amplify any slowdown in the world’s growth engine. On top of that, trade risks are back on the menu following reports the US Trade Representative will announce today that China is not complying with the Trump-era trade deal.
The only piece of positive news was that Merck has developed an experimental pill that can halve the chances of dying or being hospitalized from covid. This helped Wall Street stage a solid rebound on Friday, but futures are back in the red today as even a covid treatment won’t fix supply chains or cool energy prices. Markets have already put the health crisis behind them - the issue now is dealing with its economic aftershocks.
Dollar takes a step back
In the FX complex, the US dollar is on the back foot on Monday, allowing every other major currency to breathe a sigh of relief after being suffocated last week by the reserve currency’s powerful gains. The main event this week will be the US employment report on Friday, which will decide whether the Fed pushes the taper button next month.
Overall, the dollar’s recent gains boil down to three sources: bets that the Fed will begin its rate hike campaign next year, investors searching for shelter from the equity market storm, and hopes the US economy is heavily shielded from the global power crisis.
Elsewhere, the Australian dollar couldn’t capitalize on the greenback’s retreat, ahead of an RBA meeting early on Tuesday that could see the central bank adopt a more cautious tone to reflect the growing risks surrounding China and the global economy.
Meanwhile, gold prices are back under pressure as the new week gets underway, with a rebound in real US yields overpowering the pullback in the dollar.
OPEC holds the keys
With global energy markets going berserk, investors are waiting with bated breath to see whether OPEC and its allies will take action to soften the blow to the global economy. Natural gas and coal prices have gone through the stratosphere amid painful supply shortages, which has inevitably spilled over into oil prices as well.
The current deal is that OPEC+ will steadily increase its daily production by 400k barrels each month, but some reports suggest the producers could frontload that, releasing 800k barrels in November for example and then nothing in December.
Admittedly, that’s just a drop in the ocean - it wouldn’t have any material or long-lasting impact against the global energy shortage. If that’s all OPEC comes up with, or worse yet if the cartel does nothing at all, the upward pressure on oil prices could return with a vengeance.
Technically, WTI needs to pierce above $77 per barrel for buying momentum to accelerate, as that would mark a fresh 7-year high.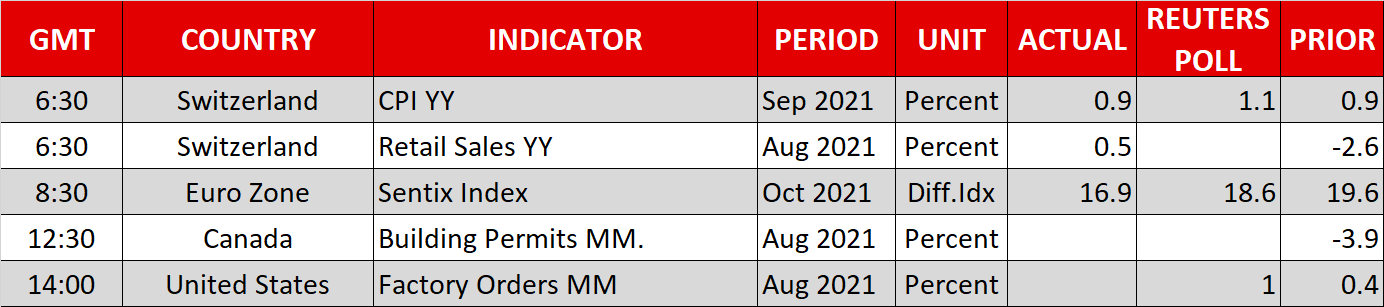
The Analytical Overview Of The Main Currency Pairs
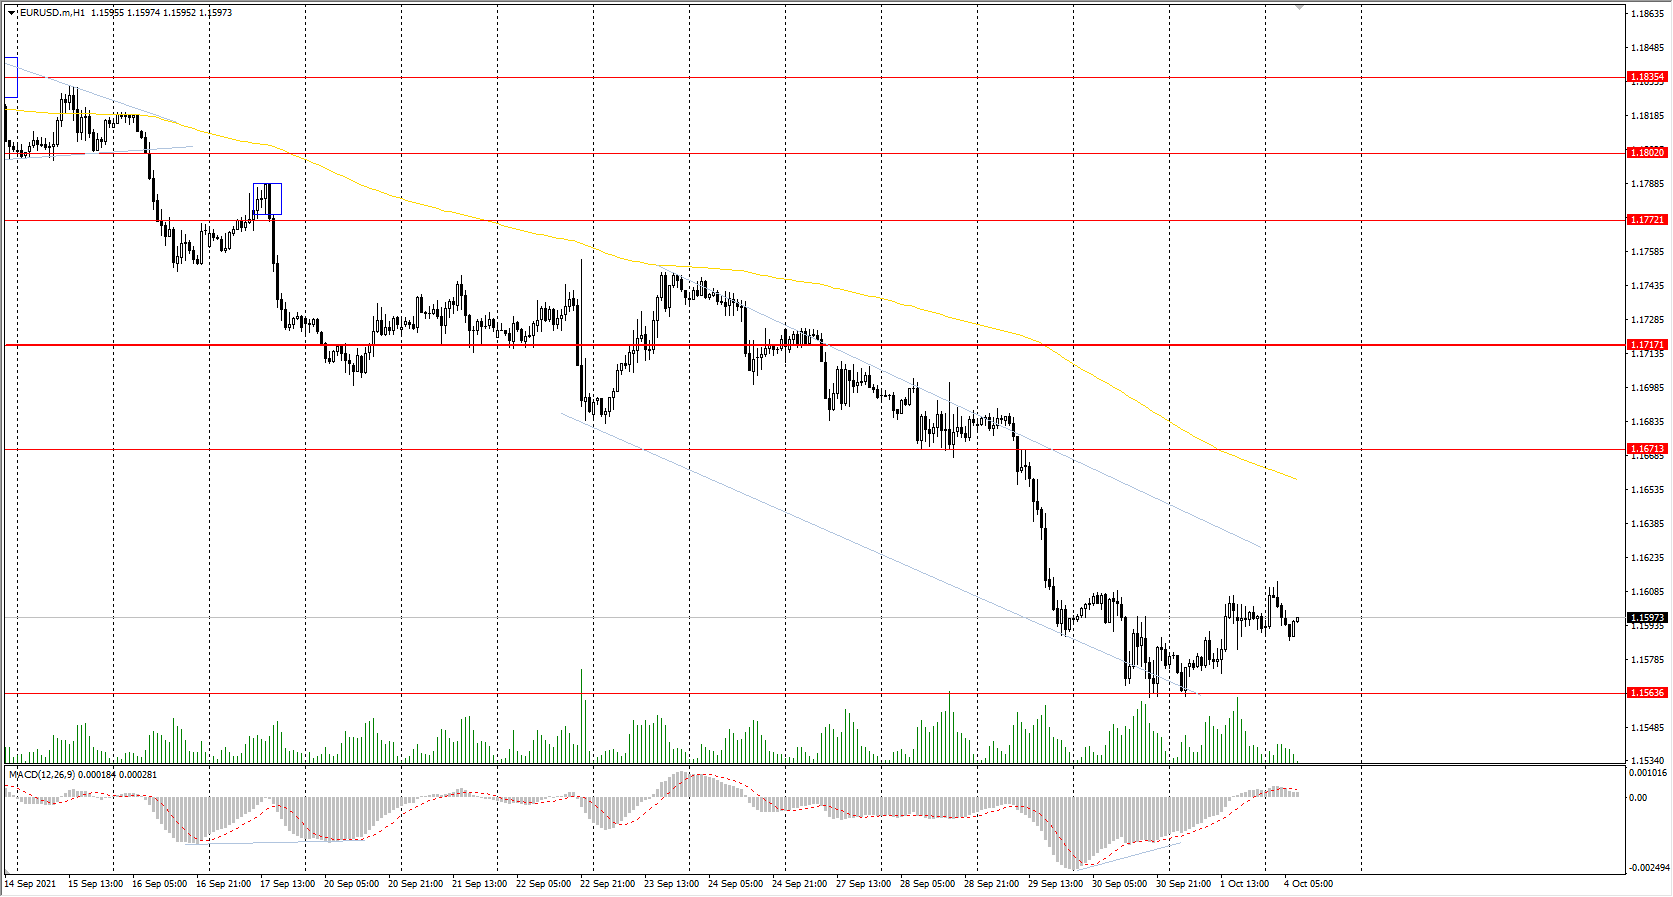
The EUR/USD currency pair
Technical indicators of the currency pair:
Prev Open: 1.1576
Prev Close: 1.1593
% chg. over the last day: +0.14%
Against the background of a sharp rise in energy prices, inflation in the Eurozone jumped to 3.4%, reaching its highest level in 13 years. Because of the rise in inflation, workers in Germany started to strike and demand higher wages to cover the price increases.
Trading recommendations
Support levels: 1.1564, 1.1453
Resistance levels: 1.1671, 1.1717, 1.1772, 1.1802, 1.1835
From the technical point of view, the EUR/USD trend is bearish. But the MACD indicator has become inactive. It indicates that the sellers have stopped putting pressure. Under such market conditions, traders should consider sell deals from the resistance levels near the moving average, as the price has deviated from the middle line. Buy trades should be considered only from the support levels with additional confirmation in the form of a buyers' initiative.
Alternative scenario: if the price breaks out through the 1.1717 resistance level and fixes above, the mid-term uptrend will likely resume.
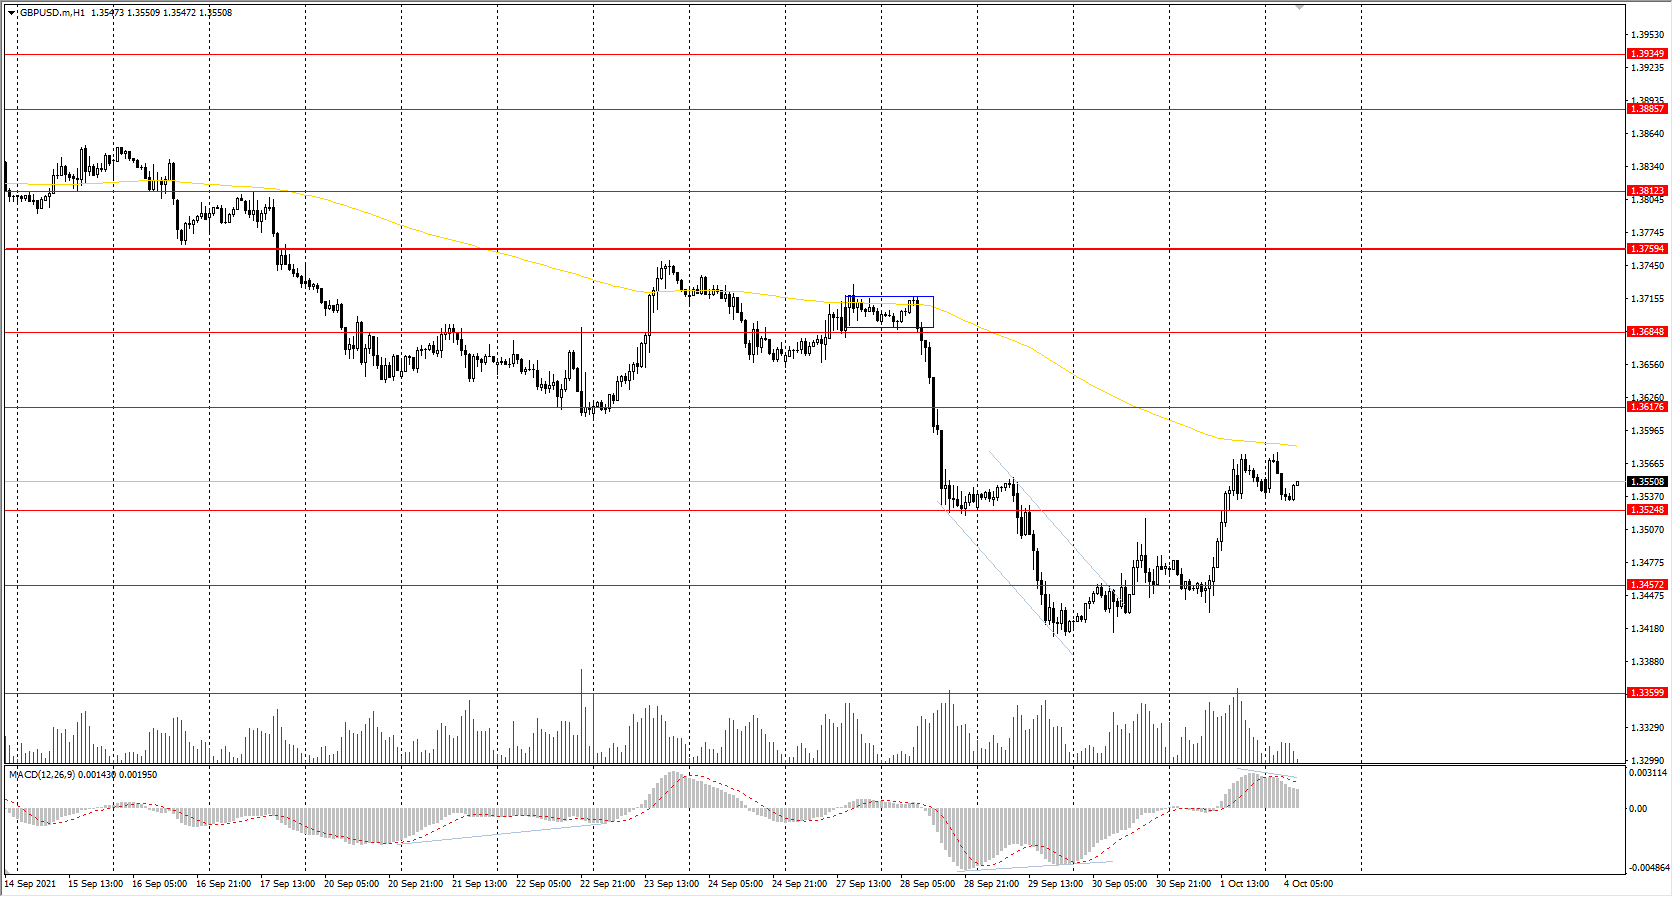
The GBP/USD currency pair
Technical indicators of the currency pair:
Prev Open: 1.3472
Prev Close: 1.3543
% chg. over the last day: +0.53%
In the UK, the manufacturing PMI index unexpectedly increased to 57.1 value (previously 56.3). The UK plans to resume fuel deliveries across the country starting from Monday. Leaders in Scotland, Wales and Northern Ireland have asked the government not to cut the social benefits. This program involves paying £20 a week to about 5.5 million families.
Trading recommendations
Support levels: 1.3525, 1.3457, 1.3360, 1.3282
Resistance levels: 1.3617, 1.3685, 1.3759, 1.3812, 1.3886
On the hourly time frame, the GBP/USD trend is bearish. But the British currency sharply strengthened on Friday. The MACD indicator has become positive. Buy trades should be considered only throughout the day and only with short targets from the support levels after the buyer’s initiative. Sell trades can be found at the resistance levels near the moving average line.
Alternative scenario: if the price breaks out through the 1.3759 resistance level and consolidates above, the bullish scenario will likely resume.
The USD/JPY currency pair
Technical indicators of the currency pair:
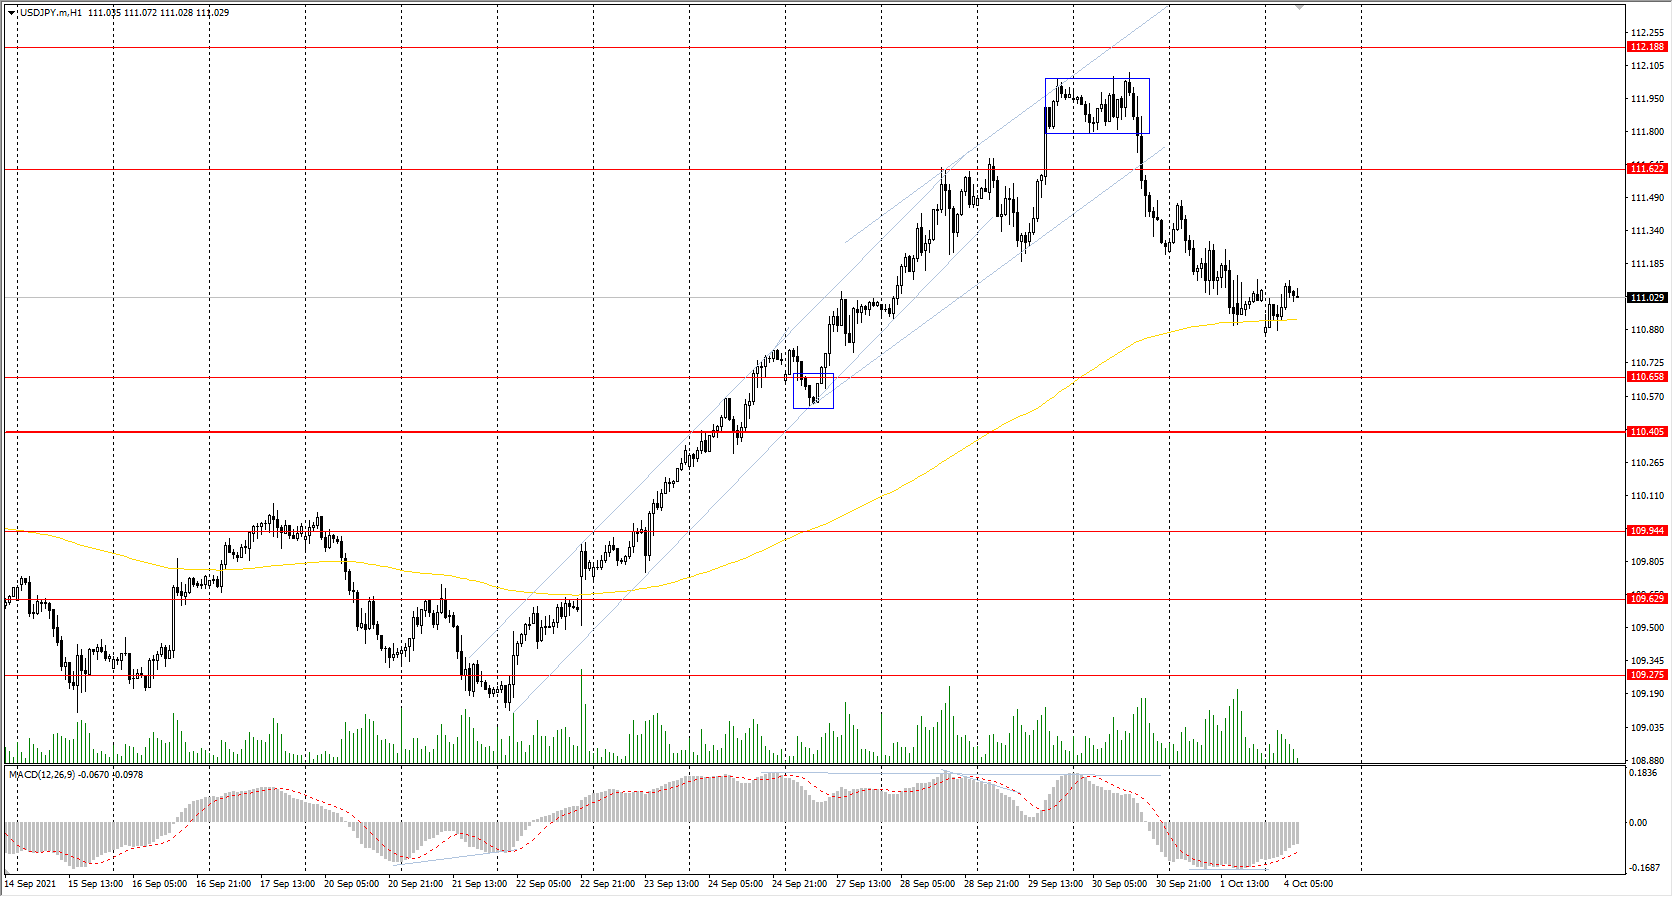
Prev Open: 111.24
Prev Close: 111.06
% chg. over the last day: -0.16%
Amid the ongoing economic recovery, the Tankan Index, which measures confidence in Japan's economy among large companies, increased to its highest level in almost three years in July-September.
Trading recommendations
Support levels: 110.65, 110.40, 109.95, 109.63, 109.27
Resistance levels: 111.62, 112.19
The main trend of the USD/JPY currency pair is bullish. The MACD indicator became negative, but there are signs of divergence. Under such market conditions, it’s better to look for buy positions from the support levels near the moving average. Sell positions should be considered only throughout the day from the resistance levels, given there is sellers' initiative.
Alternative scenario: if the price falls below 110.45, the uptrend is likely to be broken.
The USD/CAD currency pair
Technical indicators of the currency pair:
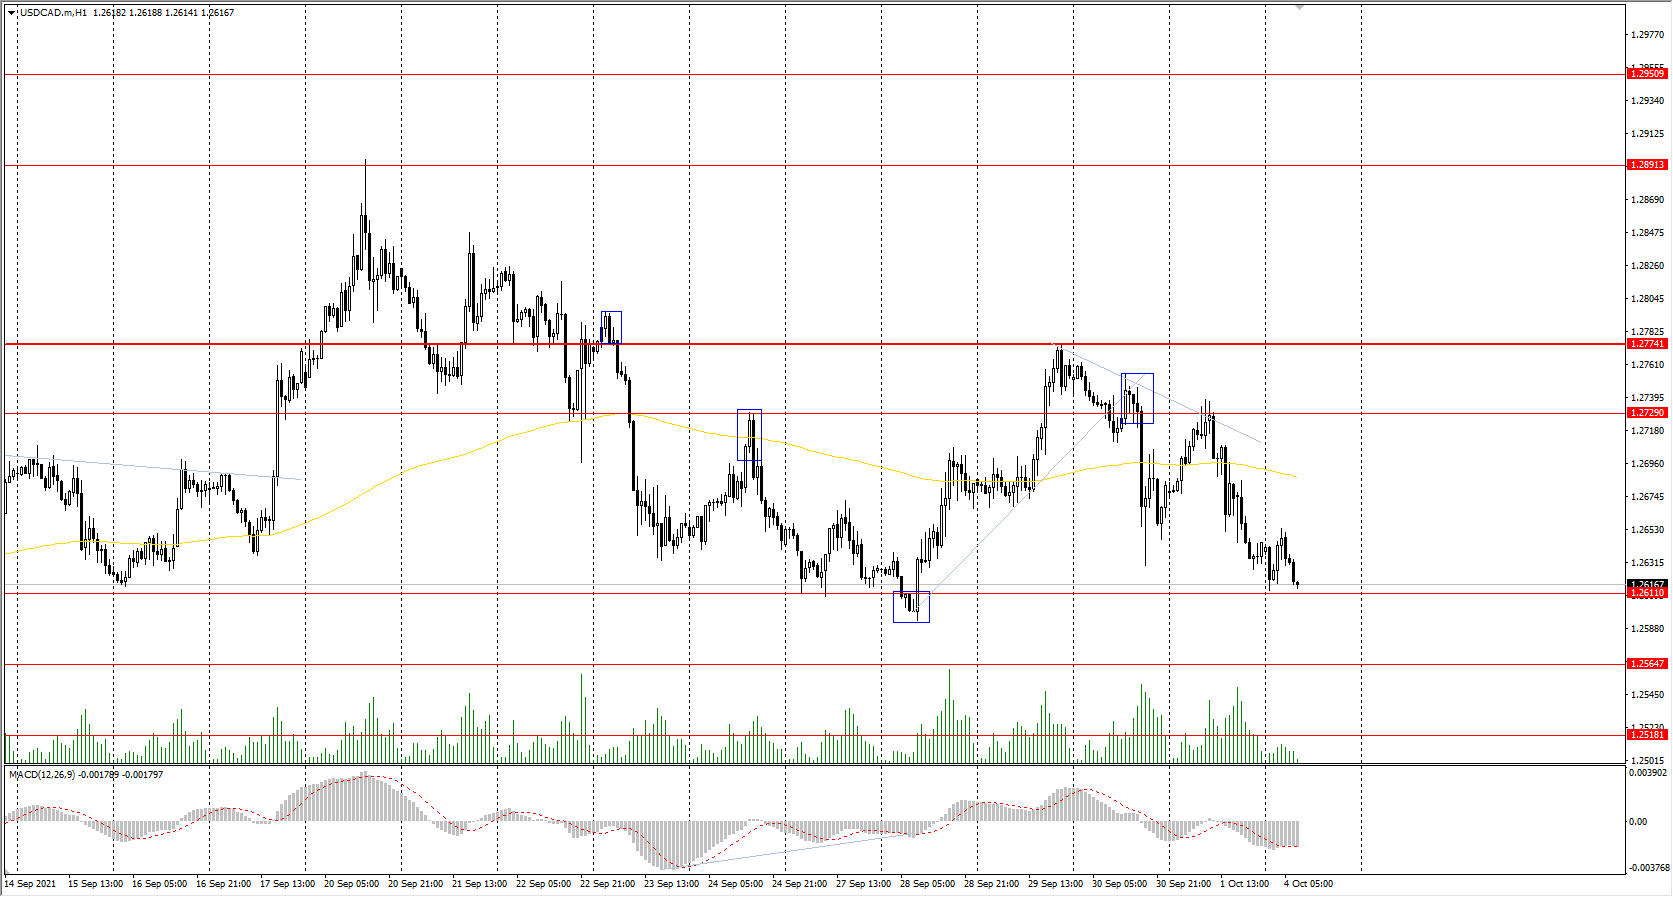
Prev Open: 1.2677
Prev Close: 1.2645
% chg. over the last day: -0.25%
The Canadian dollar is a commodity currency, so USD/CAD is highly dependent on the dynamics of the dollar index and oil prices. The dollar index remained at the same level on Friday while oil prices increased. As a result, the USD/CAD quotes decreased due to the strengthening of the Canadian currency. Canada's GDP fell by 0.1% in July. Growth is expected in August.
Trading recommendations
Support levels: 1.2611, 1.2565, 1.2518, 1.2425
Resistance levels: 1.2729, 1.2774, 1.2891
From the technical point of view, the trend of the USD/CAD currency pair is bearish. The MACD indicator has become negative, and there are signs of sellers' pressure. Under such market conditions, it is better to look for sell deals from the resistance levels after the seller’s initiative in the form of impulse movement. Buy trades should be considered from the support levels, but only with short targets.
Alternative scenario: if the price breaks out through the 1.2774 resistance level and fixes above, the uptrend will likely resume.
News feed for 2021.10.04:
- OPEC+ Meeting at 13:00 (GMT+3).
The Energy Crisis In Europe And Asia Continues. OPEC Meeting Is In The Spotlight Today
The US stock market closed Friday with confident growth, but the main indices were left in the red zone at the end of the week. Dow Jones Industrial Average increased by 1.43% on Friday (-1.19% for the week), S&P 500 added 1.15% (-1.92% for the week), Nasdaq increased by 0.82% (-2.59% for the week).
The news of the success of Merck's COVID-19 antiviral pill is putting significant pressure on the quotes of vaccine manufacturers and other pharmaceutical companies that are involved in the production of the COVID-19 drug. On Friday, shares of Moderna, Novavax, and BioNTech suffered the most. Pfizer and Johnson&Johnson were not significantly affected. Asian pharmaceutical companies that are part of the Hang Seng Index also fell on Monday because of an experimental drug from Merck.
The well-known Kathy Wood fund showed record quarterly capital outflows. Meanwhile, the outflows continued for the second quarter in a row.
Western European stock markets opened the first trading session of October with a decline. Investors are analyzing statistical data that indicate accelerating inflation and slowing economic recovery in the region. Against the background of rising inflation in Germany, workers started to strike, demanding higher wages to cover the price increases. Amid a surge in energy prices, inflation in the Eurozone jumped to 3.4%, its highest level in 13 years. On Friday, the composite index of the largest companies in the region Stoxx Europe 600 fell by 0.42% (-2.49% for the week), British FTSE 100 decreased by 0.84% (-0.35% for the week), German DAX lost 0.68% (-3.46% for the week), French CAC 40 decreased by 0.04% (-2.49% for the week). Italian FTSE MIB decreased by 0.27% (-1.87% for the week), while Spanish IBEX 35 increased by 0.04% but still declined on a weekly basis (-1.41%).
The energy crisis in Europe continues. A German coal-fired power plant was forced to shut down last week after it ran out of coal. Last week saw new fuel price records in Europe as energy companies rushed to replenish supplies ahead of the northern hemisphere winter, while alternative fuels such as coal are also in short supply. There is a huge risk that rising energy prices in Europe will lead to further plant closures. Analysts at the Bank of America have lowered the outlook for European stocks and expect them to fall by nearly 10% by the end of the year amid worsening macroeconomic situation.
Oil fluctuates around $75-76 amid increasing OPEC+ production. The OPEC+ meeting will take place today. The organization may increase the size of its planned production in order to soften concerns about the oil supply in the market. A surge in production could temporarily lower oil prices or at least suspend the growth.
There was a pipeline leak in the US. More than 3,000 barrels of oil spilled into the Pacific Ocean in California due to a leak in an Amplify Energy pipeline.
Asian stock markets ended Friday's trading in the red zone. Japan's Nikkei 225 index fell by 2.31 % on Friday, to its lowest level in nearly a month. At the same time, the market was not supported by positive statistics. Over the past week, Nikkei 225 lost 4.9%. South Korea's Kospi index decreased by 1.62%, to its lowest value in more than six months. At the end of the week, Kospi lost 3.28%. The Australian ASX 200 decreased by 2% over the day to its lowest level in four months. The ASX 200 ended the week -2.1%.
Despite a 0.43% rise in China's national CSI 300 stock index at the end of the week, analysts expect a worse quarter as Beijing's crackdown on private enterprises, China Evergrande Group's debt crisis, and nationwide power outages negatively affect stocks. There is "Golden Week" in China in honor of the National Day holiday, so traders will have time to evaluate further prospects.
Chinese real estate developer Evergrande has resumed 46 suspended real estate projects. Meanwhile, Evergrande again failed to pay interest on its debt securities to foreign investors last week. The Hong Kong Stock Exchange suspended Evergrande shares trading on Monday.
Main market quotes:
- S&P 500 (F) 4,357.04 +49.50 (+1.15%)
- Dow Jones 34,326.46 +482.54 (+1.43%)
- DAX 15,156.44 −104.25 (−0.68%)
- FTSE 100 7,027.07 −59.35 (−0.84%)
- USD Index 94.07 −0.16 (−0.17%)
Important events for today:
- Switzerland Consumer Price Index at 09:30 (GMT+3);
- OPEC+ Meeting at 13:00 (GMT+3).
Gold’s Bearish Tone Endures As Price Hike Falters
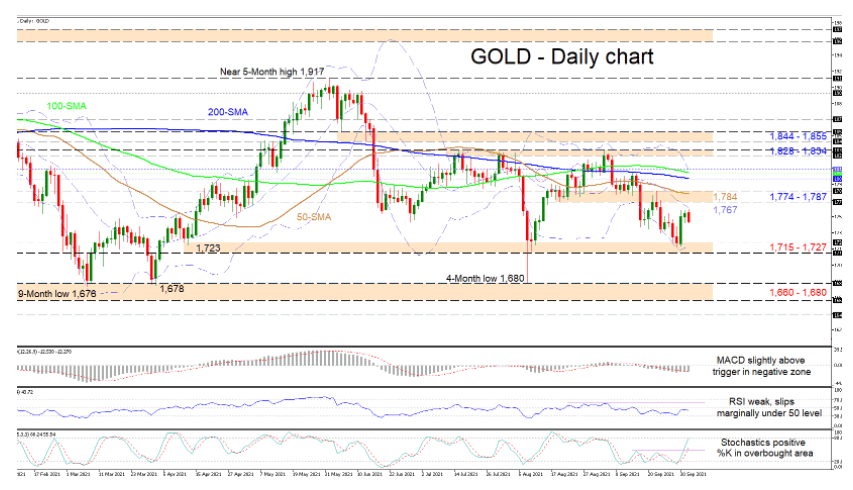
Gold's recent bullish pressures have been muted around the mid-Bollinger band at 1,767 and downward forces are keeping the bearish outlook in play. The trendless simple moving averages (SMAs) are not clearly endorsing a definitive direction, but their marginal dipping indicates a slight preference in the price to adopt a downward trajectory.
The short-term oscillators are conveying mixed signals in directional impetus. The MACD, in the negative region, has nudged a tad above its red trigger line, while the faltering RSI is struggling to push into bullish territory. The stochastic oscillator continues to promote bullish price action and has yet to confirm that sellers are gaining an advantage.
If downside defences keep buyers at bay, the price may dive to test the initial support band of 1,715-1,727, reinforced by the lower Bollinger band. Should selling interest intensify, the price may sink to challenge the support foundation of 1,660-1,680, which has held since April 2020.
If buyers manage to retake the reins, prompt upside friction could emanate from the mid-Bollinger band at 1,767 before buyers face the resistance section of 1,774-1,787. Piloting over the 50-day SMA and the 1,787 high, the bulls may encounter a zone of resistance between the 200-day SMA at 1,801 and the upper Bollinger band at 1,812. Surpassing all SMAs, the pair may target the resistance ceiling of 1,828-1,834. Conquering this too could cheer buyers to then propel towards the 1,844-1,855 border.
Summarizing, in the short-term timeframe, gold is exhibiting a slight neutral-to-bearish bias. It appears bearish forces are gaining a lead but a break either below 1,715 or above 1,834 would be needed for a stronger directional price path to evolve.
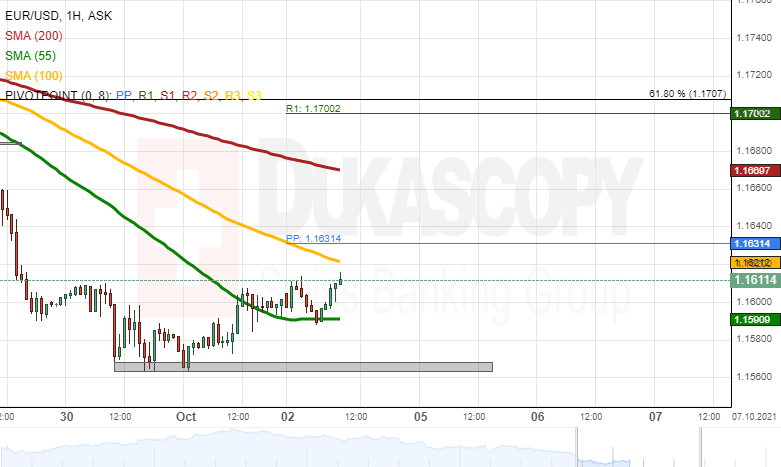
EUR/USD Analysis: Reaches Above 1.1600
The EUR/USD currency exchange rate on Monday morning found support in the 55-hour simple moving average at 1.1590 and surged. Moreover, the resistance of the 1.1600 level was ignored.
In the case that the rate continues to surge, it would most likely encounter the resistance of 100-hour simple moving average near 1.1620, the weekly simple pivot point at 1.1631. Above these levels, the 200-hour SMA at 1.1670 might serve as resistance.
However, a decline of the pair would look for support in the 55-hour SMA at 1.1590. If the SMA fails to keep the pair up, the rate could look for support in the previous week's low levels at 1.1563/1.1568.
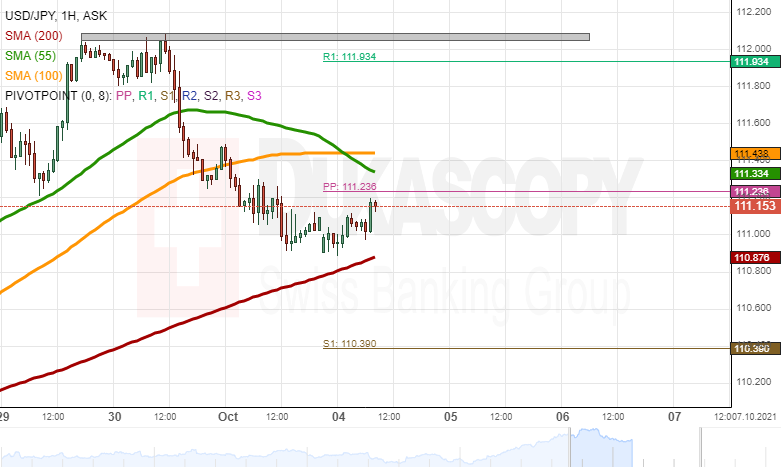
USD/JPY Analysis: Decline Reaches 111.00
The bounce off from the 112.00 mark has turned into a proper decline, as on Friday the USD/JPY currency exchange rate reached the 111.00 level.
On Monday, the rate had paused the decline, as the support of the 200-hour SMA was approaching the pair. Meanwhile, resistance levels were spread out from 111.24 to 111.44. In the near term future, a squeeze between support and resistance levels was expected.
If the pair breaks out to the upside, it would have to break the resistance of the weekly simple pivot point at 111.24, the 55-hour SMA at 111.34 and the 100-hour SMA at 111.44. Above these levels, the weekly R1 at 111.93 might serve as resistance.
However, a decline below the 200-hour SMA might result in the USD/JPY reaching the support of the weekly S1 simple pivot point at 110.39.
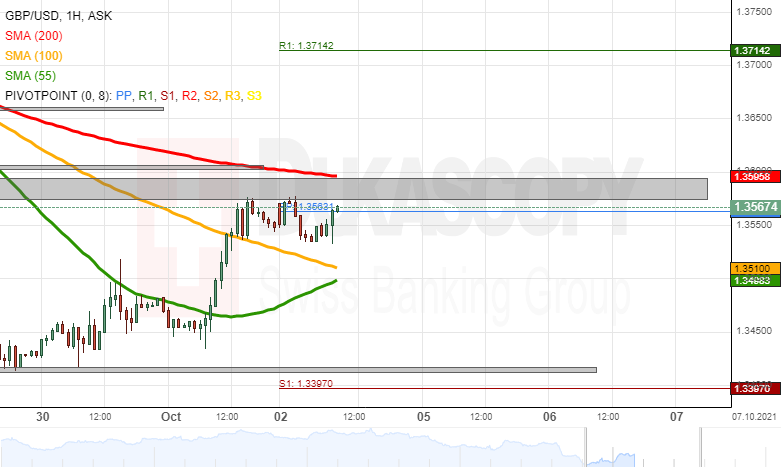
GBP/USD Analysis: Finds Resistance In July Low
The GBP/USD recovery passed the resistance of the 55-hour SMA and the 100-hour SMA on Friday. On Monday, the rate paused the surge. After a short investigation, it was discovered that the July low level zone of 1.3575/1.3790 was providing resistance.
In the meantime, the 200-hour SMA had approached and strengthened the resistance zone. In addition, the 55 and 100-hour SMAs were heading to the 1.3500 mark.
If the currency pair surges, it would have to pass the resistance of the 1.3575/1.3790 zone and the 200-hour simple moving average. Above these resistance levels, the pair could find resistance at 1.3650, 1.3700 before reaching for the weekly R1 simple pivot point at 1.3714.
On the other hand, a decline of the pair would look for support in the combination of the 55 and 100-hour SMAs near 1.3500. Below the 1.3500 mark, the rate could look for support in the previous week's low levels near 1.3410/1.3415.
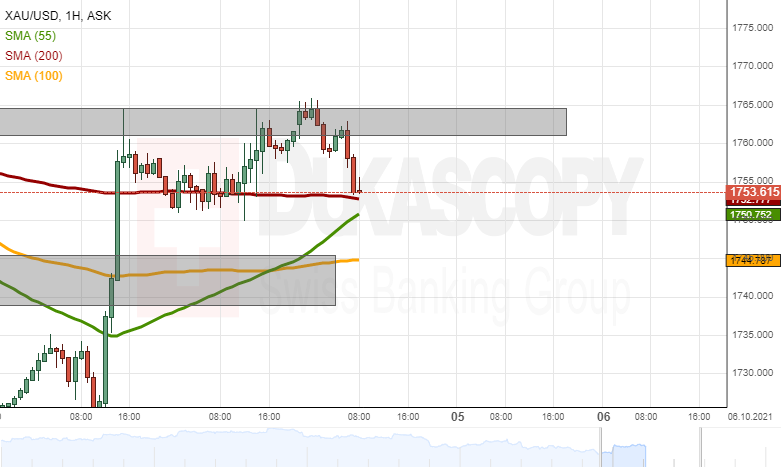
Gold Analysis: Tests High Zone
Since September 30, the yellow metal's price has been testing the resistance of the last week high zone at 1,761.10/1,765.00. Meanwhile, support is being provided by the 55 and 200-hour simple moving averages and the 1,750.00 mark.
If the price passes the resistance of the recent high levels, the metal could aim at the 1,800.00 level. However, the 1,780.00 and 1,785.00 levels might keep gold down, as it occurred in September.
Meanwhile, a decline would have to pass the 55 and 200-hour SMAs and the 1,750.00 level before aiming at the 100-hour SMA at 1,745.00.
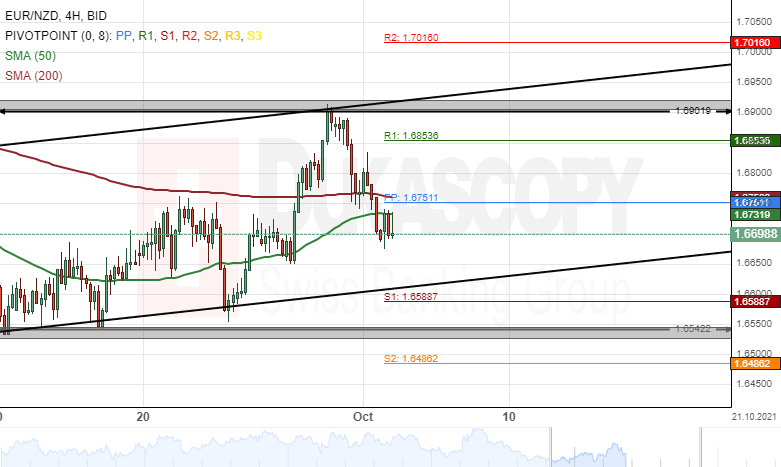
EUR/NZD Decline Could Continue
The common European currency declined by 1.30% against the New Zealand Dollar last week. The currency pair breached the 50– and 200– period SMAs during Friday's trading sessions.
All things being equal, the exchange rate could continue to edge lower during the following trading sessions. The potential target for sellers would be near the 1.6550 area.
However, the lower boundary of an ascending channel pattern at 1.6600 could provide support for the EUR/NZD currency exchange rate this week.