

Sample Category Title
Aussie Soft after Uneventful RBA, Dollar Recovering after Brief Selloff
Dollar is regaining some ground in Asian session today, as yesterday's selloff was relatively well contained so far. Sterling is also recovering, together with Euro, against others. On the other hand, Australian Dollar turns softer after uneventful RBA rate decision. Other commodity currencies are also weak. Overall markets will turn to ISM services for guidance on next move.
Technically, there is no overwhelming indication of a near term bearish reversal in Dollar. EUR/USD is holding below 1.1682 minor resistance, AUD/USD below 0.7315 minor resistance, USD/CHF above 0.9214 support, USD/JPY above 110.44 support. GBP/USD's break of 1.3608 resistance is also not clean. As long as these levels hold, Dollar buying is more likely to come back in the near term than not.
In Asia, at the time of writing, Nikkei is down -2.32%. Hong Kong HSI is up 0.32%. Singapore Strait Times is down -0.77%. Japan 10-year JGB yield is up 0.0046 at 0.056. China is still on holiday. Overnight, DOW dropped -0.94%. S&P 500 dropped -1.30%. NASDAQ dropped -2.14%. 10-year yield rose 0.016 to 1.481.
RBA keeps rate at 0.10%, continue QE until at least Feb 2022
RBA left monetary policy unchanged as widely expected. Cash rate is kept at 0.10%. Target for April 2024 Australian Government bond yield is also held at 0.10%. The asset purchase program will continue at AUD 4B per week until at least mid February 2022. RBA also maintained that the condition for rate hike "will not be met before 2024".
It maintained that the set back to economy expansion by the Delta outbreak is "expected to be only temporary". In the central scenario, the economy will be growing again in Q4, and is expected to be "back around its pre-Delta path in the second half of next year".
On labor market, RBA said it's business liaison and job vacancies data suggest that "many firms are seeking to hire workers ahead of the expected reopening in October and November." Wage and price pressures remain "subdued" and disruption to global supply chains on overall inflation "remains limited".
Australia trade surplus swelled to another record in Aug
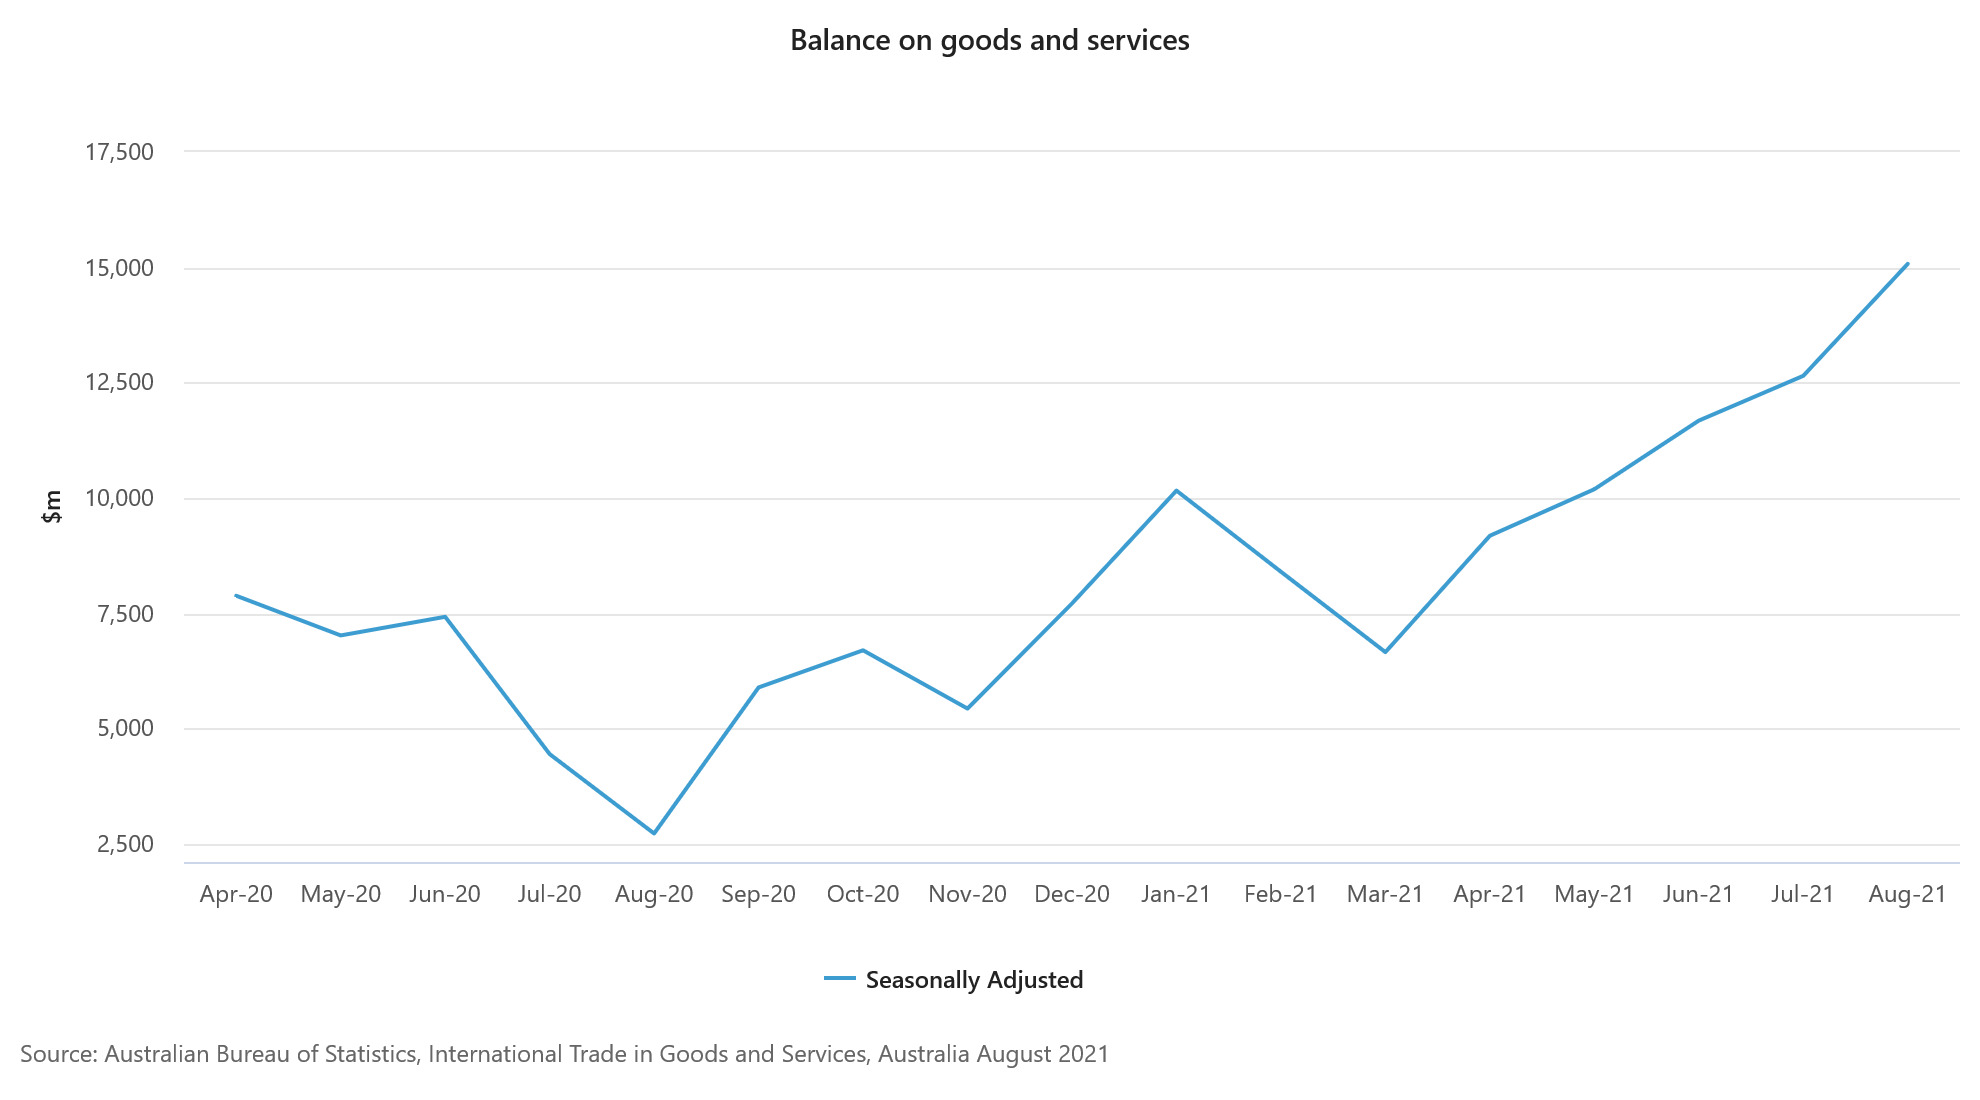
Australia goods and services exports rose AUD 1923m or 4% mom to AUD 48.52B in August. The surge in exports was led by LNG, hard coking coal and thermal coal, on both higher prices and volumes. Goods and services imports dropped AUD -506m or 1% mom to AUD 33.44B. Trade surplus rose from AUD 12.65B to AUD 15.08B, above expectation of AUD 10.10B, and hit another record high.
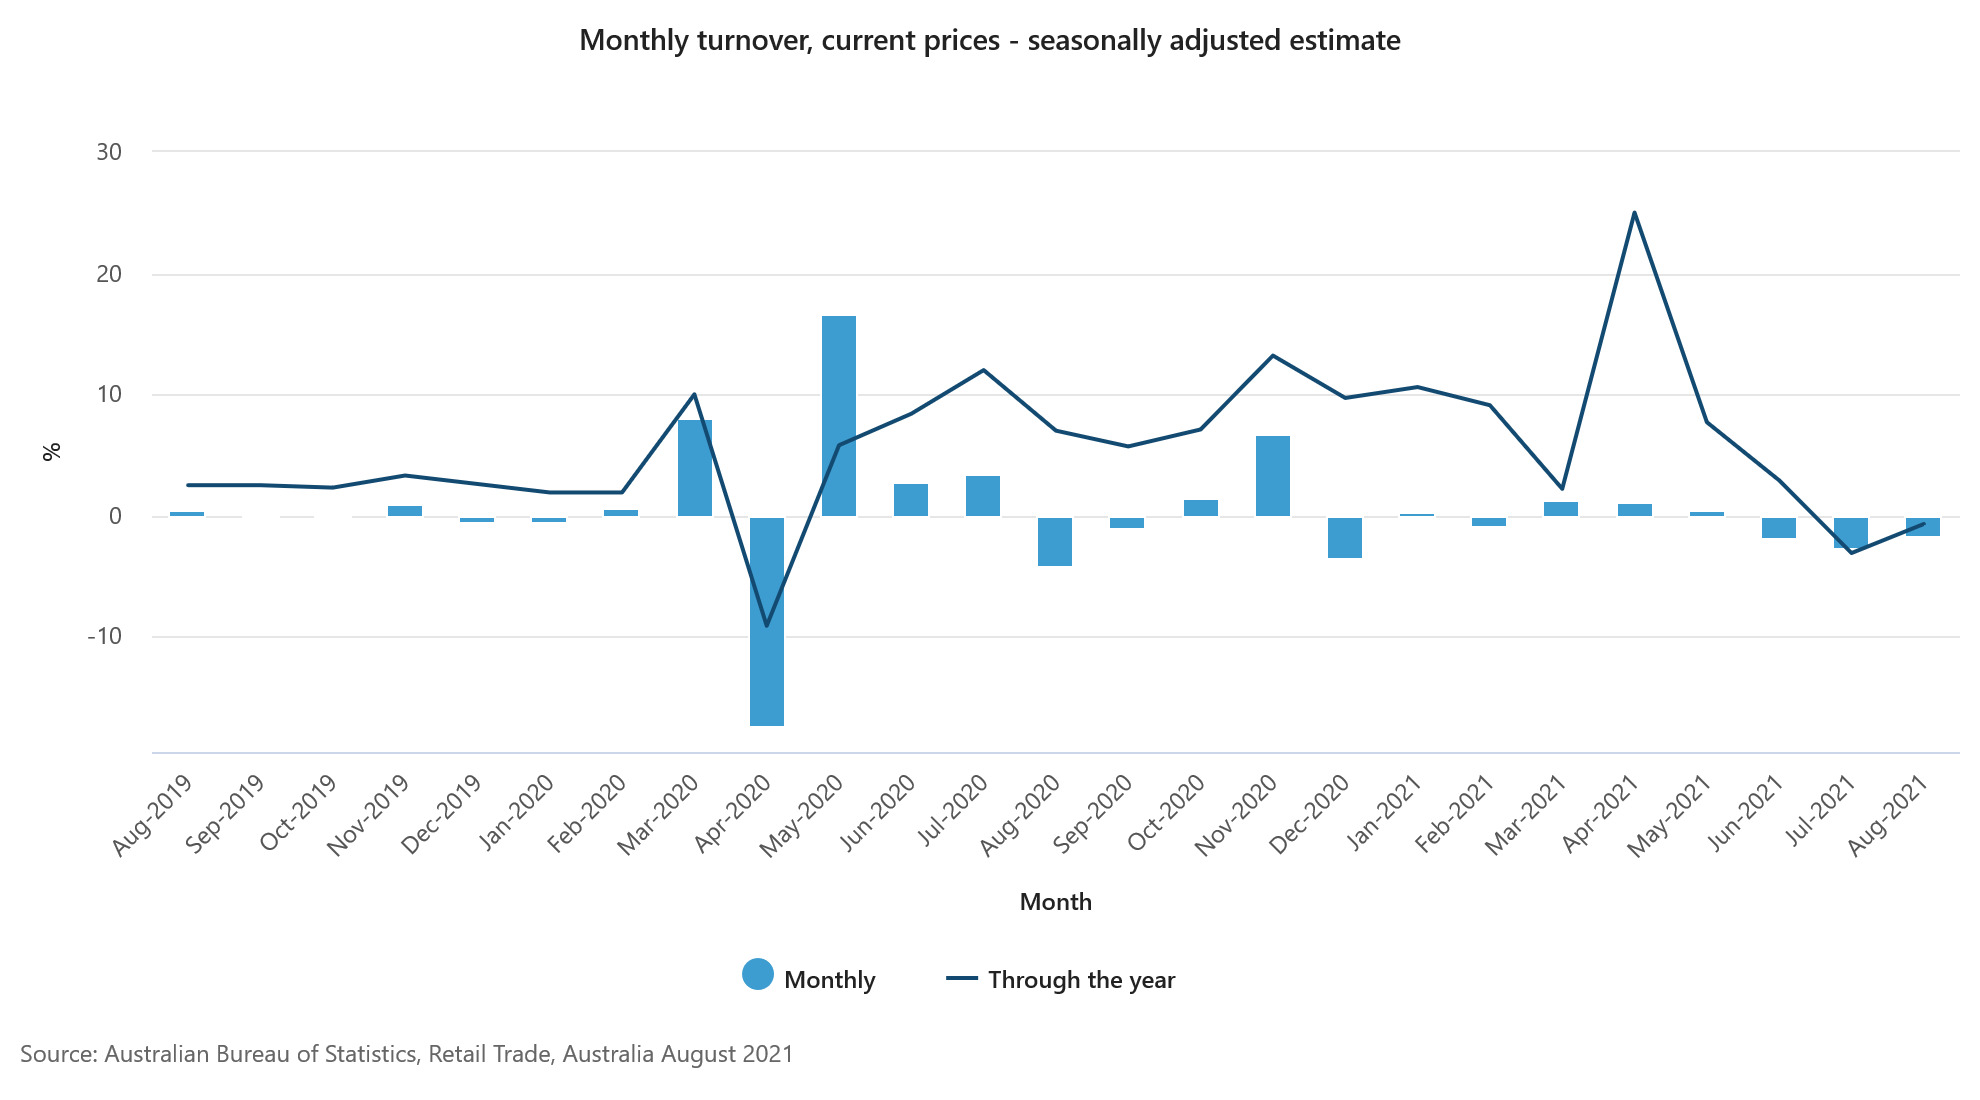
Also released, retail sales dropped -1.7% mom, -0.7% yoy in August. Ben James, Director of Quarterly Economy Wide Surveys, said: "Retail turnover continues to be negatively impacted by lockdown restrictions, with each of the eastern mainland states experiencing falls in line with their respective level of restrictions. In direct contrast, states with no lockdowns performed well with Western Australia and South Australia enjoying strong rises as physical stores were open for trade."
AiG Performance of Construction Index rose sharply from 38.4 to 53.3 in September. Ai Group Head of Policy, Peter Burn, said: "The bounce in the Australian PCI in September was largely due to many fewer builders and constructors reporting further falls in activity after the clear majority saw activity slump in August... Looking ahead, the further easing of restrictions, and the resumption of work put on hold should see more decisive improvement in the sector in the months ahead".
Japan PMI services composite finalized at 47.9, but firms optimist on eventual end to pandemic
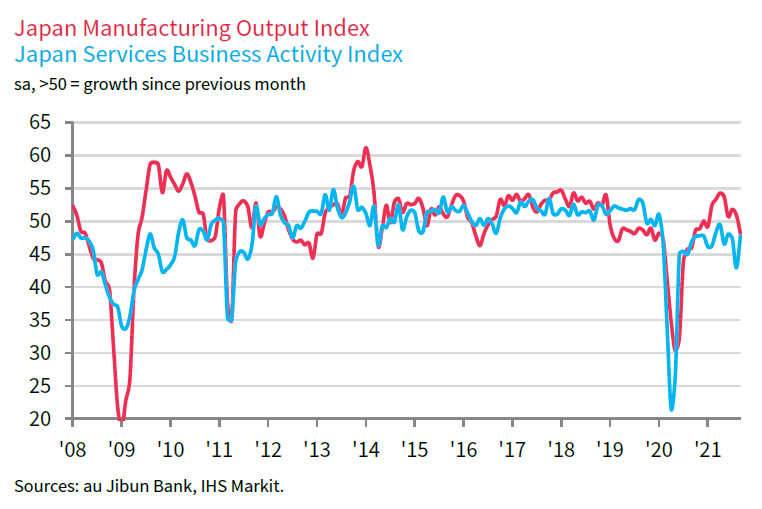
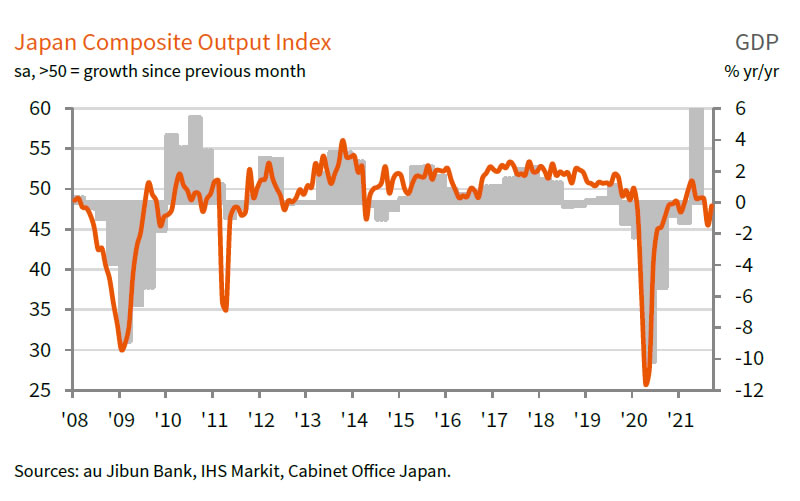
Japan PMI Services was finalized at 47.8 in September, up from August's 42.9. PMI Composite was finalized at 47.9, up from August's 45.5. Markit said contractions in output and new business eased. Employment rose at quickest pace since April. Business optimism also strengthened to three-month high.
Usamah Bhatti, Economist at IHS Markit, said: "Overall private sector activity saw a sustained, albeit softer decline in September, led by a slower decline in the larger service sector. At the same time, manufacturing output and new orders were both in decline for the first time since late-2020.
"Businesses in the Japanese private sector also noted the strongest cost pressures for 13 years, as supply chain disruption continued to dampen domestic and global activity. Price rises were notably sharp for raw materials, staff and fuel. Regardless of this, firms were optimistic that an eventual end to the pandemic would occur within the coming 12 months, and provide a broad-based boost to demand and activity. As a result, IHS Markit expects the economy to grow 2.5% in 2021."
Also from Japan, Tokyo CPI core rose to 0.1% yoy in September, up from 0.0% yoy, missed expectation of 0.2% yoy.
NASDAQ at a technical juncture after selloff
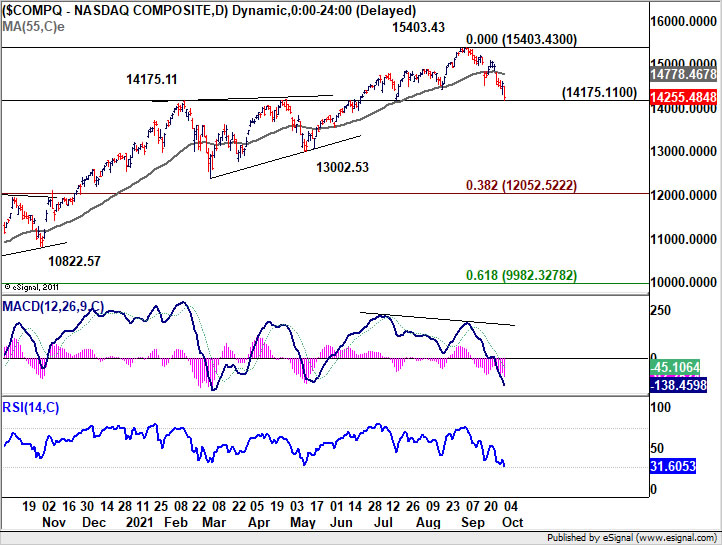
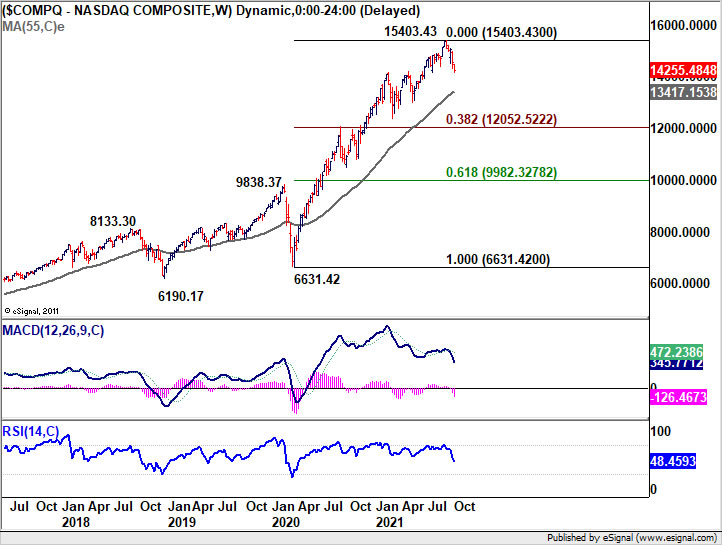
NASDAQ is now pressing key support level at 14175.11 after yesterday's -2.41% decline, and it's now at a technical juncture. Strong rebound from current level, followed by break of 55 day EMA (now at 14778.46) will maintain medium term bullishness. In this case, a break of 15403.43 record high is more likely before having a larger scale correction.
However, sustained break of 14175.11 will suggest that NASDAQ is already in correction to whole up trend from 6631.42. In this case, deeper fall would be seen to 55 week EMA (now at 134174.13), or even further to 38.2% retracement of 6631.42 to 15403.43 at 12052.52 before completing the correction. If happens, bearish sentiment would likely persist throughout Q4.
Looking ahead
France industrial output, Eurozone PMI services final and PPI, UK PMI services final will be released in European session. Later in the day, Canada and US will release trade balance. But main focus will be on ISM services.
AUD/USD Daily Report
Daily Pivots: (S1) 0.7259; (P) 0.7281; (R1) 0.7312; More...
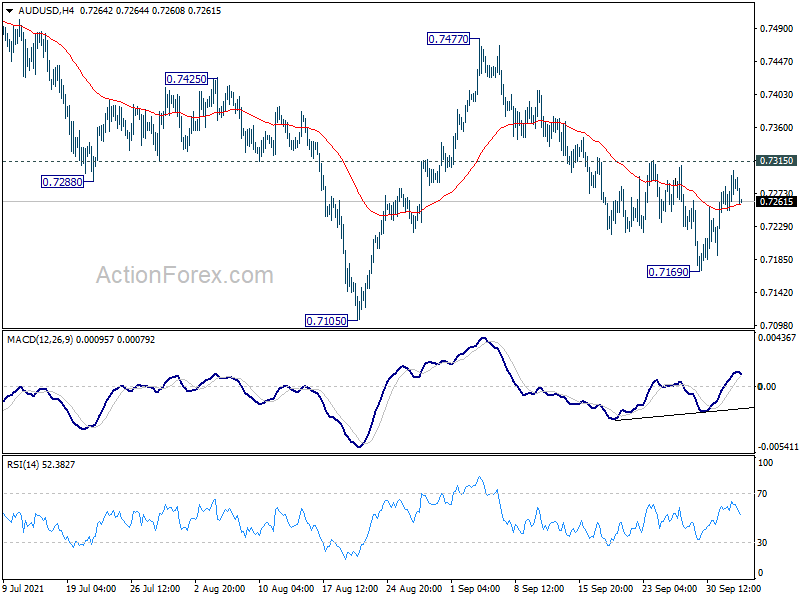
Intraday bias in AUD/USD remains neutral and further fall is mildly in favor with 0.7315 minor resistance intact. n the downside, below 0.7169 will target a test on 0.7105 low. Firm break there will resume whole decline from 0.8006 for 0.6991 support next. On the upside, above 0.7315 minor resistance will turn bias back to the upside for 0.7477 resistance instead.
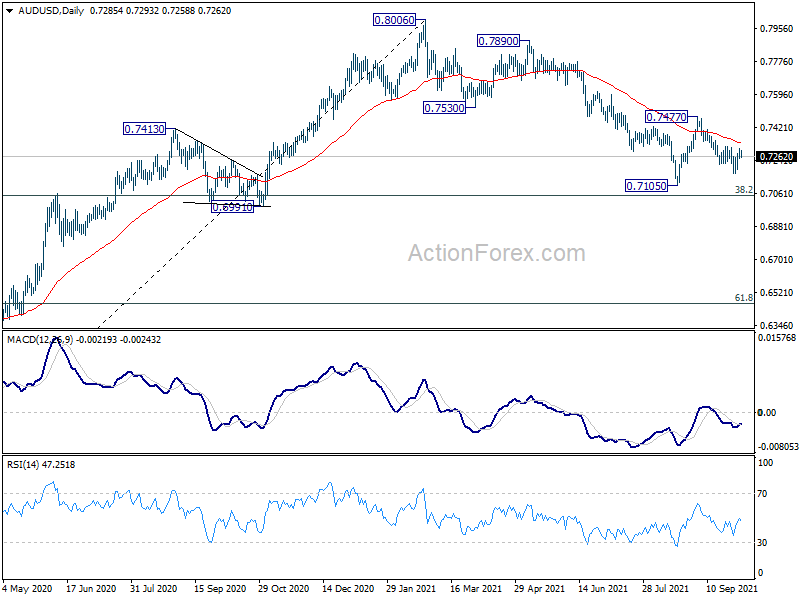
In the bigger picture, with 0.6991 cluster support (38.2% retracement of 0.5506 to 0.8006 at 0.7051) intact, we're seeing price action from 0.8006 as a correction only. That is, up trend from 0.5506 low would resume after the correction completes. In that case, main focus will be 0.8135 key resistance (2018 high). Sustained break there will carry larger bullish implications. However, sustained break of 0.6991 will argue that the whole medium term trend has indeed reversed.
Economic Indicators Update
| GMT | Ccy | Events | Actual | Forecast | Previous | Revised |
|---|---|---|---|---|---|---|
| 21:30 | AUD | AiG Performance of Construction Index Sep | 53.3 | 38.4 | ||
| 23:30 | JPY | Tokyo CPI Core Y/Y Sep | 0.10% | 0.20% | 0.00% | |
| 0:30 | AUD | Trade Balance (AUD) Aug | 15.08B | 10.10B | 12.12B | 12.69B |
| 3:30 | AUD | RBA Rate Decision | 0.10% | 0.10% | 0.10% | |
| 6:45 | EUR | France Industrial Output M/M Aug | 0.40% | 0.30% | ||
| 7:50 | EUR | France Services PMI Sep F | 56 | 56 | ||
| 7:55 | EUR | Germany Services PMI Sep F | 56 | 56 | ||
| 8:00 | EUR | Eurozone Services PMI Sep F | 56.3 | 56.3 | ||
| 8:30 | GBP | Services PMI Sep F | 54.6 | 54.6 | ||
| 9:00 | EUR | Eurozone PPI M/M Aug | 1.30% | 2.30% | ||
| 9:00 | EUR | Eurozone PPI Y/Y Aug | 13.50% | 12.10% | ||
| 12:30 | CAD | Trade Balance (CAD) Aug | 0.3B | 0.8B | ||
| 12:30 | USD | Trade Balance (USD) Aug | -70.5B | -70.1B | ||
| 13:45 | USD | Services PMI Sep F | 54.4 | 54.4 | ||
| 14:00 | USD | ISM Services PMI Sep | 59.8 | 61.7 | ||
| 14:00 | USD | ISM Services Employment Index Sep | 53.7 |
NASDAQ at a technical juncture after selloff
NASDAQ is now pressing key support level at 14175.11 after yesterday's -2.41% decline, and it's now at a technical juncture. Strong rebound from current level, followed by break of 55 day EMA (now at 14778.46) will maintain medium term bullishness. In this case, a break of 15403.43 record high is more likely before having a larger scale correction.
However, sustained break of 14175.11 will suggest that NASDAQ is already in correction to whole up trend from 6631.42. In this case, deeper fall would be seen to 55 week EMA (now at 134174.13), or even further to 38.2% retracement of 6631.42 to 15403.43 at 12052.52 before completing the correction. If happens, bearish sentiment would likely persist throughout Q4.
Japan PMI services composite finalized at 47.9, but firms optimist on eventual end to pandemic
Japan PMI Services was finalized at 47.8 in September, up from August's 42.9. PMI Composite was finalized at 47.9, up from August's 45.5. Markit said contractions in output and new business eased. Employment rose at quickest pace since April. Business optimism also strengthened to three-month high.
Usamah Bhatti, Economist at IHS Markit, said: "Overall private sector activity saw a sustained, albeit softer decline in September, led by a slower decline in the larger service sector. At the same time, manufacturing output and new orders were both in decline for the first time since late-2020.
"Businesses in the Japanese private sector also noted the strongest cost pressures for 13 years, as supply chain disruption continued to dampen domestic and global activity. Price rises were notably sharp for raw materials, staff and fuel. Regardless of this, firms were optimistic that an eventual end to the pandemic would occur within the coming 12 months, and provide a broad-based boost to demand and activity. As a result, IHS Markit expects the economy to grow 2.5% in 2021."
Australia trade surplus swelled to another record in Aug
Australia goods and services exports rose AUD 1923m or 4% mom to AUD 48.52B in August. The surge in exports was led by LNG, hard coking coal and thermal coal, on both higher prices and volumes. Goods and services imports dropped AUD -506m or 1% mom to AUD 33.44B. Trade surplus rose from AUD 12.65B to AUD 15.08B, above expectation of AUD 10.10B, and hit another record high.
Also released, retail sales dropped -1.7% mom, -0.7% yoy in August. Ben James, Director of Quarterly Economy Wide Surveys, said: "Retail turnover continues to be negatively impacted by lockdown restrictions, with each of the eastern mainland states experiencing falls in line with their respective level of restrictions. In direct contrast, states with no lockdowns performed well with Western Australia and South Australia enjoying strong rises as physical stores were open for trade."
AiG Performance of Construction Index rose sharply from 38.4 to 53.3 in September. Ai Group Head of Policy, Peter Burn, said: "The bounce in the Australian PCI in September was largely due to many fewer builders and constructors reporting further falls in activity after the clear majority saw activity slump in August... Looking ahead, the further easing of restrictions, and the resumption of work put on hold should see more decisive improvement in the sector in the months ahead".
Bond Rates Moving Towards Realistic Levels
Prospects for the unwinding of QE in the US and Australia in 2022 are finally lifting bond rates. The FOMC looks likely to have unwound its current QE program by mid 2022 along with the RBA. These forces along with prospects of rising overnight rates will see even higher bond rates.
The Reserve Bank Board meets later today at 2:30 pm.
The Board is certain not to announce any policy change.
It has committed to reviewing its quantitative easing program at the February 1 Board meeting in 2022.
Until then it will maintain its policy of weekly purchases of $4 billion of AGS ($3.2 billion) and state and local bonds ($0.8 billion).
Last month we thought that the Board would respond to the likelihood that the Australian economy was going to contract quite sharply in the September quarter and lift its purchases of bonds to $6 billion – certainly, at the very least, defer the taper of the weekly purchases from $5 billion to $4 billion which had been announced in July and confirmed in August. We expected that there would be a review of the program in November with a significant likely reduction once the reopening of the NSW and Victoria was underway.
The decision to maintain the taper was confirmed in September but there was a compromise. There was a deferral of any review until February.
We expect that the economy will expand by 5% in the first half of 2022 allowing the Bank to further scale back its weekly purchases to $2–3 billion.
If the decision is based on progress towards the Bank’s goals it is reasonable that a scaling back from $4 billion to $2 billion would be appropriate. But the lead from other central banks, particularly the Bank of Canada, which has steadily reduced its purchases by a standard $1 billion per month would point to a more cautious taper to $3 billion.
With little “history” around the RBA’s preferred approach to QE being available we cannot be sure whether the QE decisions will be based around an assessment of that progress or the more measured gradual approach that we have seen overseas.
On balance the “progress approach” seems more likely.
If that is the case another review in May would see the program phased out by August or, even, possibly immediately.
On the other hand sticking with the “gradual approach” of tapering by $1 billion per quarter would see the program extending to November.
Alternatively the RBA could choose a middle ground by staying with the “gradual approach” but shorten the periods between reviews.
If the pace of tapering is determined by progress in achieving the Bank’s objectives, then a May/ August cessation seems reasonable, with August seeming most likely.
The August timing coupled with a scaling back to $2 billion in purchases from February to be followed by $1 billion from May would see total purchases over the September( 2021)/ August( 2022) period of $123 billion.
That would leave a gap of around six months between the end of the QE program and the first rate hike.
Westpac’s inflation and unemployment forecasts are consistent with the Bank achieving its full employment (4% unemployment rate) and inflation forecast (2.5% underlying) by the end of 2022, setting the scene for the first rate hike of 15 basis points in the March quarter 2023.
We actually forecast an unemployment rate of 3.8% by end 2022.
We expect the FOMC to begin its hiking cycle at the December meeting next year, providing the RBA with a helpful lead while Bank of Canada and Bank of England are expecting to begin raising the policy rate sometime in the second half of 2022.
Bond rates have also finally started to rise. The US 10 year yield has lifted from around 1.30% shortly before the recent FOMC meeting to 1.46% today and while break even inflation rates have increased in Europe because of the surge in energy prices the increase in nominal yields in the US has been due to a rise in real yields.
US break even yields have held around 2.35% while the nominal yield has lifted by nearly 20 basis points. Even so, real yields remain at extreme negative levels of around minus 90 basis points.
That lift in real yields is due to some firming in the outlook for FOMC interest rate policy but more so in response to the encouragement FOMC spokesmen including Chair Powell have given to the prospects for the beginning of the taper of the FOMC’s $120 billion per month current bond purchase program.
Markets were also unsure as to the length of time the FOMC was likely to take to fully scale back purchases. The most likely estimated timing was that it would take around 6 months. Clear guidance from the Chairman and others is that a reasonable target to complete the tapering program was to the middle of 2022.
Real yields have been responsive to Quantitative Easing in the past- most notably during the “Taper Tantrum “(May/June 2013) when, expecting a wind back in QE, markets pushed real yields up by a stunning 100 bp’s over the course of a few months; or in 2018 when the FOMC began to a scale back its balance sheet and real yields lifted by around 70 basis points; finally we can point to the sharp increase in the balance sheet, including the current QE program, through 2020 where real yields tumbled over the year from 0.2% to -1.0%
So the global process of the normalisation of bond yields which usually precedes the beginning of a tightening cycle has begun.
Throughout 2021 we have held our call for US and AUD bond yields to reach at least 2% by end 2022( and 1.55%–1.60% by end 2021) despite real yields collapsing to an extraordinary minus 1.2% earlier in the year.
This bond cycle is posing some real headwinds for the RBA’s guidance that the overnight cash rate will not move until 2024.
In fact, that guidance looks more consistent with an even later timing – namely, the second half of 2024. Current RBA forecasts have the underlying inflation rate hitting 2.25% by end 2023 and moving in 0.25% increments every 6 months, implying that the “lift off” inflation rate will not be apparent until late July with a possible risk that a second print might be required pointing to the first rate hike in November 2024 – about the time we expect the FOMC and the RBA will have reached their peaks.
Finally, we know that the RBA respects the policy approach of the Bank of Canada.
The BOC has indicated that it will soon enter the reinvestment phase of QE. Even though it will not be adding to the size of its balance sheet it will purchase sufficient bonds to offset maturities in bonds it is already holding. That would see the size of the BOC balance sheet stabilise.
The BOC is noncommittal at this stage whether the reinvestment stage would continue through the rate hike period. Shrinking the balance sheet and raising rates are both forms of policy tightening.
The FOMC’s experience was that the impact of rate hikes was well understood whereas shrinking the balance sheet was unknown territory.
If we are right, the first rate hike in Australia will come just before the need for reinvestment given that the first stage of the RBA’s QE was to purchase 3 year bonds in the early stages of the Yield Curve Control policy in 2020.
However, if RBA’s forecasts are correct and the first hike is not till as late as November 2024, we will see a reinvestment phase in the current QE process in 2023 and 2024.
Under such a scenario, we would expect the RBA to fully invest maturing bonds – thereby keeping the size of the balance sheet stable.
Conclusion
The September FOMC meeting seems to have been quite a game changer; along with the lift in headline inflation the prospect of an imminent beginning to the taper has lifted bond rates to more realistic levels (with a lot more to come) and highlighted that central bank rate hikes are not as far away as earlier expected – Australia included.
Australia’s Quantitative Easing program seems likely to be phased out in 2022. If the RBA adopts a proactive approach to the program, it is likely to be phased out by May/August. If, as was demonstrated at the September Board meeting, it adopts a gradual approach to the taper the program could extend until November.
Elliott Wave View: DAX Rally Should Fail
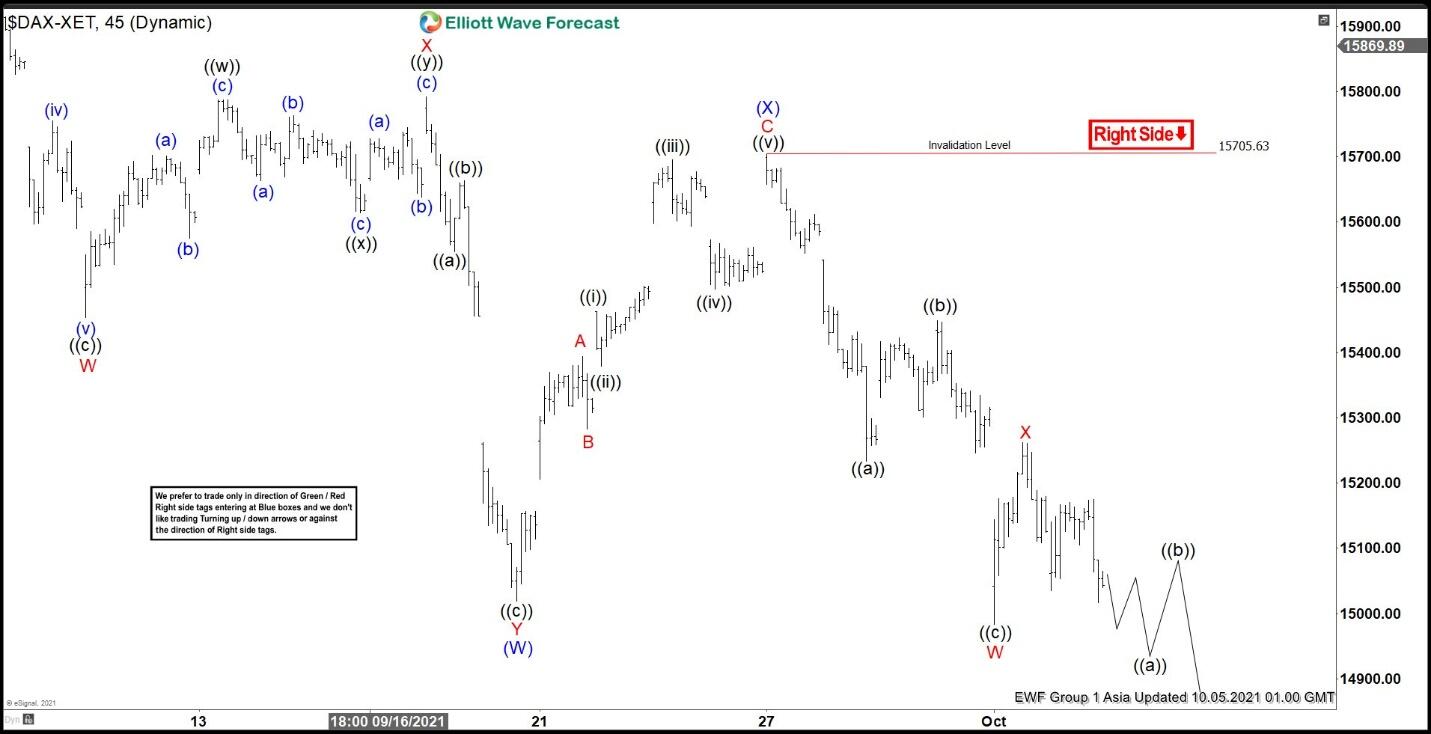
Short-term Elliott wave view in DAX suggests the decline from August 13, 2021 high is unfolding as a double three Elliott Wave structure. Down rom August 13 high, wave W ended at 15453.96 and rally in wave X ended at 15791.90. Index then resumed lower in wave Y towards 15019.49. This completed wave (W) in higher degree. Correction in wave (X) has also ended at 15705.63. Internal subdivision of wave (X) unfolded as a zigzag structure. Up from wave (W), wave A ended at 15394.33 and pullback in wave B ended at 15282.63. Index then resumed higher in wave C towards 15705.63 which ended wave (X).
Index turned lower and broke below wave (W) at 15019.49 suggesting the next leg lower wave (Y) has started. Down from wave (X), wave ((a)) ended at 15232.97 and rally in wave ((b)) ended at 15448.52. Index then resumed lower in wave ((c)) towards 14983.80 which also ended wave W. Correction in wave X ended at 15262.75. Near term, expect rally to fail below 15705.63 invalidation level for further downside. Potential target lower is 100% – 161.8% Fibonacci extension from August 13, 2021 peak towards 14063.49 – 14686.14. Near term, as far as September 27 pivot high at 15705.63 remains intact, expect rally to fail in 3, 7, or 11 swing for further downside.
DAX 45 Minutes Elliott Wave Chart
Market Morning Briefing: Aussie Is Unable To Break Above 0.7320
STOCKS
Dow and Dax have fallen sharply but can be ranged within a broad zone of 34750-33500 and 15000-15500 respectively. Shanghai markets are closed till 7th October. Nikkei has also fallen sharply and has scope to eventually fall towards 27000 while it remains below 28000. Nifty and Sensex may rise from current levels while supports on the downside are intact near 17600/400/200 on Nifty and 59000 on the Sensex.
Dow (34002.92, -323.54, -0.94%) has fallen back yet again and seems to fluctuate within the 34750-33500 range which is possible for the next few sessions before we see any decisive break out on either side of the mentioned range.
DAX (15036.55, -119.89, -0.79%) has fallen too, testing 15000 again. It would be important to see if Dax breaks below 15000 to fall towards 14800 or manages to bounce back again towards 15400-15500 which is an immediate trend resistance above current levels. Watch price action on extremes of the 15000-15500 region.
Nikkei (27658.31, -786.58, -2.77%) has come down sharply today due to shortage of vaccines and spike in inflation. 27000 is the next strong support below 28000 which can be tested in the next 1-2 weeks before a rise back towards 28000 or higher looks possible.
Shanghai (3568.17, +31.87, +0.90%) markets are closed till 7th October. While above 3500, view is bullish.
Nifty (17691.25, +159.20, +0.91%) rose yesterday to test 17746.80 before closing lower just below 17700. A strong break above 17800 is needed to negate the view of seeing a corrective fall towards 17400/200 levels.
Sensex (5929932, +533.74, +0.91%) closed above 59000.While above 59000,the view is bullish to see a test of 60000 in the coming sessions
COMMODITIES
Crude prices have risen and look fairly bullish for the coming 1-2 weeks especially after the OPEC+ has decided to keep the output policy intact for now. Brent can test 85.0-85.62 while WTI has scope to rise to 78-80. Gold can remain within 1780/90-1760/40 region for the near term. Silver may remain ranged within 21.50-23 zone. Copper is trading below resistance at 4.25 which if holds can take the price down to 4.10/00 else a test of 4.35 is possible.
Brent (81.56) has risen above 80-81 levels again after OPEC+ confirmed that it would stick to its current output policy as demand seems to be rising for oil and petroleum products. Although there is immediate resistance on the 3-day chart, we may look for a slow rise to 85.62 in the coming weeks. 78-80 would be an important support zone on the downside.
WTI (77.83) has scope to rise steadily towards 78-80 on the upside.
Gold (1764.10) tested 1771 but has come off from there. A range of 1780/90-1760/40 looks likely for the near term within which a test of the upper end of the range can be seen.
Silver (22.51) has come off even before testing 23 on the upside. We may look for a range of 23-21.50 for the near term unless a break on either side is seen.
Copper (4.2180) rose to test 4.24 before coming off from there. Note that 4.25/24 is an interim trend resistance which if holds can take the price down to 4.10/00 again in the near term. Any break above 4.25 will again open up chances of a rise to 4.30/35 in the longer run.
FOREX
Dollar Index has risen from 93.678 and while the index trades above 93.60, it is likely to rise back above 94. Euro can test 1.1660/80 before again falling back from there. Broadly while below 1.171.1750, we cannot negate a bearish view of testing 1.15-1.14 in the longer run. EURJPY is ranged within 130.50-128 region while Pound and Aussie are also likely to remain ranged within 1.3750-1.34 and 0.7320-0.7220 respectively. USDINR may rise towards 74.45/50 as rising crude can impact the pair positively.
Dollar Index (93.917) bounced back sharply from 93.678 seen yesterday and has scope to rise towards 94+ while above 93.60. Unless the index is able to break below 93.60, it is difficult to expect Dollar weakness for now that would sustain for at least a couple of weeks.
Euro (1.1604) tested 1.1640 yesterday before falling off from there. The exchange rate has to necessarily break above 1.1660-1.1680 in the near term and above 1.1750 in the medium term to avoid falling towards 1.15-1.14 on the downside. While below 1.17-1.1750, downside risk persists in the longer run.
EURJPY (128.94) had risen well from yesterday’s intra-day low of 128.518 and can test 129.40/50 in the near term. Broad range of 130.50-128 continues to hold for now.
Dollar-Yen (111.11) is holding above 110.80 from where a bounce has been seen since yesterday. While above 110.80, the rate can rise towards 111.40-111.60 in the coming sessions.
Aussie (0.7275) is unable to break above 0.7320 and while below that, it is likely to remain stable within 0.7320 and 0.7220 for a few sessions. Immediate view is ranged unless a decisive break on either side is seen.
Pound (1.3602) has been rising well from 1.34 and can test 1.3650-1.37 before again falling lower from there. A range of 1.3750-1.34 can hold for now.
USDCNY (6.4450) may continue to hold within 6.47/48-6.44 range. As mentioned yesterday, any break below 6.44 can lead to a fall towards 6.41/40.
USDINR (74.3150) rose yesterday from low of 74.1275 as expected. The air may rise further today as it holds high correlation with crude prices currently. Rising crude may take USDINR higher towards 74.45/50.
INTEREST RATES
The US Treasury Yields have bounced slightly. As mentioned yesterday, the yields will have to break below the near-term supports to see a deeper fall from here. While the supports hold, a near-term rise is possible before we see a fresh reversal. The German yields remain stable and are keeping alive the chances of seeing a short-term rise to test their resistances and then fall back again. The 5Yr and 10Yr GoI have immediate resistances ahead which have to be broken to see an extended rise. While these resistances hold, a pull-back can be seen.
The US 2Yr (0.28%), 5Yr (0.95%), 10Yr (1.48%) and the 30Yr (2.04%) %) have bounced back. A rise above 1.5% will bring back the chances of testing 1.6% on the upside. As mentioned yesterday, the 10Yr will have to fall below 1.4% to negate the rise to 1.6%. Similarly, the 30Yr should break below 2% to see 1.9%-1.8% on the downside again and negate the chances of seeing 2.1%-2.2% on the upside
The German 2Yr (-0.71), 5Yr (-0.58%), 10Yr (-0.22%) and 30Yr (0.26%) remains stable. Our near-term bullish view remains intact. The 10Yr can rise to -0.1% on a break above -0.2%. The 30Yr has room to test 0.30%-0.35% while above 0.2%. Thereafter a fresh fall is possible to keep the long-term downtrend intact.
The Indian 10Yr GoI (6.2478%) has an immediate resistance at 6.26% which will need a close watch. While that holds, a pull-back to 6.2% is possible in the coming days. But a break above 6.26% will see an extended rise to 6.3%-6.32% and then see a reversal.
The 5Yr GoI (5.6842%) on the other hand has resistance in the 5.7%-5.72% region which has to be broken for it to rise further towards 5.75%-5.76%. While below 5.72%, the chances are high for it to come down towards 5.66%-5.64% again in the coming days.
RBA keeps rate at 0.10%, continue QE until at least Feb 2022
RBA left monetary policy unchanged as widely expected. Cash rate is kept at 0.10%. Target for April 2024 Australian Government bond yield is also held at 0.10%. The asset purchase program will continue at AUD 4B per week until at least mid February 2022. RBA also maintained that the condition for rate hike "will not be met before 2024".
It maintained that the set back to economy expansion by the Delta outbreak is "expected to be only temporary". In the central scenario, the economy will be growing again in Q4, and is expected to be "back around its pre-Delta path in the second half of next year".
On labor market, RBA said it's business liaison and job vacancies data suggest that "many firms are seeking to hire workers ahead of the expected reopening in October and November." Wage and price pressures remain "subdued" and disruption to global supply chains on overall inflation "remains limited".
GBP/USD Might Face Hurdles Near 1.3700
Key Highlights
- GBP/USD started an upside correction from the 1.3400 zone.
- A key bearish trend line is forming with resistance near 1.3610 on the 4-hours chart.
- EUR/USD is still trading below the 1.1680 resistance zone.
- The US ISM Services Index could decline from 61.7 to 60.0 in Sep 2021.
GBP/USD Technical Analysis
The British Pound found support near 1.3400 against the US Dollar. GBP/USD started a fresh increase and it broke the 1.3500 resistance zone.
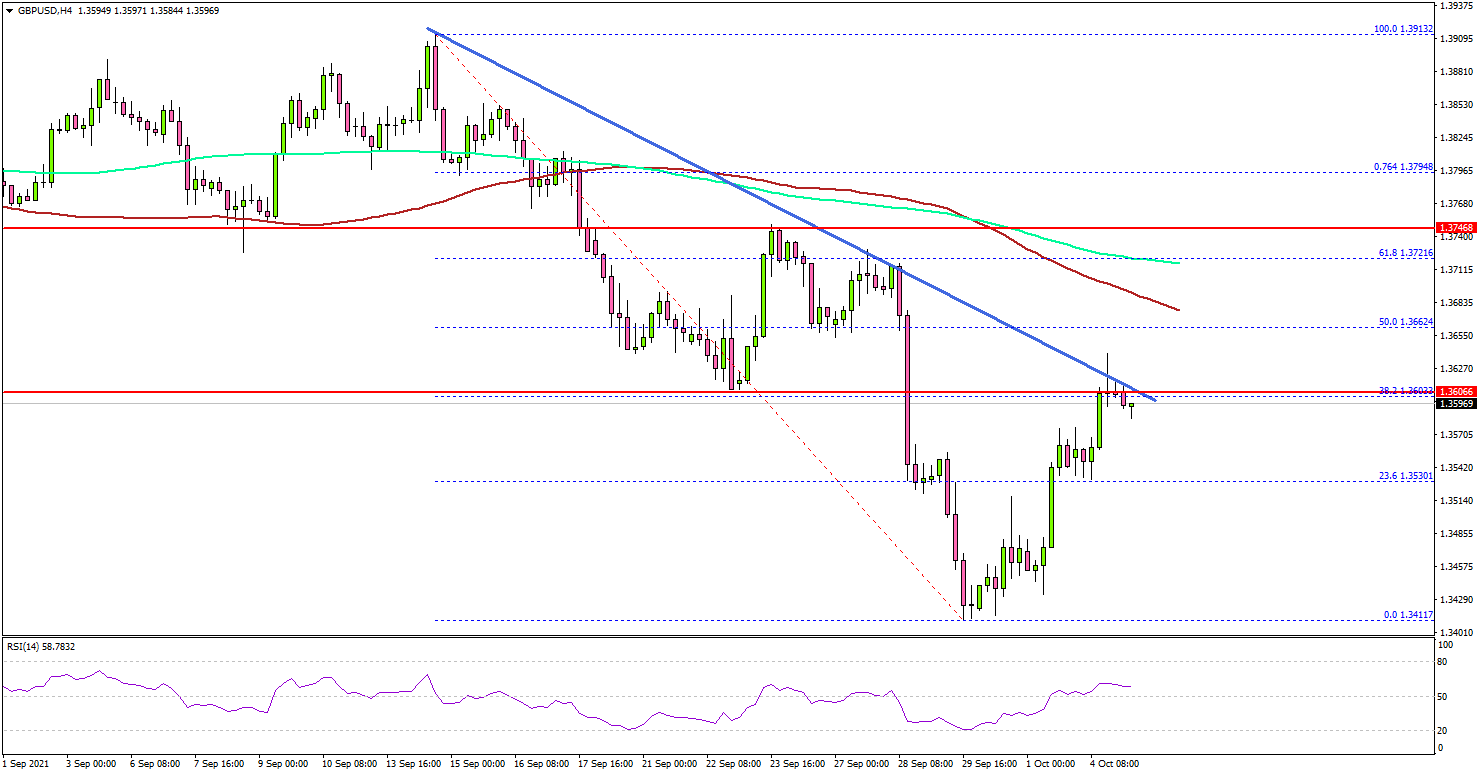
Looking at the 4-hours chart, the pair traded as low as 1.3411 before it started a steady recovery. There was a break above the 23.6% Fib retracement level of the downward move from the 1.3913 swing high to 1.3411 low.
It is now trading near a key bearish trend line with resistance near 1.3610 on the same chart. The first key resistance is near the 1.3660 level.
The 50% Fib retracement level of the downward move from the 1.3913 swing high to 1.3411 low is also near 1.3660. The next major resistance is near 1.3700, the 100 simple moving average (red, 4-hours), and the 200 simple moving average (green, 4-hours).
A close above 1.3700 could set the pace for a larger increase. An initial support on the downside is near the 1.3570 level. The next key support is near 1.3520, below which the pair may possibly continue lower. In the stated case, the price could test the 1.3420 level.
Looking at EUR/USD, the pair started an upside correction, but it is likely to face a major hurdle near the 1.1680 region in the near term.
Economic Releases
- Germany's Services PMI for Sep 2021 - Forecast 56.0, versus 56.0 previous.
- Euro Zone Services PMI for Sep 2021 – Forecast 56.3, versus 56.3 previous.
- UK Services PMI for Sep 2021 – Forecast 54.6, versus 54.6 previous.
- US Services PMI for Sep 2021 – Forecast 54.4, versus 54.4 previous.
- US ISM Services Index for Sep 2021 – Forecast 60.0, versus 61.7 previous.
(RBA)Statement by Philip Lowe, Governor: Monetary Policy Decision
At its meeting today, the Board decided to:
- maintain the cash rate target at 10 basis points and the interest rate on Exchange Settlement balances at zero per cent
- maintain the target of 10 basis points for the April 2024 Australian Government bond
- continue to purchase government securities at the rate of $4 billion a week until at least mid February 2022.
The Delta outbreak has interrupted the recovery of the Australian economy and GDP is expected to have declined materially in the September quarter. The outbreak is affecting many parts of the economy, but the impact is uneven, with some areas facing very difficult conditions while others are continuing to grow strongly.
This setback to the economic expansion in Australia is expected to be only temporary. As vaccination rates increase further and restrictions are eased, the economy is expected to bounce back. Many businesses are now planning for the easing of restrictions and confidence has held up reasonably well. There is, however, uncertainty about the timing and pace of the bounce-back and it is likely to be slower than that earlier in the year. Much will depend on the nature and timing of the easing of restrictions on activity. In our central scenario, the economy will be growing again in the December quarter and is expected to be back around its pre-Delta path in the second half of next year.
The restrictions on activity have had a significant effect on the labour market. Hours worked – the best indicator of labour market conditions at the moment – declined by nearly 4 per cent in August. Looking forward, the Bank's business liaison and data on job vacancies suggest that many firms are seeking to hire workers ahead of the expected reopening in October and November.
Wage and price pressures remain subdued in Australia. In underlying terms, inflation is running at around 1¾ per cent and wages, as measured by the Wage Price Index, are increasing at just 1.7 per cent. While disruptions to global supply chains are affecting the prices of some goods, the impact of this on the overall rate of inflation remains limited.
Housing prices are continuing to rise, although turnover in some markets has declined following the virus outbreak. Housing credit growth has picked up due to stronger demand for credit by both owner-occupiers and investors. The Council of Financial Regulators has been discussing the medium-term risks to macroeconomic stability of rapid credit growth at a time of historically low interest rates. In this environment, it is important that lending standards are maintained and that loan serviceability buffers are appropriate.
The Bank's package of policies – including record low interest rates, the bond purchase program, the yield target and the funding provided under the Term Funding Facility – is providing substantial and ongoing support to the Australian economy. Borrowing rates are at record lows, sovereign bond yields are at very low levels and the exchange rate has depreciated over recent months. The fiscal responses by the Australian Government and the state and territory governments have also been providing welcome assistance in supporting household and business balance sheets.
The Board is committed to maintaining highly supportive monetary conditions to achieve a return to full employment in Australia and inflation consistent with the target. It will not increase the cash rate until actual inflation is sustainably within the 2 to 3 per cent target range. The central scenario for the economy is that this condition will not be met before 2024. Meeting this condition will require the labour market to be tight enough to generate wages growth that is materially higher than it is currently.