Sample Category Title
USD Seems To Recover After Friday’s Drop
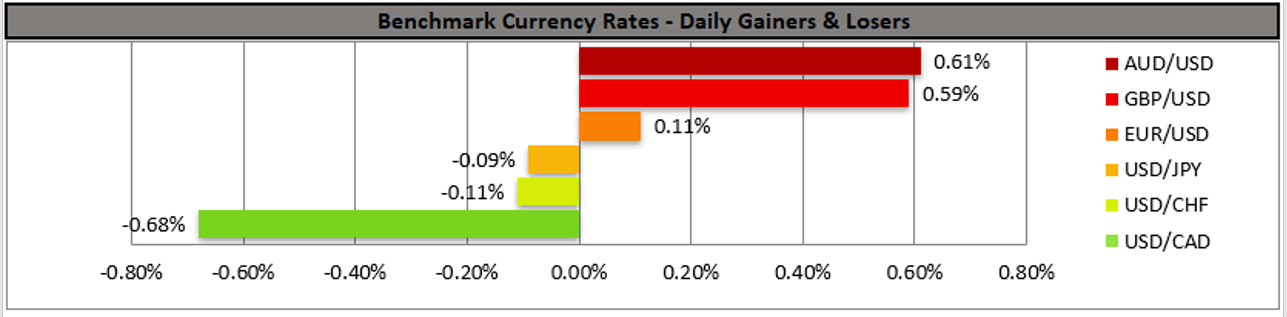
The USD seemed to recover somewhat against some of its counterparts during todays' Asian session, after Friday's wide retreat as uncertainty seems to be on the rise once again. It should be noted that shares in China's giant developer Evergrande were halted from trading in the Hong Kong stock exchange forcing uncertainty to resurface about the issue in the markets. The uncertainty tended to strengthen the USD during today's Asian session, while US Stockmarkets seemed to weaken in the premarket hours as the possible ripple effects seem to worry traders. It should be noted though that Dow Jones tended to gain during Friday's session, as Merck's Covid 19 pill seemed to provide optimism regarding the US economic recovery. Also, on US fundamentals, we note the possibility of further escalations in the US-Sino relationships which could provide further support for the USD, while traders eye the release of the US employment report for September on Friday. The CAD gained on Friday against the USD as the positive market sentiment tended to provide support for the commodity currency, while local data tended to be lukewarm capping the bull's action. On the other hand, oil prices edged higher on Friday yet corrected a bit lower during today's Asian session, as trader's eyes turn towards the OPEC meeting in order to decide how much oil production levels are to be raised. We note from Australia RBA's interest rate decision tomorrow and the bank is widely expected to remain on hold at 0.10% while New Zealand's RBNZ is expected to proceed with a 25-basis points rate hike on Wednesday.
The USD index corrected a bit higher during today's Asian session yet remains below the 94.10 (R1) resistance line for now. We tend to maintain a bias for a sideways motion currently, as the price action shows signs of stabilisation and given that the RSI indicator below our 4-hour chart is near the reading of 50, implying a rather indecisive market. Should buyers take charge of the index's direction, we may see it breaking the 94.10 (R1) line which kept the bulls at bay in today's Asian session and aim for the 94.60 (R2) level. Should a selling interest be displayed by the market, we may see the index aim if not breach the 93.70 (S1) support line.
AUD/USD seems to be aiming for the 0.7280 (R1) resistance line today. We tend to maintain a bullish outlook for the pair as long as it remains above the upward trendline incepted since the 29th of September. Should the bulls actually maintain control over the pairs' direction, we may see it breaking the 0.7280 (R1) resistance lien and aim for the 0.7335 (R2) resistance level. Should the bears take over, we may see the pair reversing course breaking the prementioned upward trendline and aim if not breach the 0.7225 (S1) support line.
Today's events and expectations
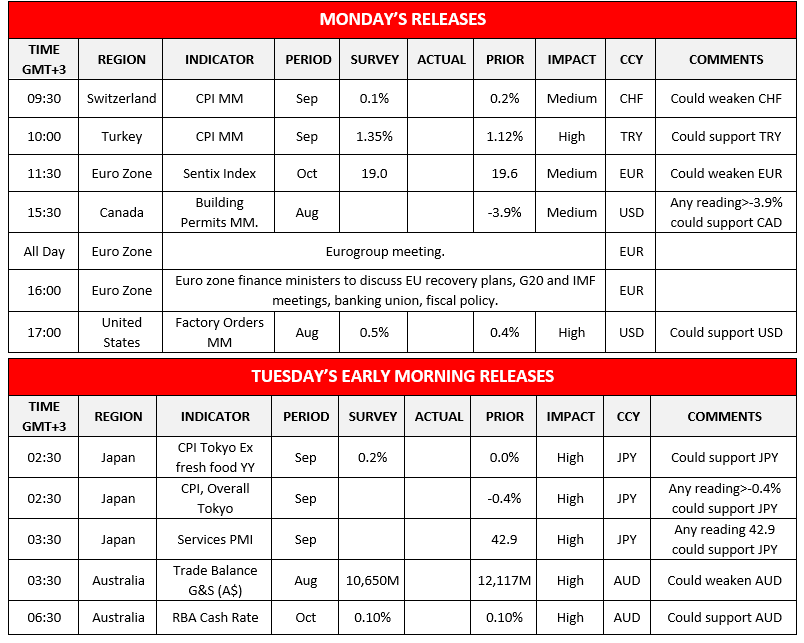
Today during the European session, we note the release of Turkeys' and Switzerland's CPI rates for September while in the American session we get the US factory orders growth rates.
As for the rest of the week
On Tuesday, we get from Japan Tokyo's inflation data for September, Australia's RBA interest rate decision, UK's reserve totals for September, the US and Canada's trade balances for August and the US ISM non-manufacturing PMI for September. On Wednesday, we get from New Zealand RBNZ's interest rate decision, Germany's industrial orders for August, Eurozone's retail sales for August and form the US the ADP National employment figure for September. On Thursday we get, UK's Halifax House prices for September, Germany's industrial output for August and the weekly US initial jobless claims, while from Canada BoC Governor Macklem is scheduled to speak. On Friday, we get Japan's current account balance for August, Germany's trade data for August, the US employment report for September and Canada's employment data also for September.
USD index H4 Chart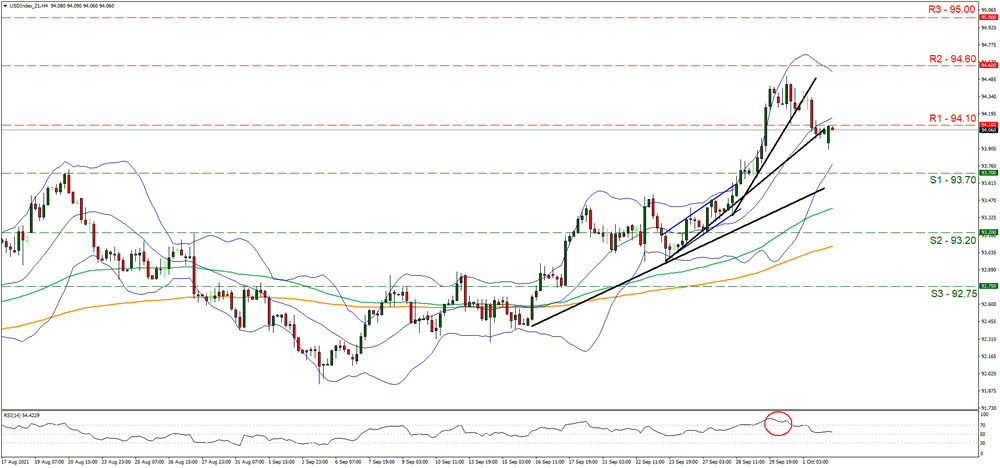
Support: 93.70 (S1), 93.20 (S2), 92.75 (S3)
Resistance: 94.10 (R1), 94.60 (R2), 95.00 (R3)
AUD/USD H4 Chart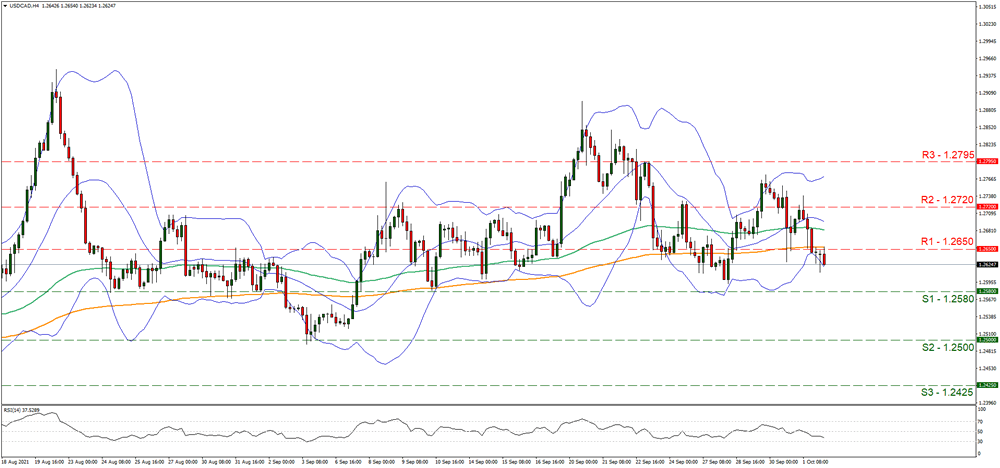
Support: 0.7225 (S1), 0.7170 (S2), 0.7110 (S3)
Resistance: 0.7280 (R1), 0.7335 (R2), 0.7420 (R3)
EURUSD Points Slightly Up After Meeting 14-Month Low
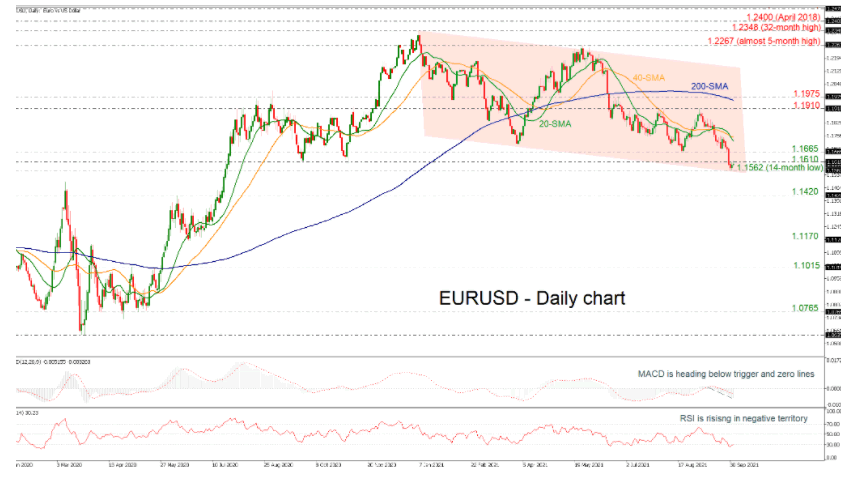
EURUSD found strong support at the 14-month low of 1.1562 last week, turning up from the lower boundary of the descending channel.
Technically, the RSI indicator is mirroring the latest bullish move and is moving above the oversold territory; however, the MACD oscillator is still extending its negative movement beneath its trigger and zero lines. In trend indicators, the 20- and 40-day simple moving averages (SMAs) completed a bearish crossover.
Any advances beyond the 1.1610 resistance could open the way for the 1.1665 barrier ahead of the short-term SMAs around 1.1720-1.1745. Rising further, the bulls could meet the 1.1910 hurdle before the battle starts near the 200-day SMA at 1.1953 and the 1.1975 obstacle.
On the flip side, a drift below the long-term downward sloping channel could endorse the broader negative outlook, hitting the 1.1420 support, taken from the inside swing high on June 9. Steeper decreases could open the way for 1.1170 and 1.1015.
In conclusion, EURUSD is ticking marginally up in the very short-term, but the bigger view is negative
Core Bond Markets Reversed Early
Markets
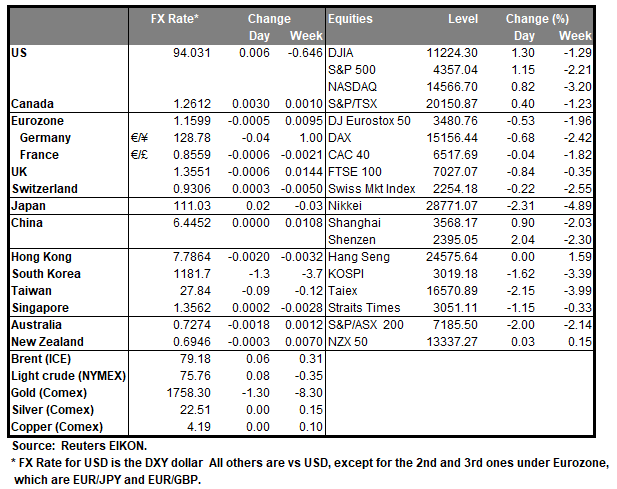
US stock markets set aside inflation worries on Friday even as both the core and headline PCE deflator accelerated to a 30-year high of 3.6% and 4.3% y/y respectively. Wall Street instead focused on a consensus-beating manufacturing ISM (61.1 from 59.9). Details were strong with new orders stable at 66.7, output coming in at 59.4 and employment rising again slightly (50.2) after a month in contraction territory. After easing for two months straight from historically high levels, prices paid picked up again (81.2 from 79.4). Late-stage trial results showing Merck’s Covid-19 pill cuts the risk of hospitalization or death by half supported sentiment as well. Equities in the US ended 0.8-1.4% higher. Democrats meanwhile are trying to get out of a deadlock that takes hostage of both the infrastructure and social spending plan (see below). Bi-partisan discussions on the US debt ceiling still haven’t resulted in a breakthrough either. Markets are getting more nervous with yields on US T-bills maturing past X-date (October 18) spiking. Despite a constructive environment and solid US data, yields on other tenors fell with the belly (-2.6 bps to -3.7 bps) outperforming the wings of the curve (-1.2 bps to -1.6 bps). German yields declined in lockstep with changes varying from -1.4 bps (2y) to -2.5 bps (5y/10y). The dollar lost further momentum after hitting important resistance at 94.74 in the trade-weighted variant the days before. DXY eased from 94.31 to 94.03. EUR/USD tried to recoup the 1.16. Sterling clawed back and almost completely reversed the heavy losses incurred on Wednesday’s risk-off. EUR/GBP finished at 0.856. Cable settles north of 1.35 again.
Asian sentiment was hit by the decision to suspend trading in Evergrande shares without a reason given. Reports later suggesting a rival company acquired a majority stake in the beleaguered property firm remain unconfirmed. Hong Kong and South Korean stocks underperform (-2%). Chinese markets are closed until Friday for the Golden Week. FX markets trade muted. The Australian dollar is leading G10 peers ahead of the RBA tomorrow. Core bond markets reversed early Asian strength to trade slightly below or near Friday’s closing levels.
Trading today is probably going to be technically inspired. The eco calendar heats up from tomorrow onwards with the US services ISM and Friday’s payrolls report as culmination point. In between we have several central bank meetings and a slew of ECB/Fed speeches. Core bond yields are looking for a bottom after last week’s repositioning. The 10y yield could find support around 1.45% in the US and -0.24% in Germany. We’re monitoring the very short end of the US curve (T-bills) closely as we expect the debt ceiling debate to intensify. EUR/USD started a bottoming out process as well but is struggling to take out the 1.16 big figure. It may need help from a generous risk climate to do so. Sterling awaits finance minister Sunak’s £500mln jobs plan.
News headlines
US Democrats have given themselves an additional month’s time to settle their difference on the spending agenda. House speaker Pelosi pulled the planned vote on the infrastructure bill a second time as Progressive Democrats still want it to be tied to the $3.5tn Build Back Better spending bill which includes childcare, paid leave, climate change and housing. Several progressive Democrats later said they are willing to compromise on the amount with the Capitol Hill whisper number being somewhere around $2tn. Moderate Democrats want assurances on that matter, before supporting any other spending bill (apart from the pulled infrastructure bill).
Czech central bank governor Rusnok rebuffed criticism from the country’s finance minister Schillerova who last week took a shot at the CNB’s unexpected 75 bps rate hike which increased the wedge between the CNB and other developing countries who for now retain easy policies which support wealth and living standards. Rusnok reminded Schillerova that the CNB’s sole legal mandate is safeguarding price stability. He suggested that other countries would follow swiftly. The CNB took a head start as it wants to stop higher inflation from boosting wage demands and that way become entrenched in the economy for longer. EUR/CZK continues trading near key support at 25.30.
SPX 500 Faces Key Hurdle
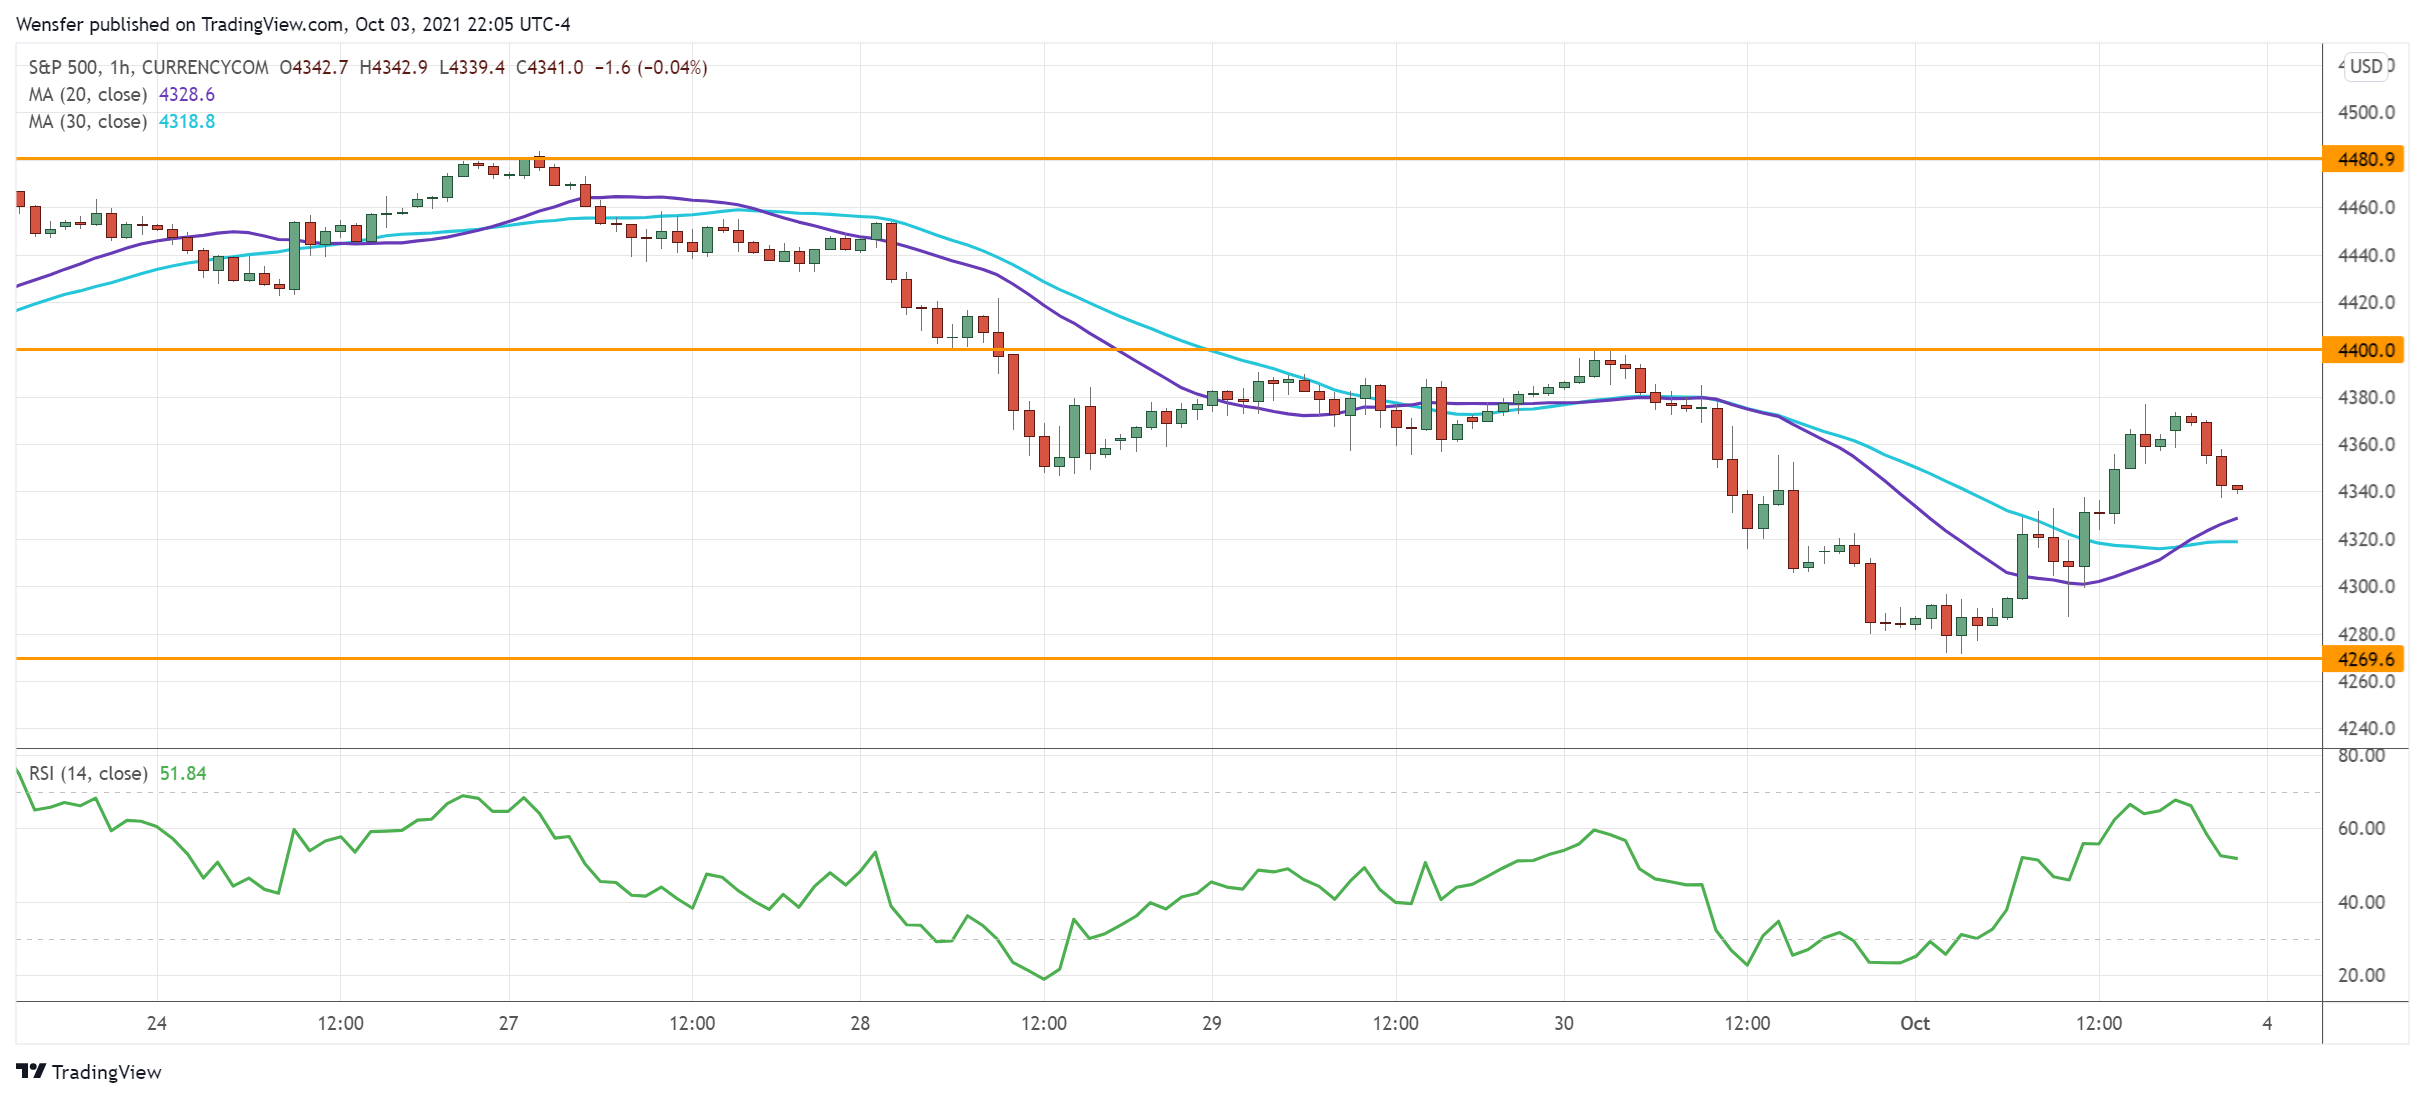
The S&P 500 struggles as concerns over economic slowdown spread. A bearish MA cross on the daily chart indicates that sentiment has turned sour.
The fall below 4340 has shattered the hope of a quick rebound. The index is testing last July’s low at 4270. A repeatedly oversold RSI has triggered a buying-the-dips mentality.
The early bulls will need to close above 4400 before they could attract momentum buyers’ attention. Otherwise, the bears would be eager to sell into strength.
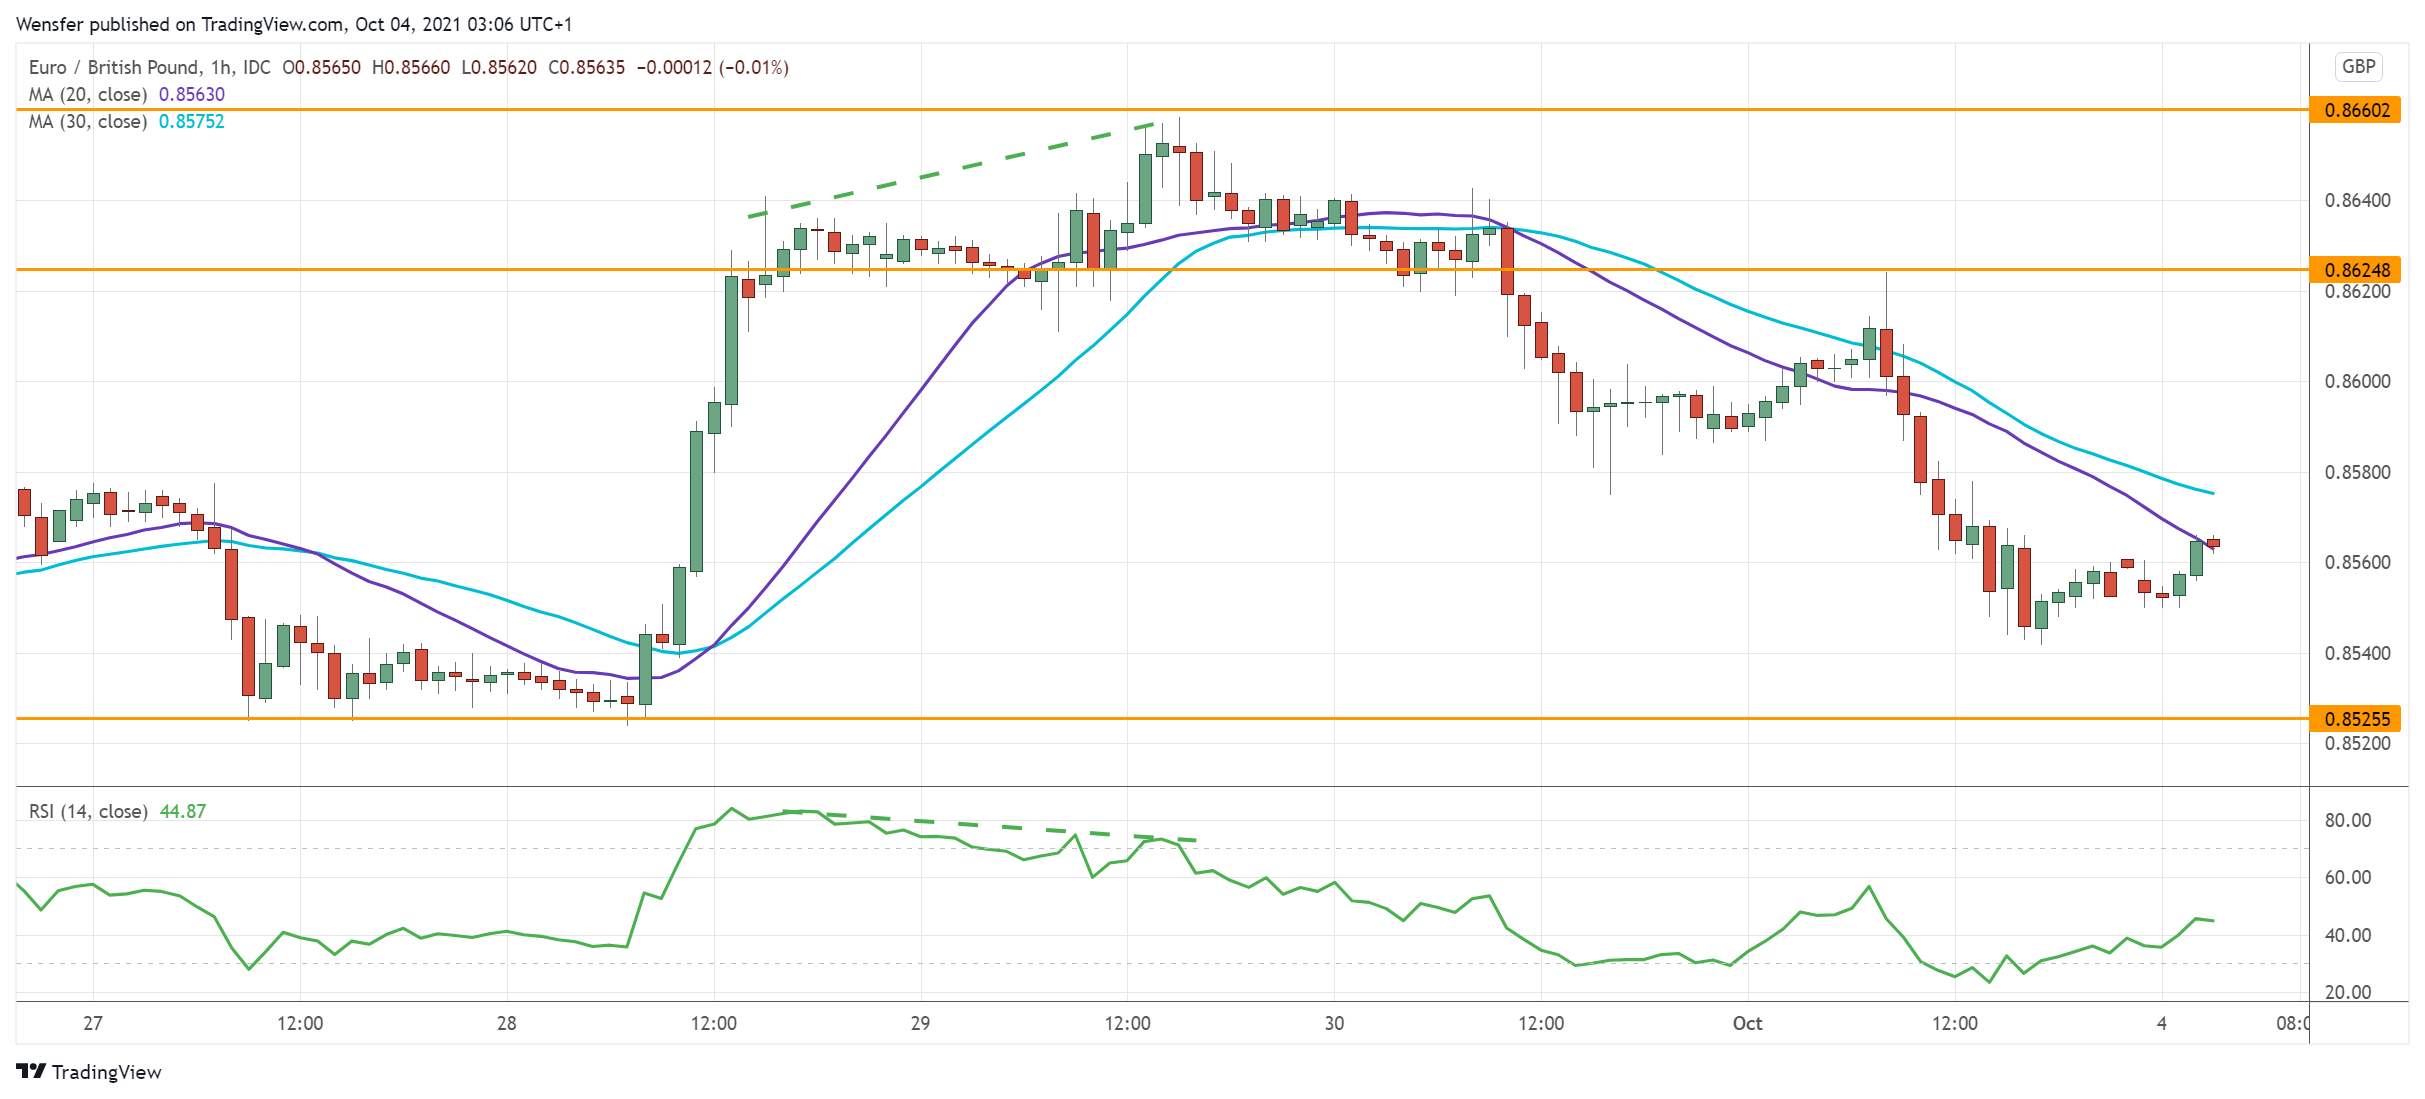
EUR/GBP Tests Demand Zone
The pound swings higher likely due to profit-taking, following a sharp sell-off. The euro’s surge has hit a speed bump at July’s high (0.8660).
An overbought RSI and its bearish divergence have prompted short-term buyers to take chips off the table. The support-turned-resistance at 0.8620 capped a rebound.
The upside bias is still valid as long as the pair is above 0.8525, the base of the latest rally. The bulls may trigger an extended rally if they can lift 0.8625. Failing that, the price may drop to 0.8485.
USD/CAD Awaits Breakout
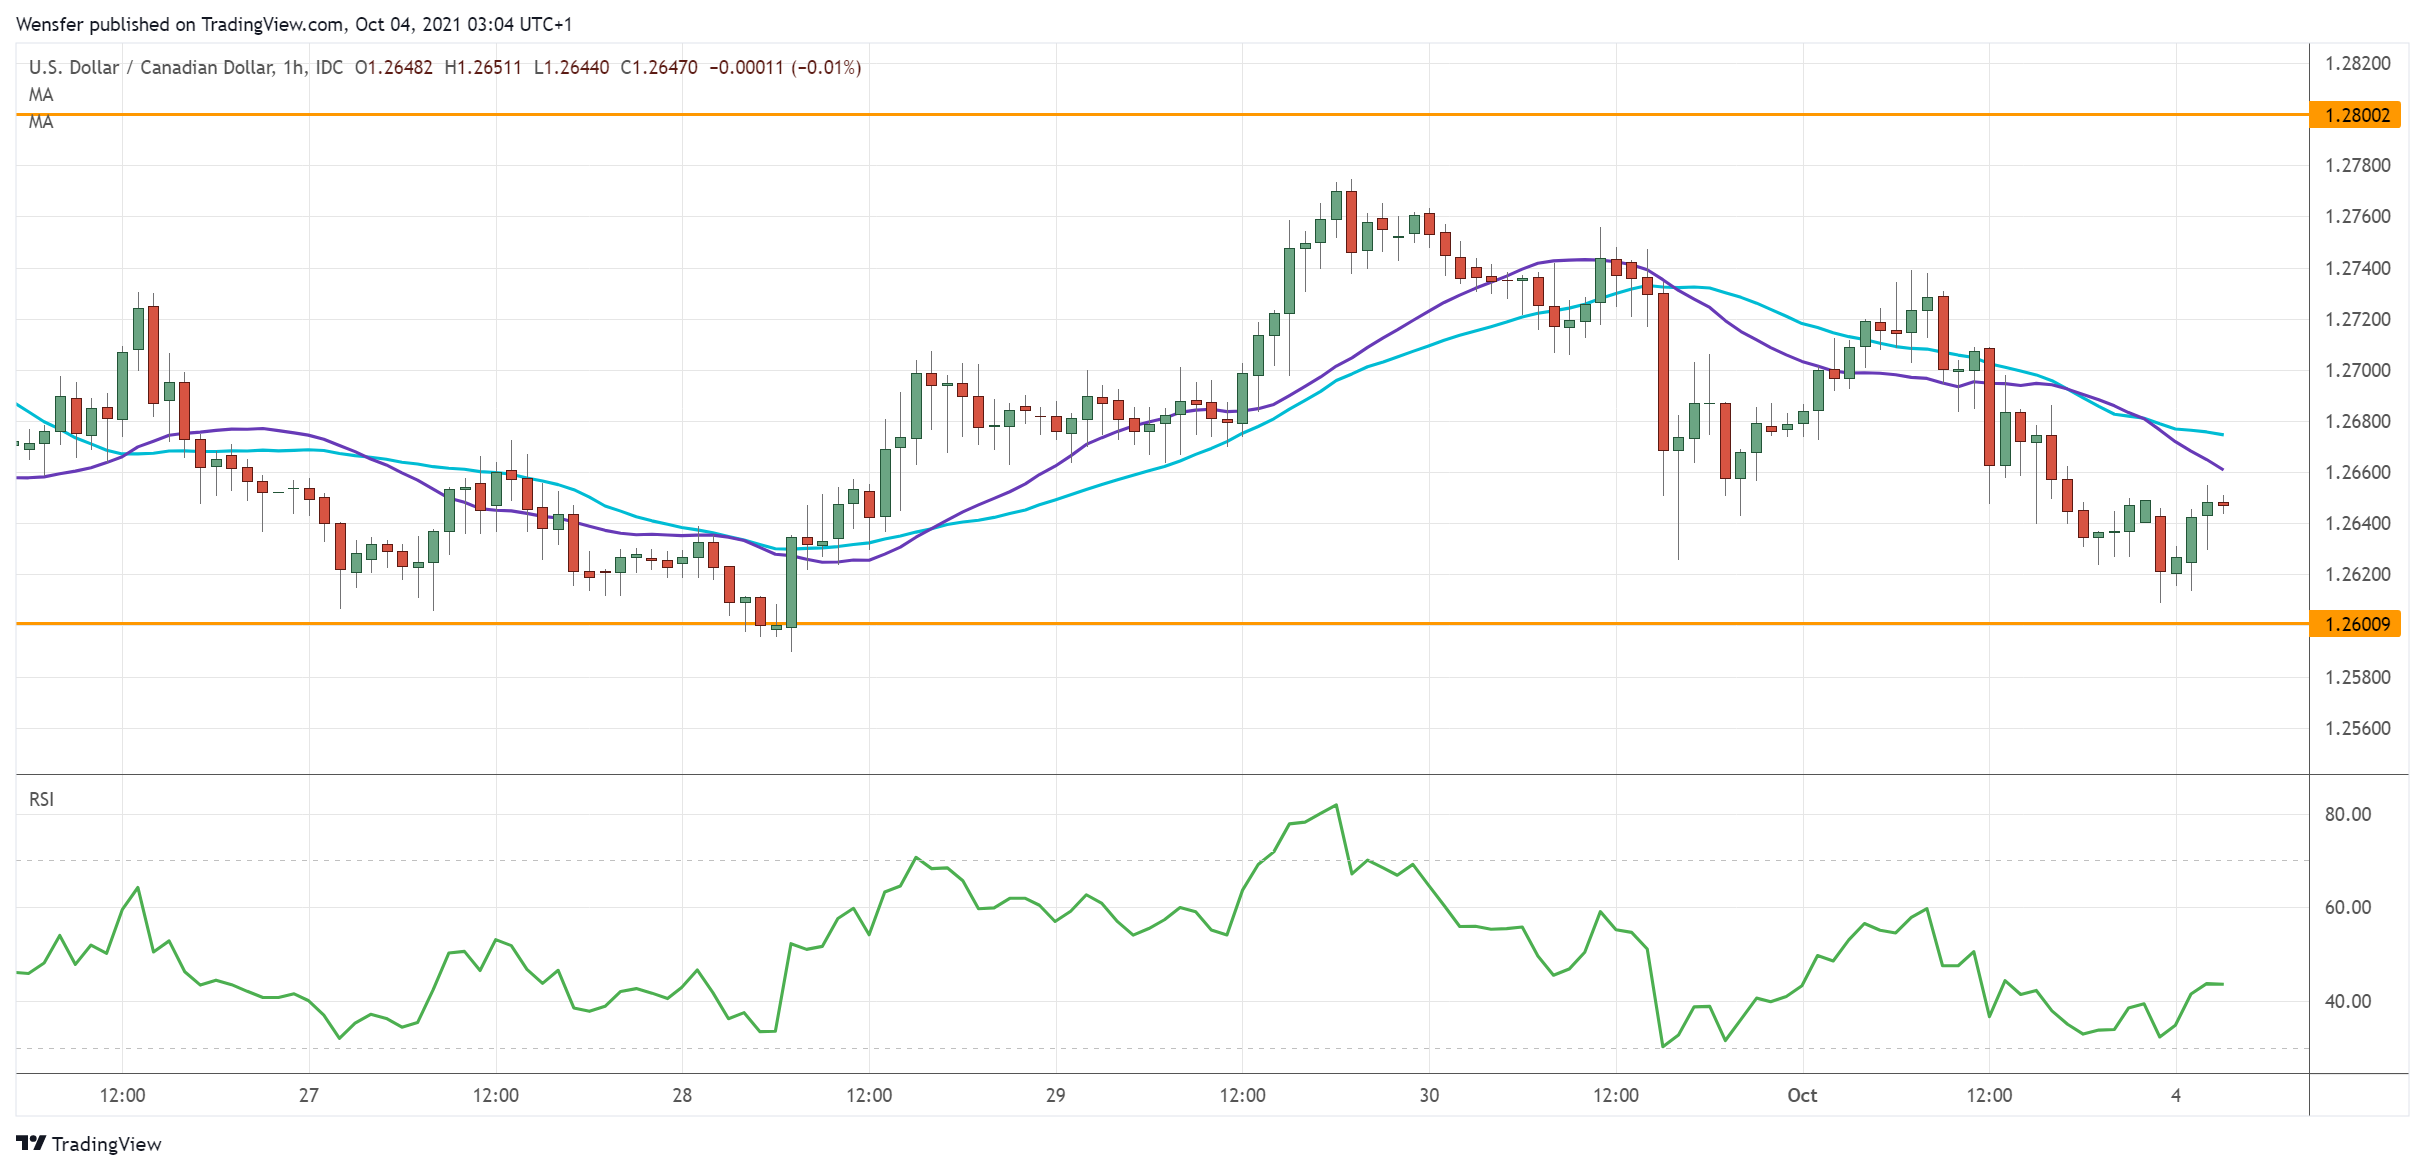
The Canadian dollar recovered after July’s GDP growth beat expectations.
The daily chart still favors the greenback even though the hourly price action is stuck in a narrowing range between 1.2600 and 1.2800. The indecision would end with a breakout that will dictate the direction for the next few days.
Multiple tests of the demand zone around 1.2600 suggest solid interest in keeping the uptrend intact. A bullish breakout would cause another attempt at August’s peak (1.2950), whereas a bearish one would lead to a revisit of 1.2500.
Daily Technical Analysis
EUR/USD
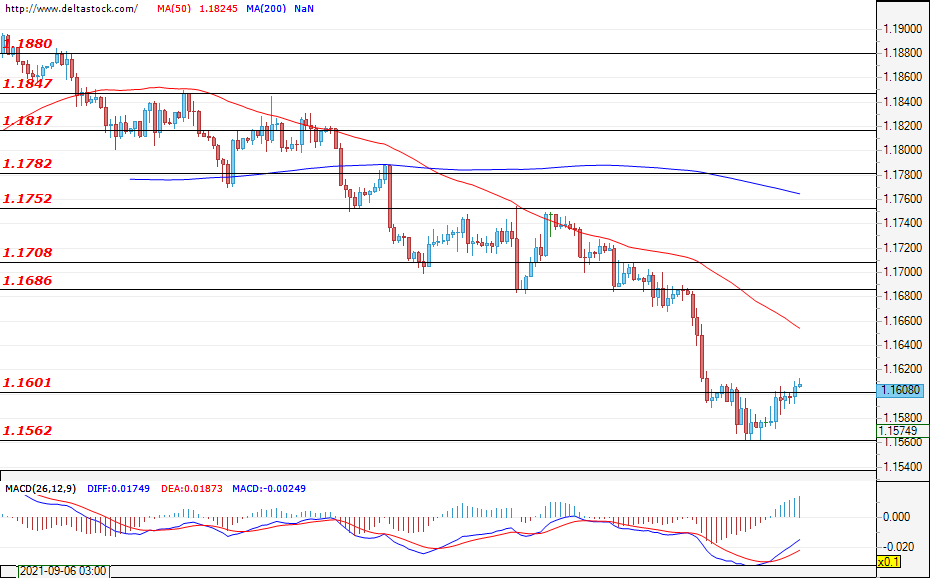
Current level - 1.1608
Last week’s sell-off seems to have been limited by the support zone at 1.1562 for now and, during the early hours of today`s trading, the EUR/USD is testing the resistance zone at 1.1601. If the bulls gain enough momentum and manage to keep the pair above the aforementioned level, the recovery will most likely continue towards the resistance at 1.1686. However, if the bears regain control of the market and manage to violate the zone of support, located at 1.1562, new losses for the common European currency against the greenback can be expected..This week, the most important news which the market participants will be focusing on is the unemployment rate and the change in the non-farm payrolls data (Friday; 13:30 GMT).
| Resistance | Support | ||
| intraday | intraweek | intraday | intraweek |
| 1.1686 | 1.1752 | 1.1601 | 1.1420 |
| 1.1708 | 1.1782 | 1.1562 | 1.1410 |
USD/JPY
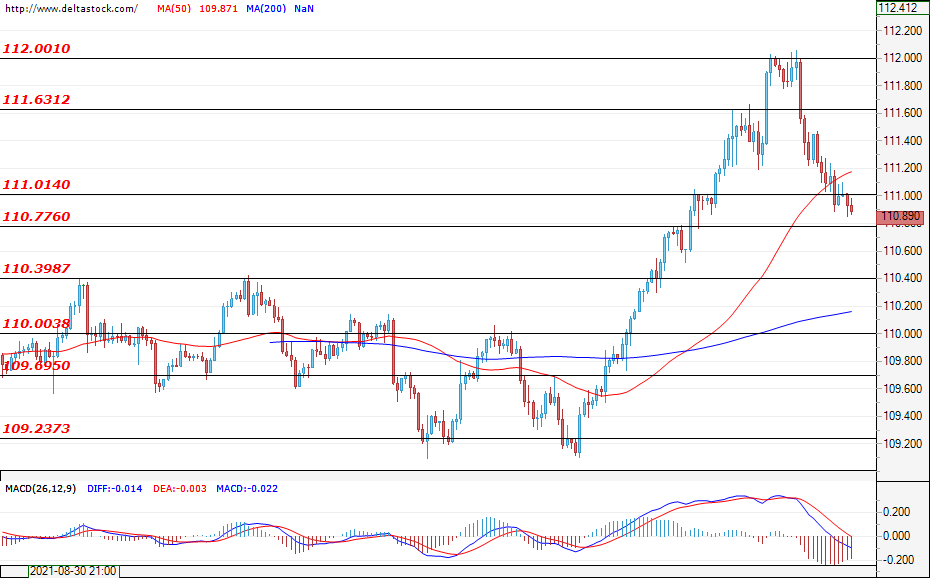
Current level - 110.89
At the end of last week, the bears prevailed and the dollar lost quite a bit of ground against the yen. At the time of writing, the USD/JPY is trading the support zone at 111.01, but only a successful breach of the lower target at 110.77 could lead to a more continuous corrective move towards the level of 110.39. If the bearish momentum fades, the Ninja will most likely rally towards the resistance zone of 111.63, followed by the level of 112.00.
| Resistance | Support | ||
| intraday | intraweek | intraday | intraweek |
| 111.01 | 112.00 | 110.77 | 110.00 |
| 111.63 | 113.50 | 110.39 | 109.69 |
GBP/USD
Current level - 1.3534
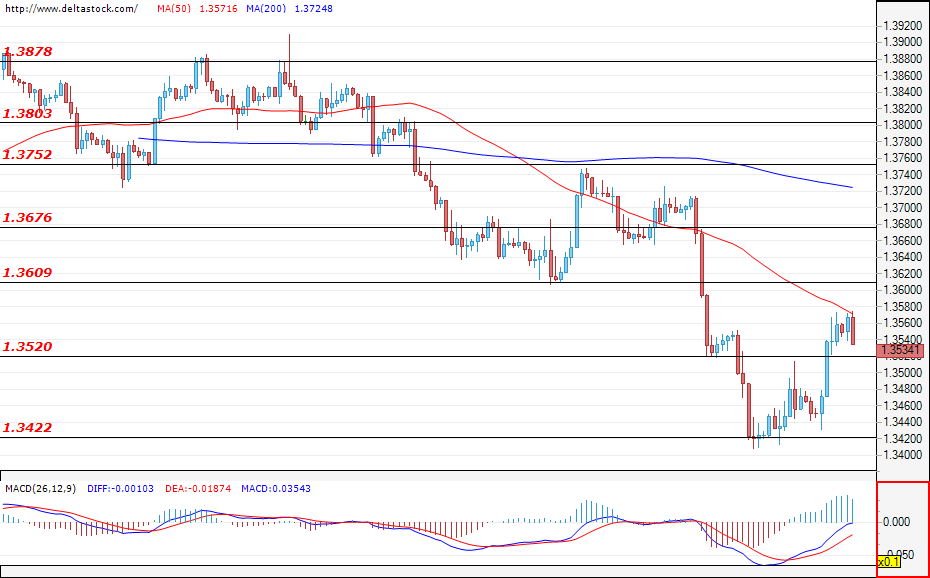
The bulls entered the market and the sterling recovered some of its recent losses against the dollar. The currency pair breached the resistance zone of 1.3520 and, if the bullish predominance continues, a future rally towards 1.3609, followed by a test of the zone at 1.3676, would be the most probable scenario. In case a more negative scenario develops, the first target for the bears can be found at the mentioned level of 1.3520, which is now acting as a support. A successful violation of the level at 1.3422 could deepen the sell-off towards the levels at around 1.3315.
| Resistance | Support | ||
| intraday | intraweek | intraday | intraweek |
| 1.3609 | 1.3752 | 1.3520 | 1.3400 |
| 1.3676 | 1.3803 | 1.3422 | 1.3250 |
EUR/USD Daily Outlook
Daily Pivots: (S1) 1.1568; (P) 1.1588; (R1) 1.1612; More...
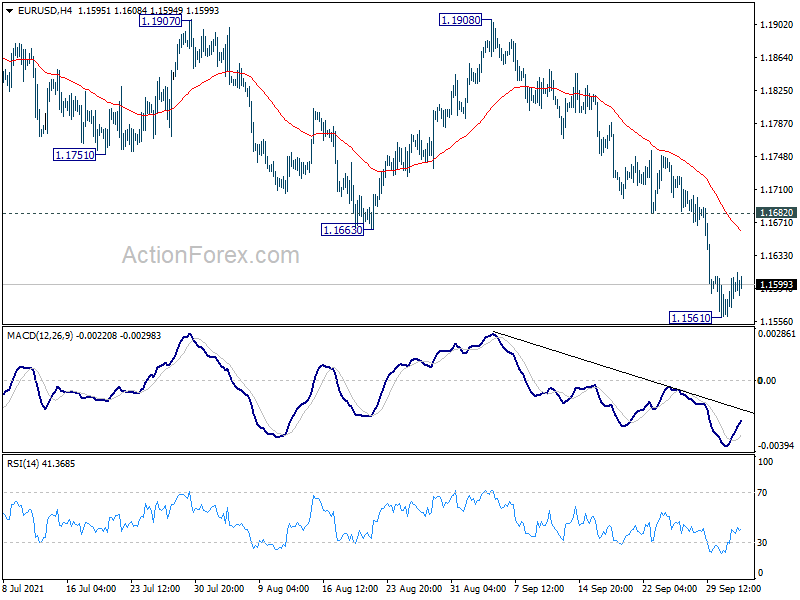
Intraday bias in EUR/USD remains neutral for consolidation above 1.1561 temporary low. Upside of recovery should be limited by 1.1682 resistance to bring fall resumption. On the downside, break of 1.1561 will target 1.1289 medium term fibonacci level. Nevertheless, sustained break of 1.1682 will bring stronger rebound back towards 1.1908 resistance.
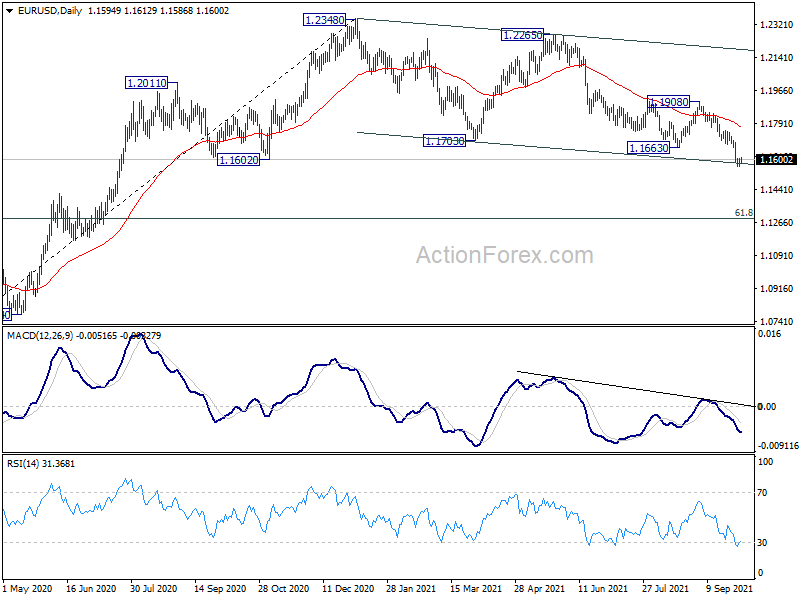
In the bigger picture, sustained break of 1.1602 will argue that rise from 1.0635 (2020 low) has completed at 1.2348. Deeper fall would be seen to 61.8% retracement of 1.0635 to 1.2348 at 1.1289. Note also that rejection by 55 week EMA (1.1830) also carries medium term bearish implication. Firm break of 1.1289 will pave the way to retest 1.0635 low. On the upside, though, break of 1.1908 resistance will revive medium term bullishness and turn focus back to 1.2348 high.
GBP/USD Daily Outlook
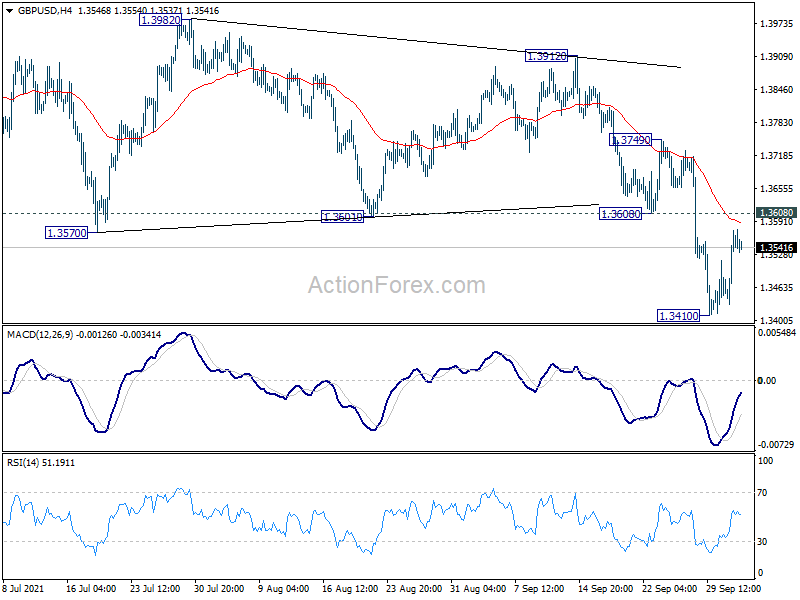
Daily Pivots: (S1) 1.3460; (P) 1.3518; (R1) 1.3602; More...
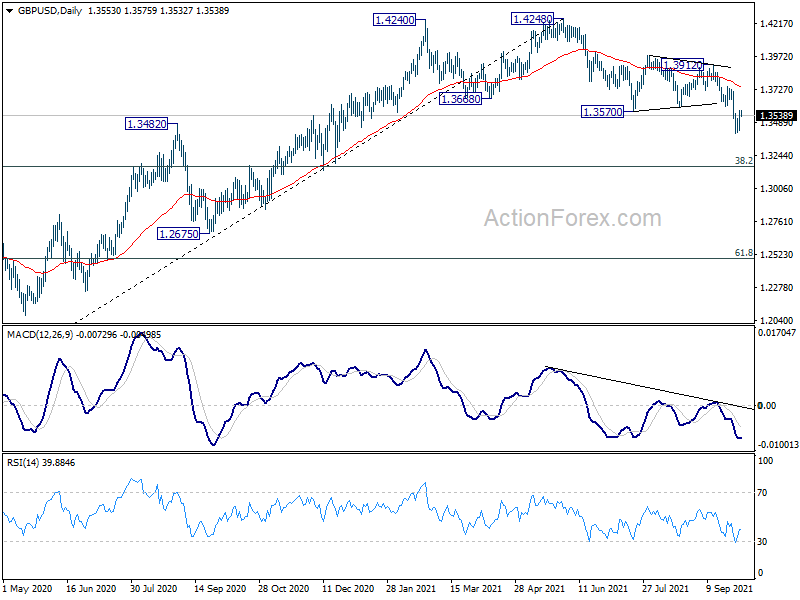
Intraday bias in GBP/USD remains neutral for the moment. Further fall is expected this week as long as 1.3608 support turned resistance holds. Break of 1.3410 will target 1.3164 medium term fibonacci level next. However, break of 1.3608 will turn bias back to the upside for stronger rebound.
In the bigger picture, fall from 1.4248 is at least a correction to the up trend from 1.1409 (2020 low). Such correction could extend to 38.2% retracement of 1.1409 to 1.4248 at 1.3164 before completion. However, considering the rejection by 1.4376 key resistance (2018 high), sustained trading below 1.3164 will argue that it's indeed a bearish trend reversal and would target 61.8% retracement at 1.2493. Nevertheless, break of 1.3912 resistance will revive medium term bullishness and target 1.4248/4376 resistance zone again.
USD/CHF Daily Outlook
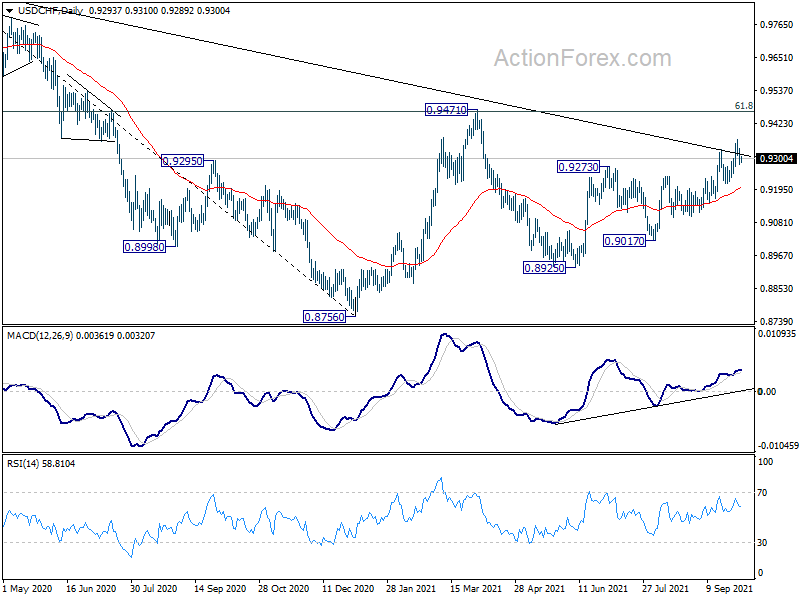
Daily Pivots: (S1) 0.9279; (P) 0.9308; (R1) 0.9334; More....
Intraday bias in USD/CHF remains neutral for the moment and some consolidations could be seen. On the upside, break of 0.9367 will resume the rise from 0.8925 to 0.9471 key resistance next. On the downside, however, break of 0.9214 will turn bias back to the downside for 0.9017 support again.
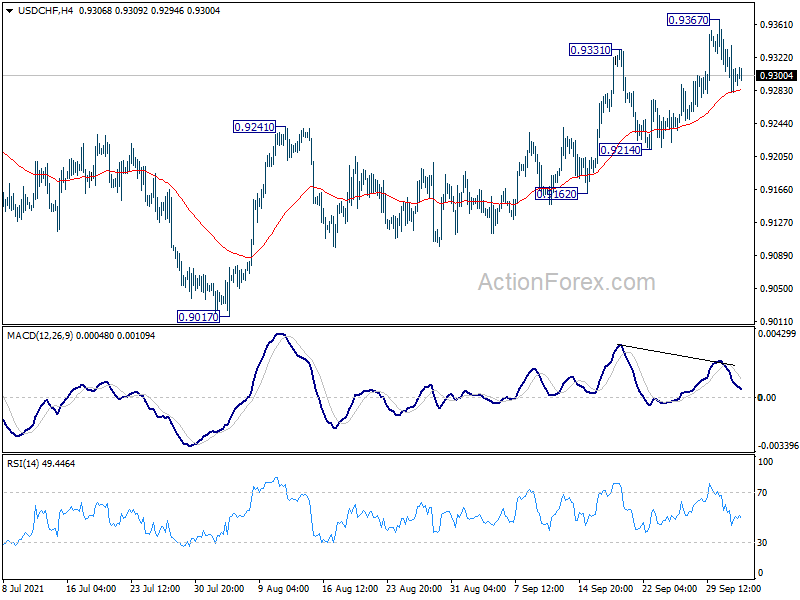
In the bigger picture, the strong rally above 55 week EMA (now at 0.9188) now tilts favor to the case of bullish trend reversal. That is, decline from 1.3042 (2016 high) is probably completed at 0.8756 already. Sustained break of 0.9471 resistance should confirm this case and pave the way to retest 1.0342 ahead. However, rejection by 0.9471 will mix up the outlook again and retain some medium term bearishness.