Sample Category Title
Market Morning Briefing: Pound Rose Well From 1.34 Last Week
STOCKS
Dow has recovered from the sharp fall seen last week and may continue to move up now while Dax still trades lower but needs to sustain above 15000 to slowly move up. Nikkei needs to sustain above crucial support at 28000 to move up eventually while Shanghai is bullish above 3500. Nifty and Sensex may move up today.
Dow (34326.46, +482.54, +1.43%) has bounced well from levels below 34000 seen last week. A rise to 34500-34750 and towards 35000 can be possible in the near term.
DAX (15156.44, -104.25, -0.68%) has fallen after a sharp bounce from 15000 seen last week. A rise to 15400-15500 cannot be negated if the index sustains above 15000.
Nikkei (28497.57, -273.50, -0.95%) has fallen sharply to test 28500 as expected. Breaking below 28500, we may now look for a test of 28000 which is a strong support and can hold to produce a bounce back to 29000-29500.
Shanghai (3568.17, +31.87, +0.90%) markets are closed till 7th October. While above 3500, view is bullish.
Nifty (17532.05, -86.10, -0.49%) made a low of 17452 before closing above 17500 last week. We expect the support level at 17400\200 to hold and produce a bounce towards 17600 to further see a steady rise towards 18000 in the medium term. A rise in Nifty can be seen today as it is the first week of new contract..
Sensex (58765.58, -360.78, -0.61%) has broken below the support level of 59000,a bounce form the level of 58500-58000 can be seen towards 59000-59500.
COMMODITIES
Crude prices have risen and could be stuck in a sideways range below immediate resistances of $80 on Brent and $76 on WTI. We would wait for price confirmation to indicate that a top is in place for the medium term. Gold has risen well and a sustained trade above 1760 can take it higher to 1780/90 on the upside. Silver can rise to 23-23.50 while above 21.50. Copper is bullish while above 4.05 and can test 4.25/35 soon. Possible sideways trade between respective supports and resistances look likely for now.
Brent (78.97) has immediate support near 77 (moved up from 76 mentioned in the last week) and a possible rise from 77 back to 80 cannot be negated. A range of 77-88 can hold for the very near term before a decline is seen towards 74 or lower in the medium term. As mentioned last week, we need to see a decisive break below 76 to confirm a reversal in Brent. WTI (75.53) on the other hand has immediate resistance near 76 which if holds can keep the price between 76 and 73 for sometime.
Gold (1762.60) if manages to rise above current levels can break above immediate trend resistance and head towards 1780/90 on the upside. On the downside, 1720 continues to hold as important support.
Silver (22.60) has risen well from 21.50 last week and while the bounce sustains, a test of 23-23.50 looks possible followed by a decline again from there.
Copper (4.1870) is holding well above 4.00 and the bounce seen on Friday needs to sustain above 4.25 in order to rise further to 4.35/40, else a dip from 4.25 can take the price down towards 4.05 again in the near term. Watch price action closely near current levels.
FOREX
Mixed view on currencies just now. Pound and Aussie have recovered a bit on Dollar weakness but unless a confirmation is seen that Dollar Index will not rebound to test 94.5 and remain lower, movement in Aussie and Pound could be dicey. Euro has bounced to 1.16 but unless a break above 1.17-1.1750 is seen in the medium term, we keep our bearish view of testing 1.15-1.14 intact. EURJPY may test support at 128 which if holds may produce a bounce to 130.50 else a fall to 127 cannot be negated. USDCNY can be ranged within 6.44-6.47/48. Any break below 6.44 can trigger a fall to 6.41/40. Watch a bounce in Dollar-Rupee from 74.0/10 else we may expect a test of 73.80 on the downside.
Dollar Index (94.04) tested 93.90 before bouncing back from there. If immediate interim support near 93.90/80 holds, we may see yet another rise from here towards 94.50 or higher, which could bring in fresh volatility in other currencies. Else a break below 93.80 is needed for the index to fall. For now watch price action within 93.80-94.50 region.
Euro (1.1598) tested 1.1562 and has bounced from there. It needs to sustain a rise above 1.16 to head higher to 1.1650-1.17 in the near term. Thereafter a fall back to current levels look possible. Any reversal signal will need a break above 1.1750. Till then we continue to keep intact a possible test of 1.15-1.14 in the medium term
EURJPY (128.81) has support near 128 which if holds can produce a bounce to 129-130.50 again in the medium term. Failure to rise from 128 can open chances of a further fall to 127-126. Watch price action near 128 for now.
Dollar-Yen (111.08) has declined sharply from 112.079 seen last week. As resistance near 112 holds, the pair may test 110.80-110.50 before again rising back from there.
Aussie (0.7260) is attempting to move up and can rise towards 0.7320 slowly in the near term. On the downside 0.7170 may hold well.
Pound (1.3539) rose well from 1.34 last week. A possible rise to 1.3650 looks possible before a decline is seen from there.
USDCNY (6.4452) may continue to old within 6.47/48-6.44 range and any break below 6.44 can lead to a fall towards 6.41/40.
USDINR (74.1250) #usdinr-candles-Daily} needs to break above 74.35 to test 74.50 else fall below 74.10/00 to head lower towards 73.80. A broad range of 73.80-74.40/50 and narrow range of 74.00/10-74.30 may hold for now.
INTEREST RATES
The US Treasury Yields have dipped further but have near-term supports which have to be broken to see a much deeper fall and avoid a fresh rise. The German yields have dipped slightly but remain bullish in the near-term to test their long-term resistances and then reverse lower to resume the broader downtrend. The 5Yr and 10Yr GoI are moving up in line with our expectation. They have key resistances ahead which if broken can see an extended rise this week.
The US 2Yr (0.26%), 5Yr (0.93%), 10Yr (1.46%) and the 30Yr (2.03%) %) have dipped further on Friday. The 10Yr sustains below 1.5%. A break below 1.4% from here will negate the chances of seeing 1.6% on the upside and drag it to 1.3% and lower again. The 30Yr must break below 2% to revisit 1.9%-1.8% levels and also negate the chances of seeing 2.1%-2.2% on the upside
The German 2Yr (-0.71), 5Yr (-0.59%), 10Yr (-0.23%) and 30Yr (0.25%) have dipped across tenors on Friday. The near-term view is bullish. The 30Yr can rise to 0.30%-0.35% while it sustains above 0.2%. The 10Yr has an immediate resistance at -0.2% a break above which can take it up to – 0.1%. Thereafter the yields can reverse lower and see a fresh fall.
The Indian 10Yr GoI (6.2436%)rose further to test 6.25% as expected. 6.26% is an important immediate resistance which if broken can take the 10Yr further up to 6.3%-6.32% - a key medium-term resistance. Thereafter a fresh fall is possible.
The 5Yr GoI (5.6899%) is heading up towards 5.7% in line with our expectation. Resistance is at 5.71%-5.72% which will need a watch. A break above can take the 5Yr up to 5.75%-5.76% again.
AUD/NZD to confirm in bullish reversal or not this week
AUD/NZD is a focus today with RBA and RBNZ featured. It started a rebound since mid September, even though market are expecting RBNZ to hike soon while RBA is still extending it's QE. The reactions to both central banks this week would determine whether the cross has indeed been reversing the down trend.
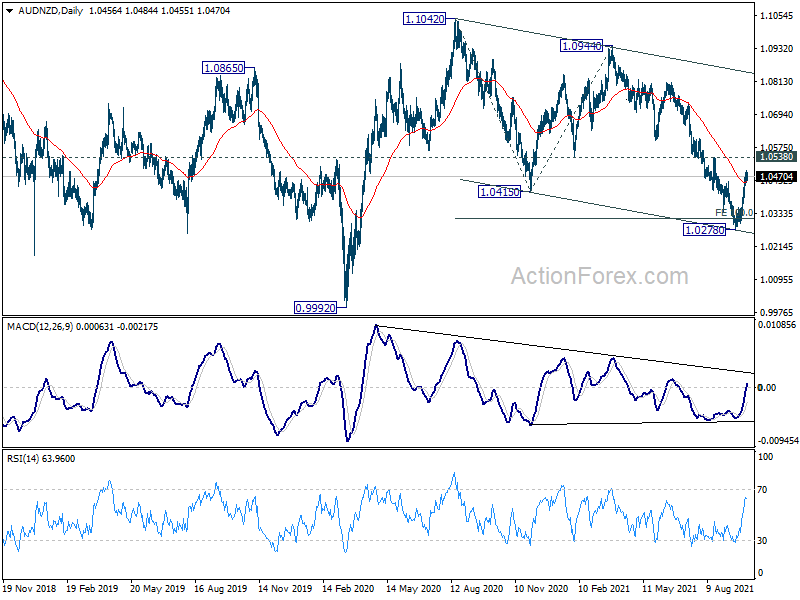
Technically, the conditions for a bullish reversal are there, with 55 day EMA broken. Also, fall from 1.1042, as a corrective move, has met it's target of 100% projection of 1.1042 to 1.0415 from 1.0944 at 1.0314 already, as well as the medium term channel support. Slight bullish convergence condition is also seen in daily MACD.
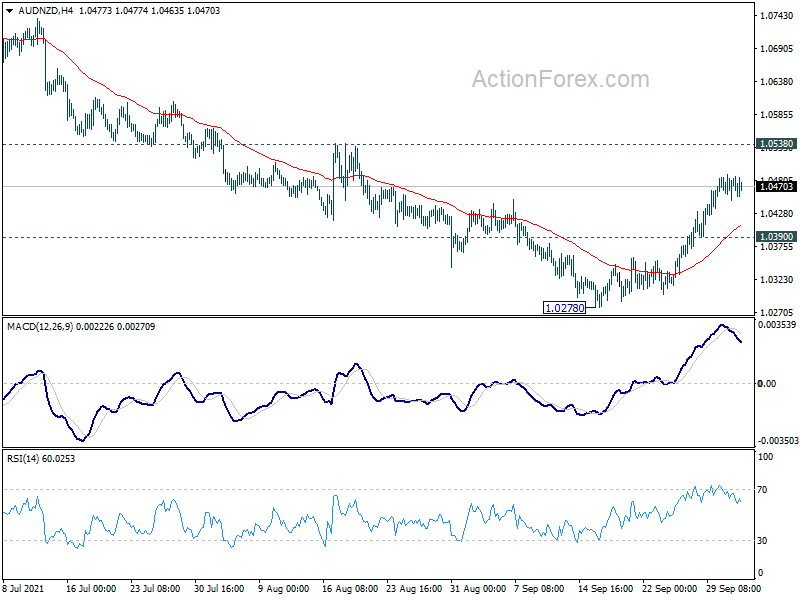
On the upside, sustained break of 1.0538 resistance will firstly indicates that fall from 1.0944 has completed. Also, whole fall from 1.1042 might also have finished with three waves down to 1.0278 too. Near term outlook will be turned bullish for an eventual retest on 1.0944/1042 resistance zone. However, failure to break through 1.0538, followed by break of 1.0390 minor support, will bring retest of 1.0278 low, and retain medium term bearishness instead.
EUR/USD: Recovery Could Be Limited Above 1.1650
Key Highlights
- EUR/USD extended its decline below the 1.1600 region.
- Two bearish trend lines are forming with resistance near 1.1650 and 1.1680 on the 4-hours chart.
- GBP/USD corrected higher after it traded close to 1.3400.
- Crude oil price remains elevated above $74.00, and gold price climbed above $1,750.
EUR/USD Technical Analysis
The Euro remained in a bearish zone below the 1.1750 level against the US Dollar. EUR/USD broke the 1.1650 and 1.1620 support levels to move further into a negative zone.
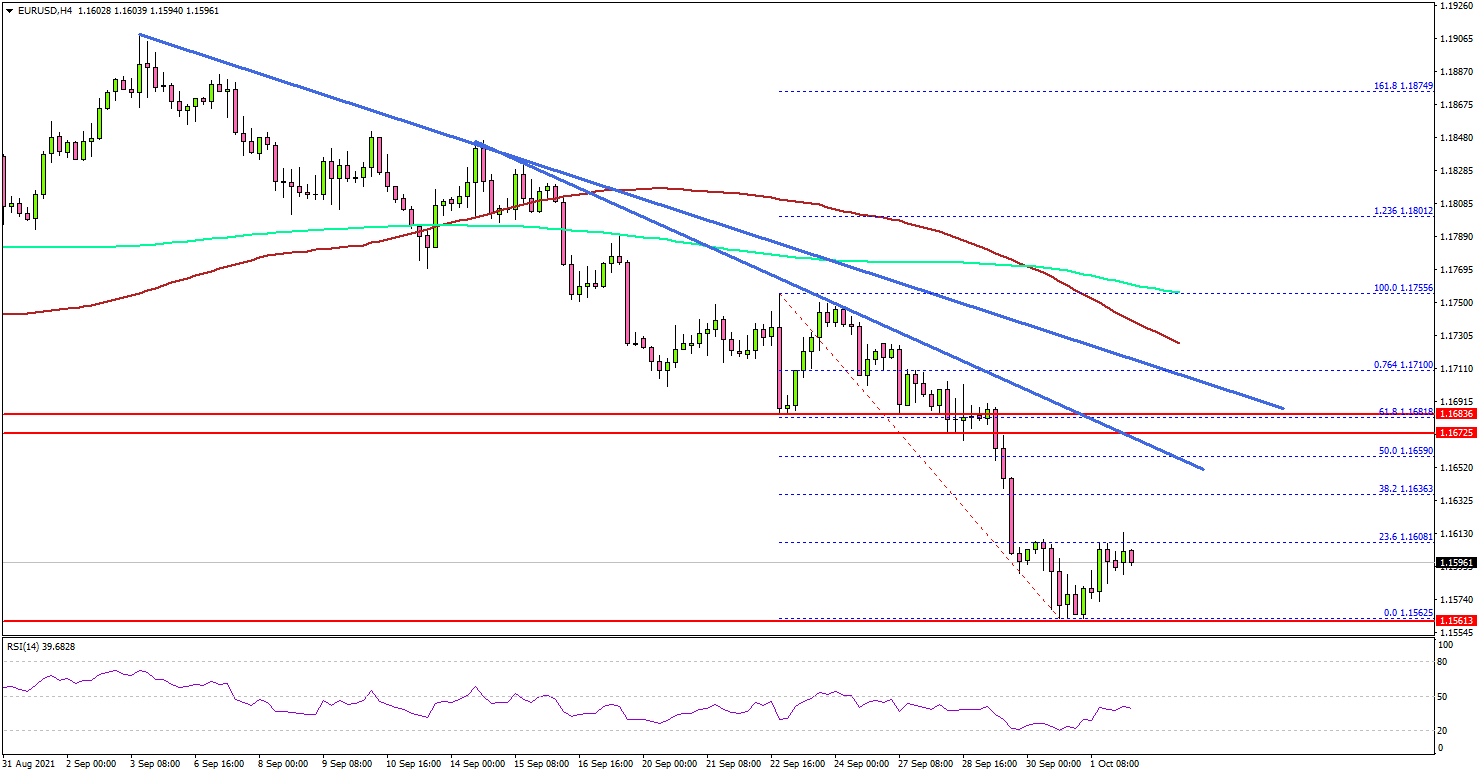
Looking at the 4-hours chart, there was also a break below the 1.1600 region. The pair settled below the 1.1650 level, the 100 simple moving average (red, 4-hours), and the 200 simple moving average (green, 4-hours).
It traded as low as 1.1562 and it is now consolidating losses. An initial hurdle on the upside is near the 1.1620 level. The first key resistance is near the 1.1650 level.
There are also two bearish trend lines forming with resistance near 1.1650 and 1.1680 on the same chart. An intermediate resistance could be near the 50% Fib retracement level of the downward move from the 1.1755 swing high to 1.1562 low.
The main resistance is now forming near the 1.1680 and 1.1700 levels. An initial support on the downside is near the 1.1565 level.
The next key support is near 1.1550, below which the pair may possibly continue lower. In the stated case, the price could test the 1.1420 level.
Looking at GBP/USD, the pair extended its decline below the 1.3450 level before it started an upside correction. Besides, USD/JPY corrected lower from 112.00, but it might find bids near 110.50.
Economic Releases
- US Factory Orders for August 2021 (MoM) - Forecast +0.9%, versus +0.4% previous.
RBNZ Ready Reckoner
The Ready Reckoner assesses how recent data will affect the RBNZ's OCR forecast.
The Ready Reckoner quantifies the impact that recent data will have on the Reserve Bank's Official Cash Rate forecast. The Ready Reckoner is meant to be a pure read on the balance of recent data, and is not a prediction of the RBNZ’s actions.
The August MPS projection was adjusted at the last minute to reflect the Covid lockdown that was announced the day before. That change appears to have been largely about timing, with the profile still suggesting OCR hikes in October and November. Further hikes were projected over the next few years, with the OCR rising above 2% by 2024.
The major developments since August have been the much stronger than expected starting point for GDP, against a growing risk of more prolonged Covid restrictions than the RBNZ had initially assumed. On balance we judge these to be a net positive for the Ready Reckoner, though we acknowledge that it’s quite uncertain how the RBNZ will approach the latter of these.
- August MPS implied OCR forecast (Q3 2023): 2.0%
- Net impact of shocks since August: +20bp
- Ready Reckoner estimate of new OCR forecast (Q3 2023): 2.2%
Near-term GDP: +20bp
The RBNZ expected a 0.7% rise in June quarter GDP. The actual result was a 2.8% increase; including revisions to previous quarters, GDP was 1.8% above the RBNZ’s forecast. On its own this would be a significant positive for the Ready Reckoner.
The latest Covid lockdown is hard to interpret from a Ready Reckoner point of view. What actually matters here is the output gap relative to potential. Lockdowns lead to a sharp drop in both actual and potential GDP, and experience has shown that both bounce back quickly once restrictions are lifted.
Nevertheless, it seems likely that this lockdown will halt some of the recent momentum that the economy had been building over the past year. In August the RBNZ had forecast 1.5% growth over the second half of 2021. If they reduced this to zero – i.e. a full rebound from lockdown over the December quarter, but nothing more – that would offset most of the June quarter GDP surprise.
Inflation expectations: +5bp
Year-ahead inflation expectations have risen sharply, to the top of the RBNZ’s 1-3% target range. However, longer-term expectations haven’t been surveyed since August, and market-based measures are little changed.
World economy: -5bp
Market forecasts of world growth for 2021 have been revised down since August.
- Total change: +20bp
Eco Data 10/4/21
[php_everywhere instance="1"]
RBA Preview – To Maintain Rate at Historical Low as Counterparts Begin Tightening
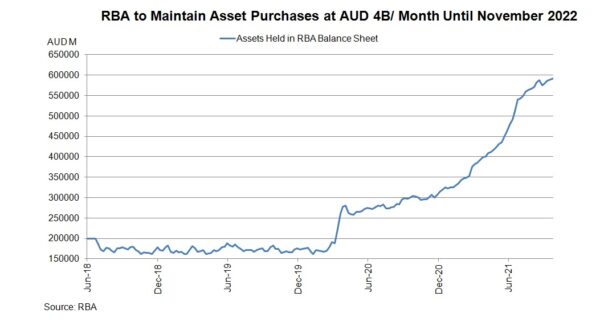
The RBA will maintain all monetary policy measures unchanged at next week’s meeting. That is, the cash rate, as well as the yield target on the April 2024 bond, will stay at 0.1%. Asset purchases will also be kept at a pace of AUD 4B/week. Policymakers will continue to warn of the slowdown in the third quarter but a ray of light is seen as the government plans to open border in November.
Economic Developments
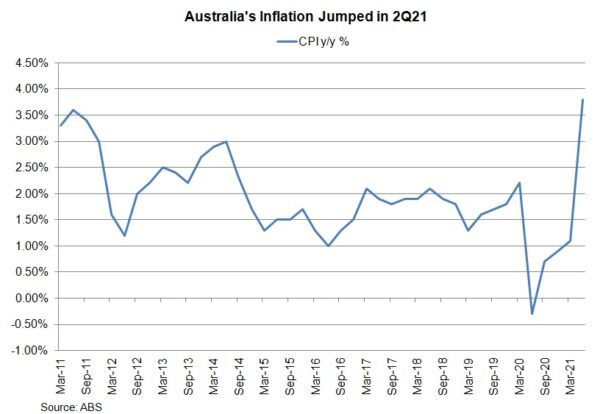
The August employment report is a mixed bag. The unemployment rate slipped -0.1 ppt to 4.5% in August, better than consensus of a rise to 4.9%. The number of jobs surprisingly slumped -146.3K, after a +3.1K in July. The decline mainly came from part-time employments. The participation rate dropped -0.8 ppt to 65.2%, lower than consensus of 65.7%. Recall that headline CPI jumped to +3.8% y/y, a level not seen since 4Q08. While third quarter inflation will only be in after the October meeting, ANZ's Roy Morgan consumer sentiment survey revealed that inflation expectations steadied at +5.1%, compared with historical reading of around 3.5%. Rising price pressure has somehow dampened consumer confidence, which slipped -5.1 points to 104.5 in September.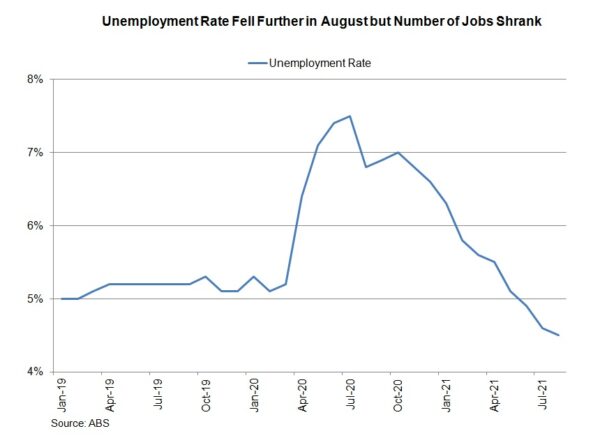
The economic momentum might have been derailed by the resurgence of the pandemic and the resultant restrictions. Yet, there is a light of hope that it will be back on track towards the end of the year as the government plans to reopen the border to international travelers. We expect policymakers to shed some positive light in this regard while cautioning about recent slowdown.
Monetary Policy
The RBA is expected to keep its monetary policy stance unchanged. In September, it reduced QE asset purchases to AUD 4B/week, from AUD 5B/ week previously. Yet, it pushed backward the timeline of its completion to “at least mid February 2022” from November 2021. The move was thus regarded as “dovish tapering”. Policymakers also left the cash rate unchanged at 0.1% and guided that there would be no rate hike until “actual inflation is sustainably within the 2 to 3% target range”, a condition unlikely to be met before 2024. We believe the strength of global inflation could be stronger and more persistent than previously anticipate, in particular exacerbated by the recent energy crisis. If the situation persists, policymakers in coming months could revise its inflation outlook, hence bringing forward the timing of the first rate hike.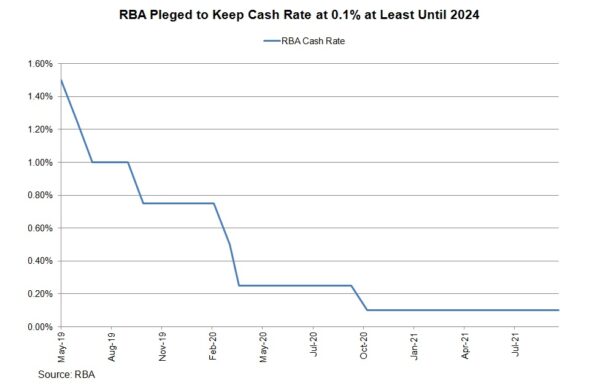
Forex and Cryptocurrencies Forecast
EUR/USD: Bears' New Win
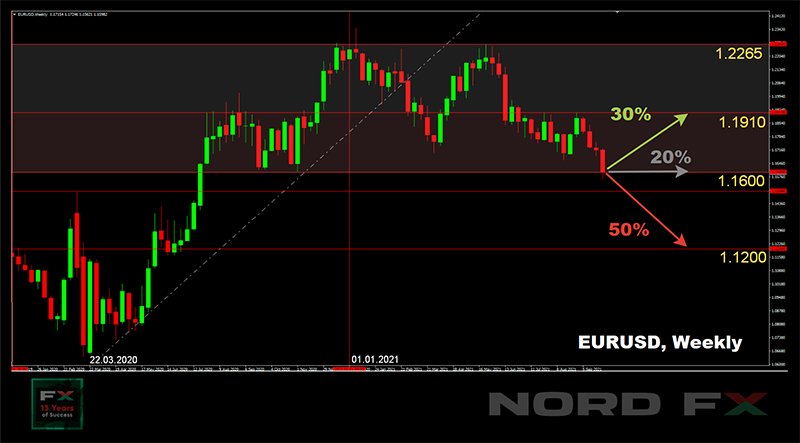
EUR/USD fell to 1.1562 last week, breaking through the key support level of 1.1630, which separated the bullish trend that began in March 2020 from the bearish trend.
September turned out to be the worst month for the US stock market, allowing the dollar to strengthen its position as a safe-haven asset. In addition, the Fed made it clear at its last meeting that it may be ready to begin a soft rollback of the monetary stimulus (QE) program in November. After that, the DXY dollar index posted its best monthly gain this year.
Things could have changed last Thursday. The US ended its fiscal year on September 30, and as of October 01, the country must live under a new budget, which is still not there. If President Biden had not signed legislation before midnight to increase the national debt limit, it would have threatened not only with the suspension of U.S. government, but also with a potential default. However, Biden approved lifting the limit at the very last moment, but only until December 3.
Amid the intrigue with government debt, the market hardly reacted to the contradictory US macro statistics, although the news from the labour market was not the most gratifying. For example, initial applications for unemployment benefits rose from 351,000 to 362,000, against the forecast decline to 335,000. The PMI index of Chicago in September fell from 66.8 to 64.7 points (against the forecast of 65 points). But the US GDP for the Q2 grew by 6.7% and turned out to be better than the forecast by 0.1%.
Governors of Central banks on both sides of the Atlantic remained cautious last week, leaving their escape routes. Fed Chairman Jerome Powell, speaking to members of the Senate, said once again that the acceleration of inflation should be replaced by its slowdown. The strong rise in prices, he said, is "driven by supply chain problems" that his department cannot control.
Almost the same statement was made by ECB Governor Christine Lagarde on Tuesday 28 September. She warned market participants against overreacting to the acceleration of inflation in the Eurozone, considering the phenomenon a temporary factor.
Consumer inflation rose 3.4% in September, the highest level in 13 years, according to Eurostat data. As for inflation in Germany, the main locomotive of the EU, it peaked in 29 years at 4.1%. According to preliminary forecasts, inflation in the Eurozone will approach 4% in Q4 and remain above 2% in the first half of 2022. According to analysts, such an increase is most likely caused by a sharp jump in energy prices.
These statistics and the fact that some market participants decided to close short EUR/USD positions at the end of the US fiscal year, recording gains, helped the common European currency a little, and the pair, having fought back from the local bottom, ended the five-day run at 1.1595.
As for the long-term forecast, many experts believe that the euro has no particular prospects. Some even believe that the pair will return to the spring 2020 lows by the end of next year. As for the near future forecast, 50% of analysts are in favor of a further decline in the pair. They are supported by 100% of trend indicators and 85% of oscillators on D1 (15% give signals that the pair is oversold). 20% vote for the sideways trend, and the remaining 30% of experts vote for the growth of the pair.
Support levels are 1.1560, 1.1500 and 1.1450. Resistance levels are 1.1685 1.1715, 1.1800, 1.1910.
Of the events to come, note the release of the ISM PMI in the US services sector on Tuesday October 05. Eurozone retail sales will be available on the following day, October 06. The ADP U.S. private employment report will also be released on that day, and another piece of data from the American labor market will arrive on Friday, October 08, including such an important indicator as the number of new jobs outside the agricultural sector (NFP).
GBP/USD: Bank of England vs US Fed
Last week ended with a bearish win for the GBP/USD pair as well. After starting at 1.3670 and losing 260 points, it bottomed at 1.3410 on Wednesday September 29. This was followed by a fairly powerful rebound and a finish at 1.3545.
Due to the US government debt situation, the market hardly paid attention to the encouraging macro statistics from the UK. But it turned out to be significantly better than forecast. Not only has the GDP drop in the Q1 2021 been revised down from minus 6.1% to 4.8%, but, with a forecast of minus 1.5%, it was 5.5% in Q2.
However, according to a number of experts, the growth of the pound at the end of the week is only indirectly related to these impressive positive statistics. The main reason is that the British currency has been strongly oversold: it has lost about 500 pips to the dollar since mid-September.
At the moment, 70% of experts predict that the pair will go south again to test support in the 1.3400 zone. The remaining 30% have taken a neutral position. As for technical analysis, it still sides with the bears as well: 85% of oscillators and trend indicators on D1 are colored red.
It should be noted that when we move to the forecast before the year end, the picture abruptly changes to the opposite: 70% of analysts already say that the GBP/USD pair will return to the 1.3900- 1.4000 zone. Moreover, a third of these 70% does not rule out that it can even reach the May-June highs of 1.4200-1.4250.
The nearest resistances along the way are 1.3600, 1.3690, 1.3765, 1.3810. Supports are in zones 1.3400, 1.3350 and 1.3185.
According to Citibank experts, the pound is currently supported by the following factors. First, there is a decrease in the number of hospitalizations in the UK due to COVID-19. UK assets are attractive both in terms of valuation and in terms of economic normalization after the pandemic. Secondly, it is a decrease in political risks associated with the negotiations between the EU and the UK on the Northern Ireland Protocol and the rejection of the referendum on Scottish independence. And of course, this is the decision of the Bank of England on a possible increase in the key interest rate to 0.25% in May 2022 and to 0.50% in December. Such prospects for UK monetary policy, according to analysts at Citibank, are "well placed to confront Fed policy."
USD/JPY: 112.00 Again
As predicted by most experts (60%), the USD/JPY pair managed to climb to 112.00 after the Fed's QE cut announcement, and even slightly higher, recording a high at 112.07. The forecast went on to say that it was unlikely to gain a foothold above this horizon. This is exactly what happened. Amid a drop in US government bond yields from 1.567% to 1.474% and a weaker dollar, the yen managed to recoup much of the losses at the end of the week and ended the trading session at 111.02.
Recall that unlike other central banks in developed countries, the Bank of Japan remains committed to ultra-soft monetary policy and negative interest rates. Therefore, the yen is still of interest not as a tool for making money, but as a safe haven currency.
At the moment, 50% of experts expect the pair to make another attempt to consolidate above the 112.00 horizon. 25% of analysts are neutral, and another 25% expect the pair to fall.
Support levels are unchanged: 110.45, 110.15, 109.60, 109.10, 108.70 and 108.30. The dream of the bears (it seems to be already impossible) is to retest the April low of 107.45. The nearest resistance levels are 111.00 and 111.65.
It should be noted that the USD/JPY pair has been moving along the 110.00 horizon since last March, making rare attempts to get out of the 108.30-111.00 trading channel. On this basis, the absolute majority of analysts believe that after the failed storm of 112.00, the pair will return to this trading range, where it will continue to move.
CRYPTOCURRENCIES: "Goodbye Bears"
According to statistics from the 99Bitcoins website, digital gold was predicted to die 37 times in 2021. Interestingly, this amount is 2.65 times higher than in 2020, during which BTC "passed away" only 14 times.
99Bitcoins has acted as the official repository for all bitcoin obituaries since 2010, with precise criteria for selecting such publications. The last registered obituary dates from September 21, 2021 and was written by renowned economist Steve Hanke of Johns Hopkins University, who stated that bitcoin is a highly speculative zero-value asset.
Another obituary may soon be registered, this one authored by entrepreneur Robert Kiyosaki. The other day, this best-selling author of "Rich Dad, Poor Dad" projected a "giant stock market collapse" due in October. The same fate awaits gold, silver and bitcoin, he said. The main reason for Kiyosaki's upcoming collapse is the Fed, which has started to sell too many Treasury bonds.
Another unhappy forecast was given by an analyst under the nickname PlanB, the author of the Stock-to-Flow (S2F) model. This model predicts the value of bitcoin based on the ratio of the asset's total available supply and its annual increase. Calculations by PlanB have recently showed that the bitcoin rate will exceed $100,000 at the end of this year. And now things have changed for the worse: according to the analyst, the price of the flagship coin could drop to $30,000 instead of rising.
Indeed, bitcoin dynamics did not bode well for the crypto market in September, with the BTC/USD pair falling to $39,666. However, the first day of October changed everything: bitcoin flew up, rising to $48,250. We have repeatedly noted the correlation between the stock and crypto markets, which is based on the risk appetite of investors. This time, too, the rise in the price of digital assets occurred in parallel with the rise of stock indices such as the S&P500 and Dow Jones.
An additional impetus for bitcoin could have been given by a surge in the volume of cryptocurrency derivatives exchanges. According to analyst Joseph Edwards of London-based firm Enigma Securities, derivatives trading often affects BTC spot prices. Another impetus may have been the decision by Iranian authorities to lift the ban on cryptocurrency mining.
Famous trader hailed the rise of the major cryptocurrency, exclaiming: "Goodbye bears ", and pointed to the move of leading altcoins into the green zone.
Another trader, billionaire Steven A. Cohen, owner of hedge fund SAC Capital Advisors, saw a perfect scenario for bitcoin that could steer it into future rallies. Cohen believes that BTC may still decline, while it is important its price doesn't fall below the 20-week simple moving average (SMA). This will be the key to creating bullish momentum that will push the the coin up to $64,000.
The 20-week SMA, coupled with the 21-week exponential moving average (EMA), is what Cowen calls the "bull market support band." In his view, it is crucial for bitcoin to stay above this band, as history shows that BTC tends to break through the first time it is retested.
The total crypto market capitalization rose again above the psychologically important threshold of $2.0 trillion on October 01 and stands at $2.06 trillion ($1.84 trillion a week ago). But the Crypto Fear & Greed Index is still in the Fear zone at 27 points.
And in conclusion, another tip in our joke crypto life hacks column. So what does it take to make money on cryptocurrencies? It turns out it's all about getting a hamster and giving it a chance to... trade. Over the past three months, the value of the portfolio of Mr. Goxx - a crypto trader hamster on the Twitch platform - has increased by 30%. Over the same time, Warren Buffett's Berkshire Hathaway fund assets fell 2%.
The hamster's owner built a special cage for it in June 2021, equipped with optical sensors that are connected to the Arduino Nano controller. Turning the running wheel, Mr. Goxx "selects" a specific cryptocurrency for trading. The program will sell the coin when the rodent runs through the left tunnel and will buy it if it passes through the right one.
The talented hamster managed to outperform not only Berkshire Hathaway, but also the S&P 500 (+6% over the same period) and NASDAQ 100 (+12%), as well as bitcoin itself (+23%).
EUR/USD Weekly Outlook
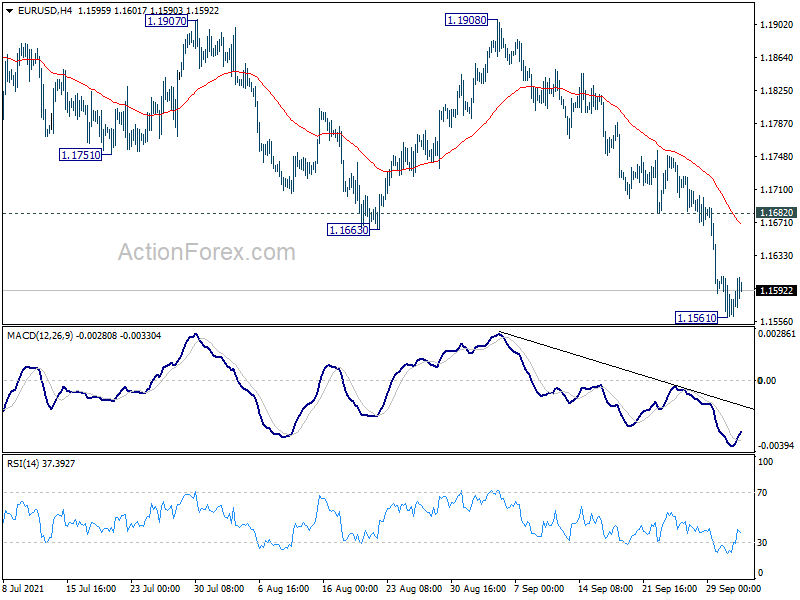
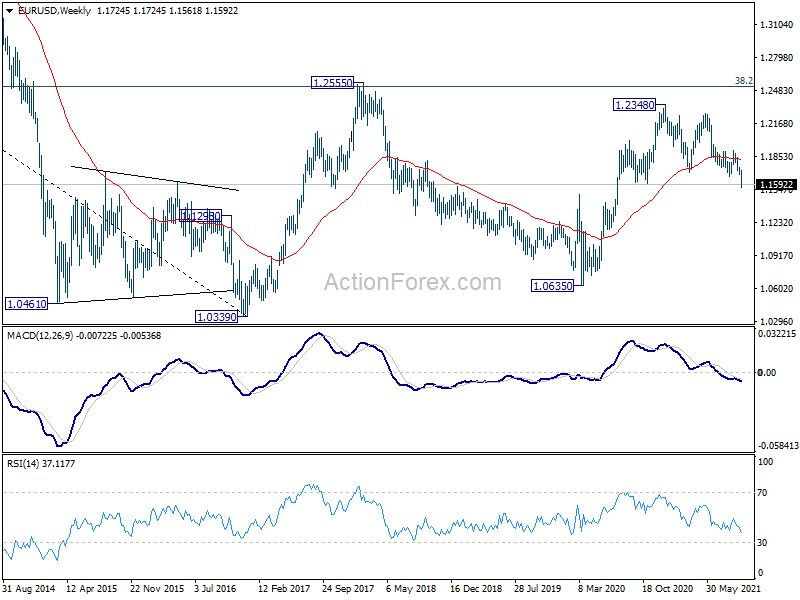
EUR/USD's fall from 1.2265, as well as the pattern from 1.2348, finally resumed by taking out 1.1663 support last week. A temporary bottom is likely formed at 1.1561 as it lost momentum. Initial bias is neutral this week first. Upside of recovery should be limited by 1.1682 resistance to bring fall resumption. On the downside, break of 1.1561 will target 1.1289 medium term fibonacci level. Nevertheless, sustained break of 1.1682 will bring stronger rebound back towards 1.1908 resistance.
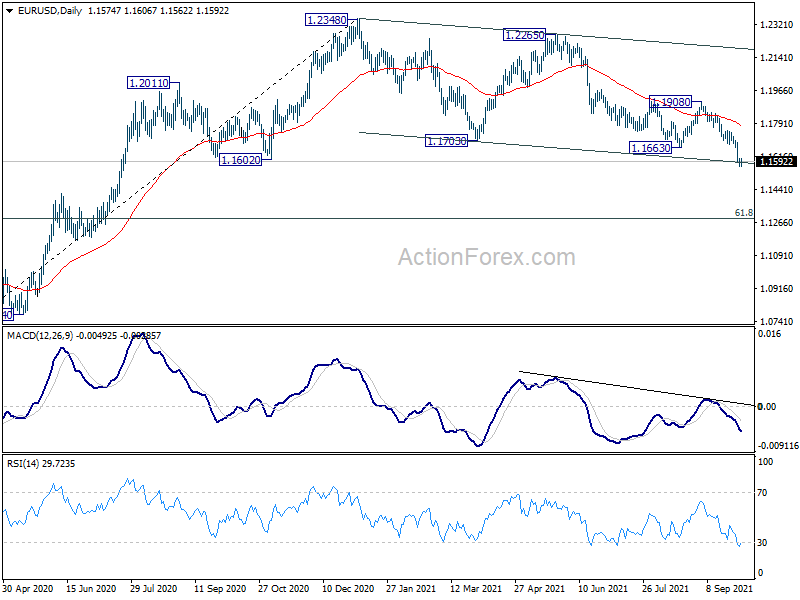
In the bigger picture, sustained break of 1.1602 will argue that rise from 1.0635 (2020 low) has completed at 1.2348. Deeper fall would be seen to 61.8% retracement of 1.0635 to 1.2348 at 1.1289. Note also that rejection by 55 week EMA (1.1830) also carries medium term bearish implication. Firm break of 1.1289 will pave the way to retest 1.0635 low. On the upside, though, break of 1.1908 resistance will revive medium term bullishness and turn focus back to 1.2348 high.
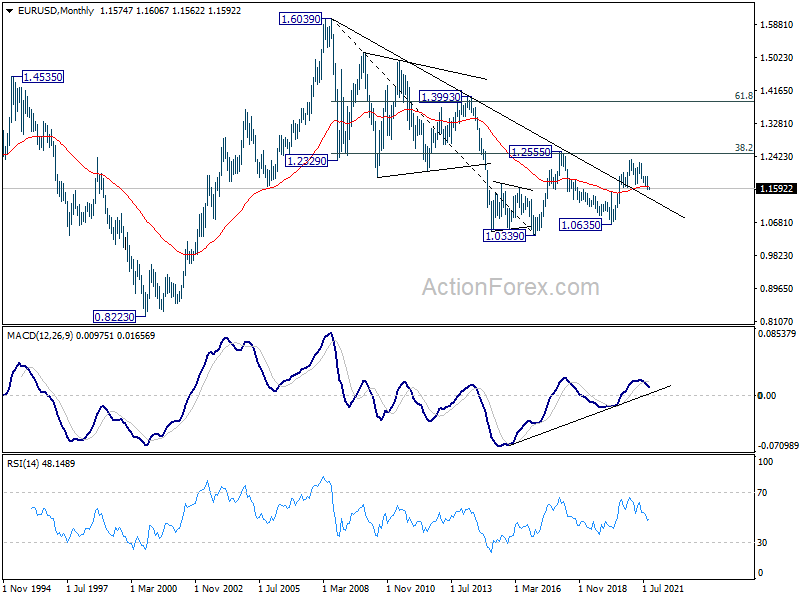
In the long term picture, EUR/USD has possibly failed 1.2555 cluster resistance (38.2% retracement of 1.6039 to 1.0339 at 1.2516) already. Long term outlook will remain neutral as sideway pattern from 1.0339 (2017 low) is extending with another medium term fall. For now, we'd hold back from assessing the change of downside breakout, and monitor the momentum of the decline from 1.2348 first.
USD/JPY Weekly Outlook
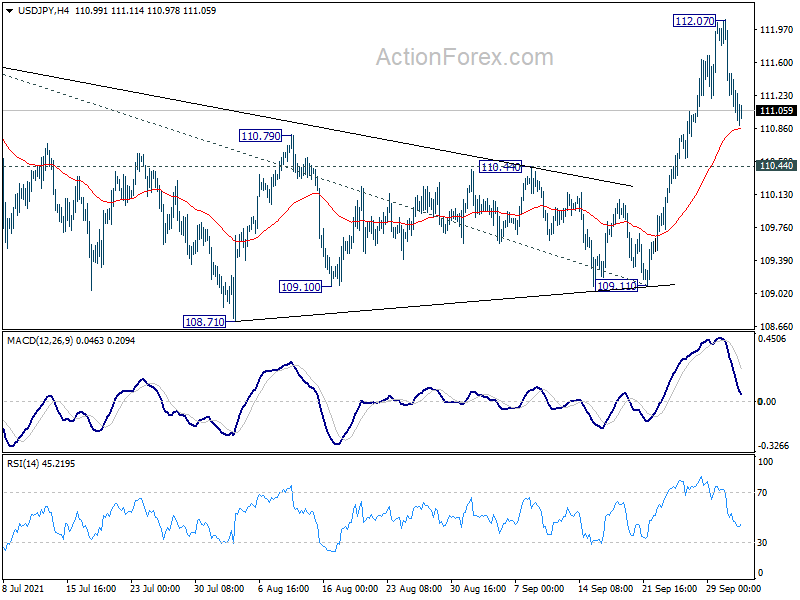
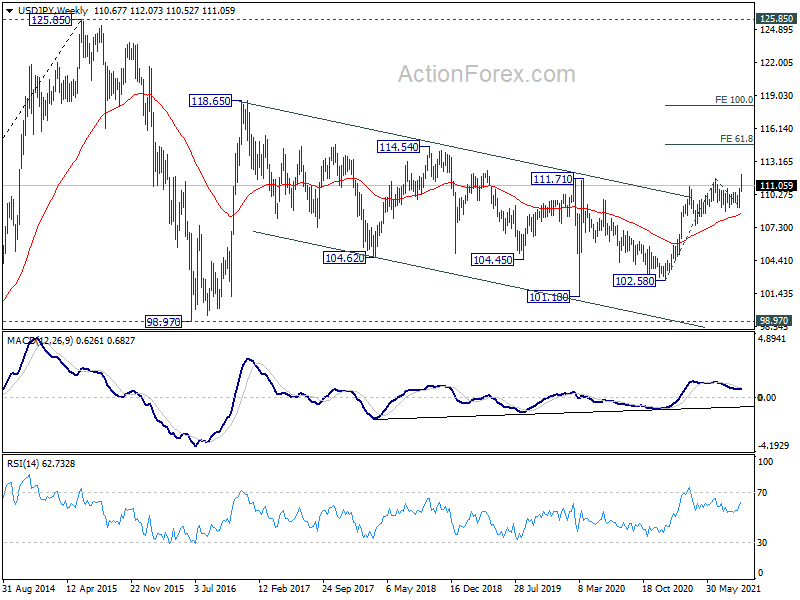
USD/JPY finally broke 111.65 resistance last week to resume the whole rise from 102.58. But it retreated after hitting 112.07. Initial bias is neutral this week for some consolidations first. Downside of retreat should be contained by 110.44 support to bring another rally. On the upside, above 112.07 will extend larger rise to 61.8% projection of 102.58 to 111.65 from 109.11 at 114.71 next. However, break of 110.44 will dampen the bullish case and turn focus back to 109.11 support.
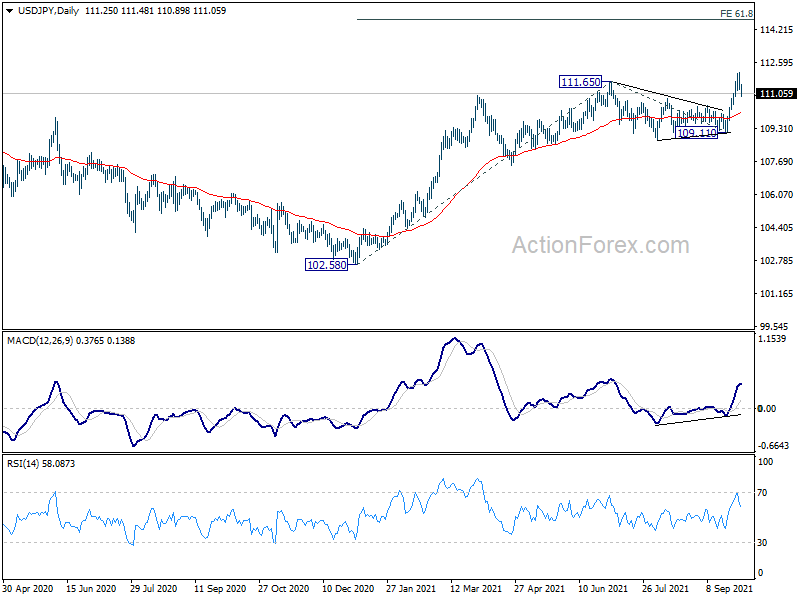
In the bigger picture, break of 111.71 resistance suggests that the whole corrective decline from 118.65 (2016 high) has completed at 101.18 (2020 low) already. Medium term bullishness is also affirmed as USD/JPY stays well above 55 week EMA (now at 108.60). Sustained trading above 111.71 will affirm this bullish case. Rise from 101.18 could then be resuming whole rally from 98.97 (2016 low) through 118.65. This will now be the preferred case as long as 108.71 support holds.
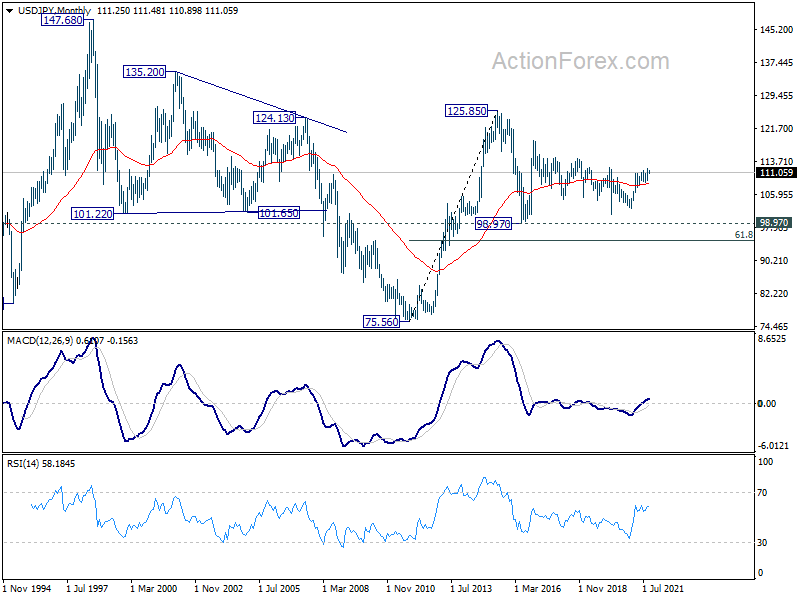
In the long term picture, the rise from 75.56 (2011 low) long term bottom to 125.85 (2015 high) is viewed as an impulsive move, no change in this view. Price actions from 125.85 are seen as a corrective pattern which could still extend. In case of deeper fall, downside should be contained by 61.8% retracement of 75.56 to 125.85 at 94.77. Up trend from 75.56 is expected to resume at a later stage for above 135.20/147.68 resistance zone.
GBP/USD Weekly Outlook
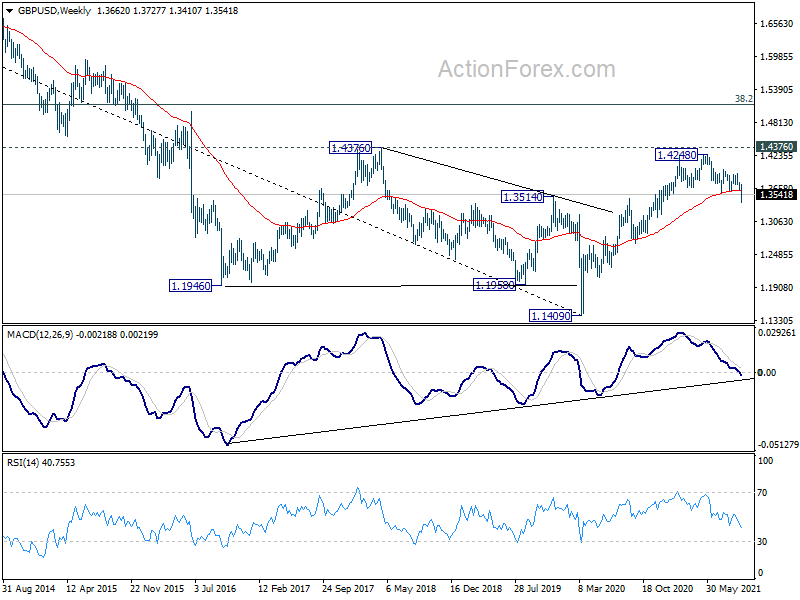
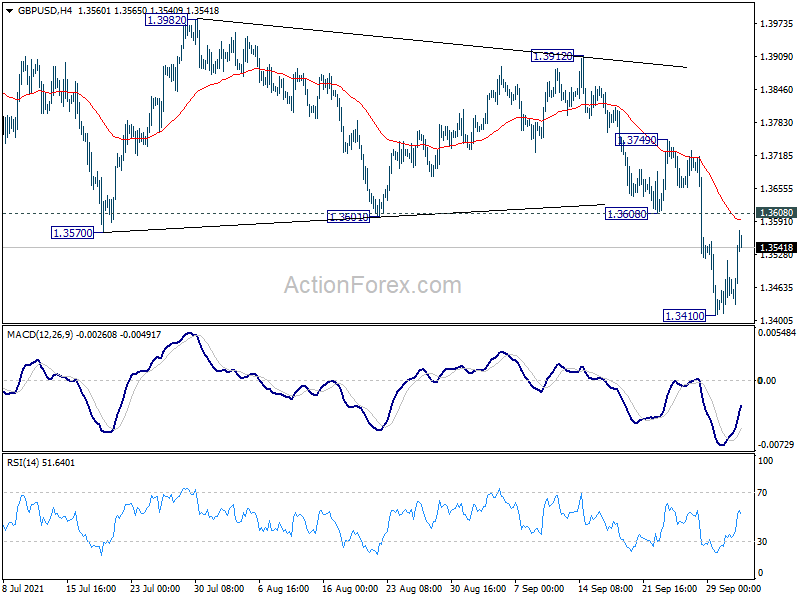
GBP/USD's fall from 1.4248 resumed last week and hit as low as 1.3410. But bias is turned neutral with subsequent recovery. Further fall is expected this week as long as 1.3608 support turned resistance holds. Break of 1.3410 will target 1.3164 medium term fibonacci level next. However, break of 1.3608 will turn bias back to the upside for stronger rebound.
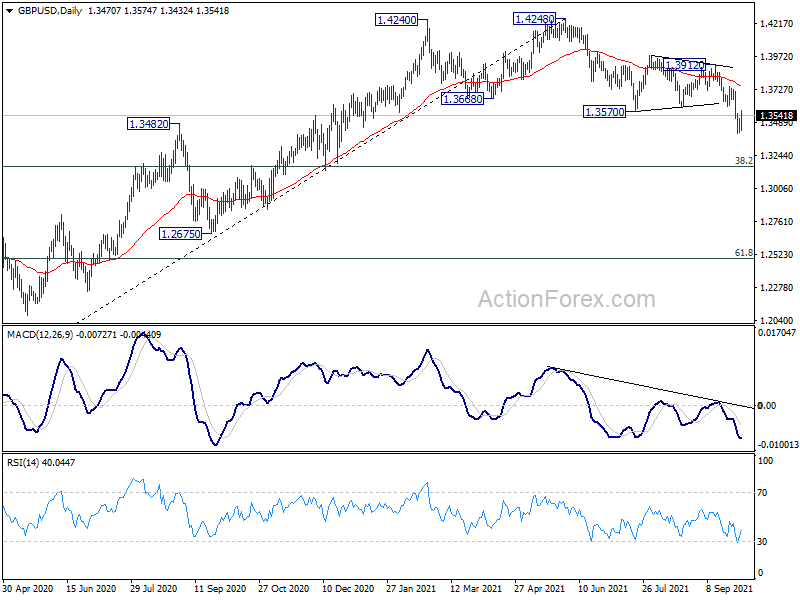
In the bigger picture, fall from 1.4248 is at least a correction to the up trend from 1.1409 (2020 low). Such correction could extend to 38.2% retracement of 1.1409 to 1.4248 at 1.3164 before completion. However, considering the rejection by 1.4376 key resistance (2018 high), sustained trading below 1.3164 will argue that it's indeed a bearish trend reversal and would target 61.8% retracement at 1.2493. Nevertheless, break of 1.3912 resistance will revive medium term bullishness and target 1.4248/4376 resistance zone again.
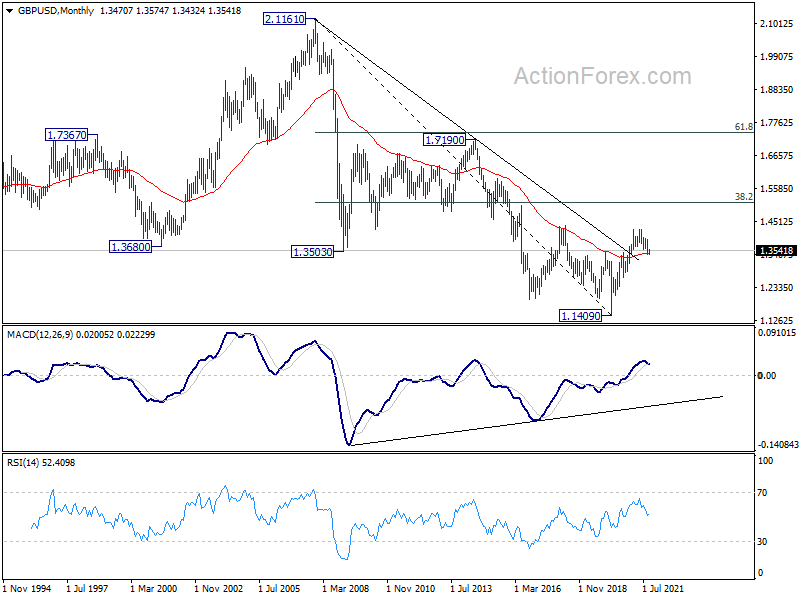
In the longer term picture, a long term bottom should be in place at 1.1409, on bullish convergence condition in monthly MACD. Rise from there would target 38.2% retracement of 2.1161 to 1.1409 at 1.5134. Reaction from there would reveal whether rise from 1.1409 is just a correction, or developing into a long term up trend.