Sample Category Title
US: Consumer Spending Better Than Expected, But Price Pressures Endure
Personal income grew by 0.2% m/m in August, in line with the consensus estimate. Compensation of employees (+0.4% m/m) was the highest contributor to growth, as employment continued to make gains in August. Excluding price changes and taxes, real personal disposable income was lower by 0.3% m/m.
Nominal spending advanced by 0.8% m/m, a tick higher than 0.7% anticipated by the consensus, but from a downwardly revised July (-0.1% from 0.3% originally). Spending on services increased by 0.6% m/m, but was slower than the 1.1% trend of the previous three months - likely a reflection of an increased adherence to physical distancing due to a spike in COVID-19 cases. Meantime, spending on goods accelerated, rising by 1.2% m/m (with a reading of -0.4% m/m for durables and 2.1% for non-durables).
Removing the price impact, real spending increased by 0.4% m/m, as expected by the consensus estimates. Real services rose by 0.3%, while goods gained 0.6% m/m.
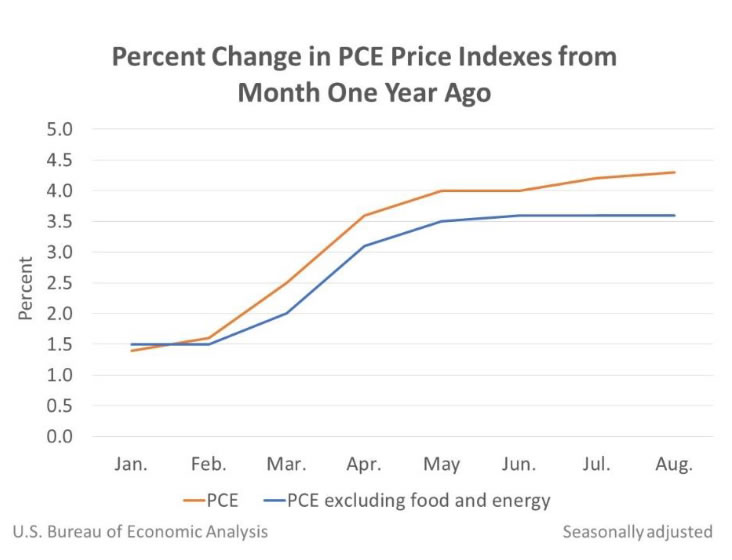
The overall PCE price deflator rose by 0.4% m/m and 4.3% y/y in August – slightly faster than 4.2% y/y growth in July. The Fed's preferred measure of inflation – core PCE price index – remained on par with July's gains, rising by 0.3% m/m and 3.6% y/y, on par with the consensus expectation.
The personal saving rate remained elevated at 9.4% - well above its normal rate of 7.5% observed before the pandemic.
Key Implications
Today's report proved consumers to be more resilient than expected. A closer look at the composition of expenditures suggests that Delta-related caution played the lead role in slowing the rebalancing from goods to services, at least in August. Higher frequency data points to this pause extending into the early September, but reversing recently, raising hopes that the latest wave of caution is cresting. With this weakness incorporated, our forecast calls for around 3% (annualized) growth in real consumption in the second half of 2021.
Decent personal income growth is a positive sign, especially given it stems from an increase in employment income, which is taking over government income programs in supporting consumption. If sustained, this pace of growth might give an additional boost to spending, especially when combined with a backup power of excess saving.
Strong price growth puts more pressure on the Fed amid the growing agreement that supply bottlenecks may extend price pressures into the next year. This week, Federal Reserve Chairman Jerome Powell acknowledged that these constraints may prove to be "greater and more enduring than anticipated" and gave indications that the Fed is prepared to act more aggressively if needed. Still, for now, the Fed is only comfortable to start reducing its asset purchases, which we expect to start by the end of the year. The policy rate should remain near zero until more progress in the labor market is achieved.
Canada: GDP Contracts in July, But Rebound Expected in August
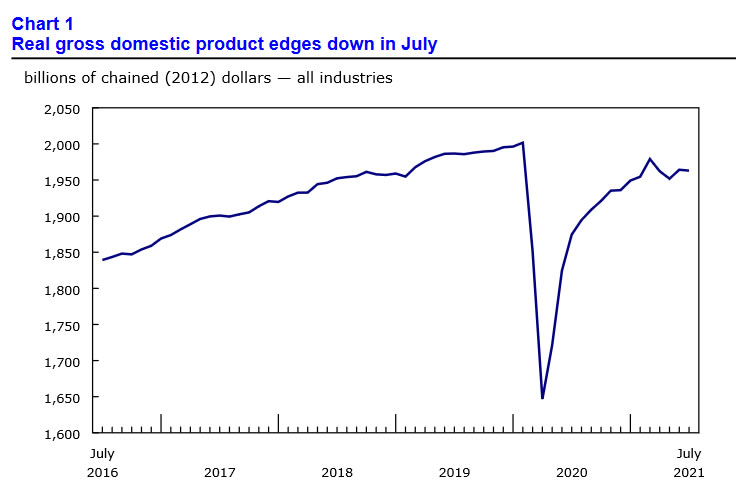
The Canadian economy contracted in July as GDP declined by 0.1% month-on-month, a touch above the consensus call for -0.2%. This left GDP around 2% below its pre-pandemic (February 2020) level.
In addition to July GDP, Statistics Canada released a flash estimate for August, which showed a 0.7% increase in output for the month.
By industry, gains in services-producing (+0.4%) industries were more than offset by declines in goods-producing (-1.4%) areas of the economy. The strongest advance was in accommodation and food services (+12.5%) as provinces continued to lift public health restrictions in July. The arts, entertainment and recreation sector also benefited from reopening measures with output rising 8.1% on the month. Another top performer was transportation and warehousing (+1.1%), which was boosted by greater domestic and international air travel.
On the flipside, record-setting heat and drought conditions in Western Canada resulted in a 5.5% decline in agriculture, forestry, fishing and hunting output. Crop production dropped 13.2% in July. Manufacturing output (-1.1%) also fell due to declines in durable-goods manufacturing which could have been held back by supply shortages. GDP contracted for a third consecutive month for the construction industry (-0.9%) in July as residential building activity (-2.7%) continued to cool that month. Wholesale trade (-1.9%) was another industry to suffer a decline in July.
Key Implications
It was a lacklustre July for the Canadian economy. Extreme heat weakened agricultural production, while manufacturing and wholesale trade were likely weighed down by supply shortages. Cooling housing activity hit construction output. Excluding these sectors, GDP would have improved by 0.3% in July.
Indeed, further reopening across the country fueled a very strong rebound in high-touch services (i.e. accommodation and food services and arts, entertainment and recreation) as Canadians reoriented their spending from goods towards activities that had long been restricted to them. This strength continued into August and is a key reason for Statistics Canada's healthy flash GDP estimate for that month.
So, it appears the Canadian economy ended the summer on a high note, but the fall season could lower the octave. Cooling weather and the resurgence of the pandemic (already occurring in Alberta and Saskatchewan) could dampen enthusiasm for recreational activities. At the same time, Canadians are likely to not redirect spending toward goods, an area which they had indulged during most of the pandemic. This could test the resilience of the economy in the months ahead.
Pound Rises as US Dollar Eases
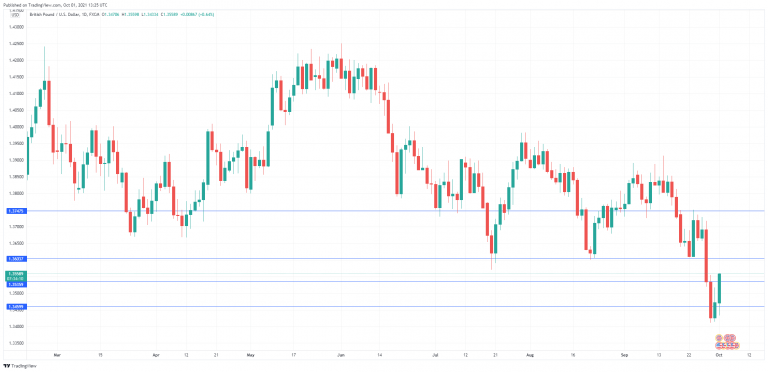
The British pound has extended its gains in the Friday session. GBP/USD is currently trading at 1.3555, up 0.58% on the day.
UK Manufacturing PMI slows
The UK economy continues to recover from the Covid pandemic. However, the unleashing of demand from consumers and businesses has resulted in a host of problems for the manufacturing sector. These include supply chain bottlenecks, higher material costs and worker shortages. These problems resulted in a slowdown of the sector in September, as the Manufacturing PMI fell to 57.1, down from 60.3 in August. Although we continue to see growth in manufacturing, the rate of expansion has eased for a fourth consecutive month, and the September reading marked a seven-month low. Still, manufacturers remain optimistic about being able to meet new orders, and investors are unlikely to get nervous unless the PMI slips close to the 50-level, which separates expansion from contraction.
In the US, there are plenty of matters for investors to fret about as we end the trading week; namely, the debt ceiling and possible government shutdown, as well as the build-back-better infrastructure bill which President Biden is trying to get past the House of Representatives.
Lawmakers have reached a deal to fund the government until December 3, which is really kicking the can down the road until the issue must again be addressed. The House had scheduled a vote on the infrastructure bill for late Thursday, but House Speaker Nancy Pelosi was forced to pull the bill and delay a vote since the opposition of Republicans and progressive Democrats meant that there were not enough votes in favor of the bill. These difficulties point to the weakness of President Biden, who faces still opposition not just from Republicans, but from progressive Democrat lawmakers as well. Until the debt ceiling issue is resolved, risk aversion will likely remain high, which is bullish for the US dollar.
GBP/USD Technical Analysis
- 1.3603 has weakened in resistance. 1.3747 is the next resistance line
- 1.3535 is fluid as a support level. Below, there is support at 1.3459
USD/JPY Mid-Day Outlook
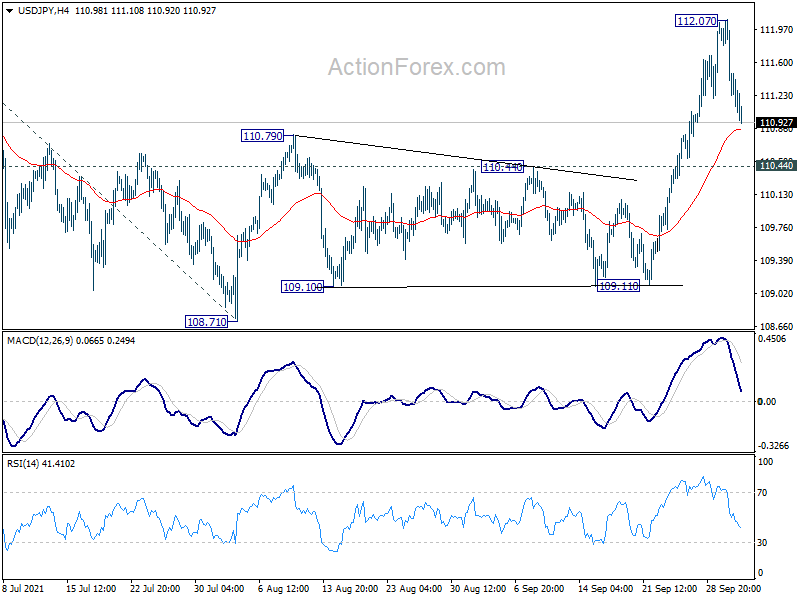
Daily Pivots: (S1) 110.99; (P) 111.53; (R1) 111.83; More...
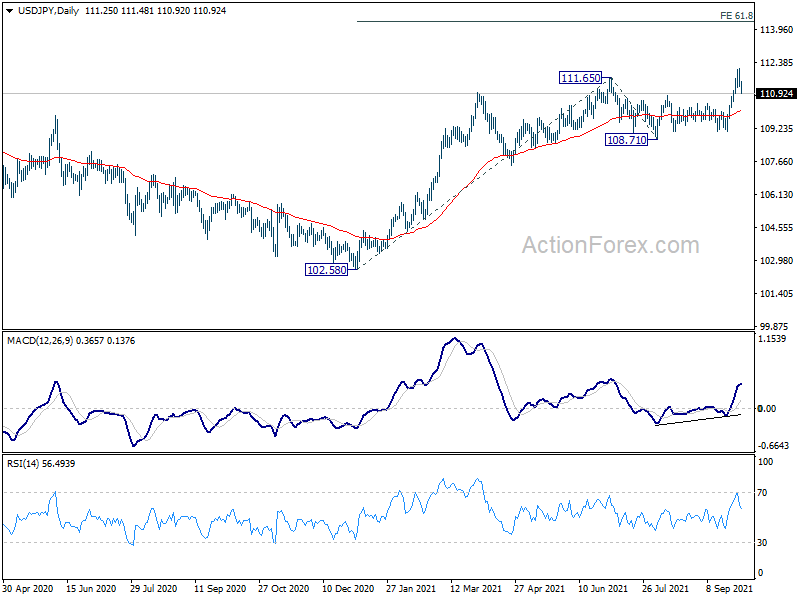
Intraday bias in USD/JPY stays neutral first. Downside of retreat should be contained by 110.44 support to bring another rally. On the upside, above 112.07 will extend larger rise to 61.8% projection of 102.58 to 111.65 from 108.71 at 114.31 next. However, break of 110.44 will dampen the bullish case and turn focus back to 108.71 support.
In the bigger picture, break of 111.71 resistance suggests that the whole corrective decline from 118.65 (2016 high) has completed at 101.18 (2020 low) already. Medium term bullishness is also affirmed as USD/JPY stays well above 55 week EMA (now at 108.60). Sustained trading above 111.71 will affirm this bullish case. Rise from 101.18 could then be resuming whole rally from 98.97 (2016 low) through 118.65. This will now be the preferred case as long as 108.71 support holds.
USD/CHF Mid-Day Outlook
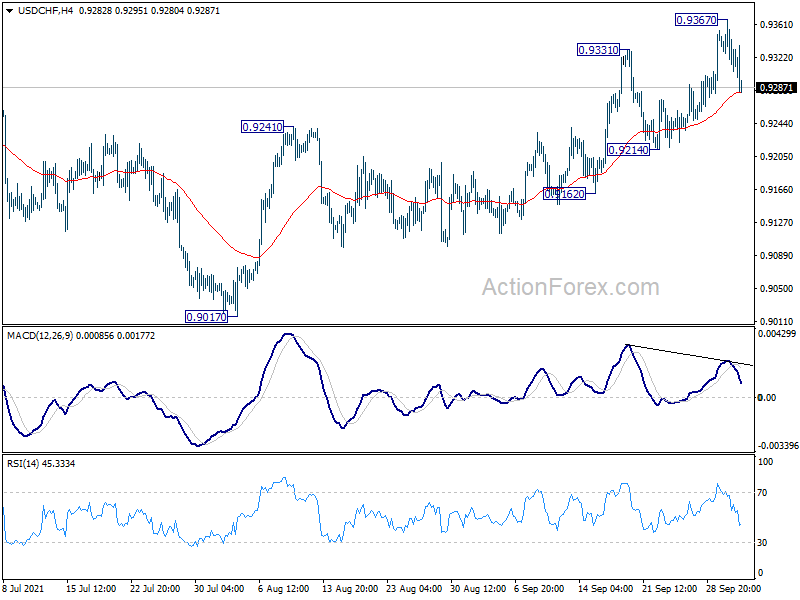
Daily Pivots: (S1) 0.9300; (P) 0.9327; (R1) 0.9375; More....
Intraday bias in USD/CHF remains neutral for the moment. Further rally will remain in favor as long as 0.9214 support holds. On the upside, break of 0.9367 will resume the rise from 0.8925 to 0.9471 key resistance next. However, break of 0.9214 will turn bias back to the downside for 0.9017 support again.
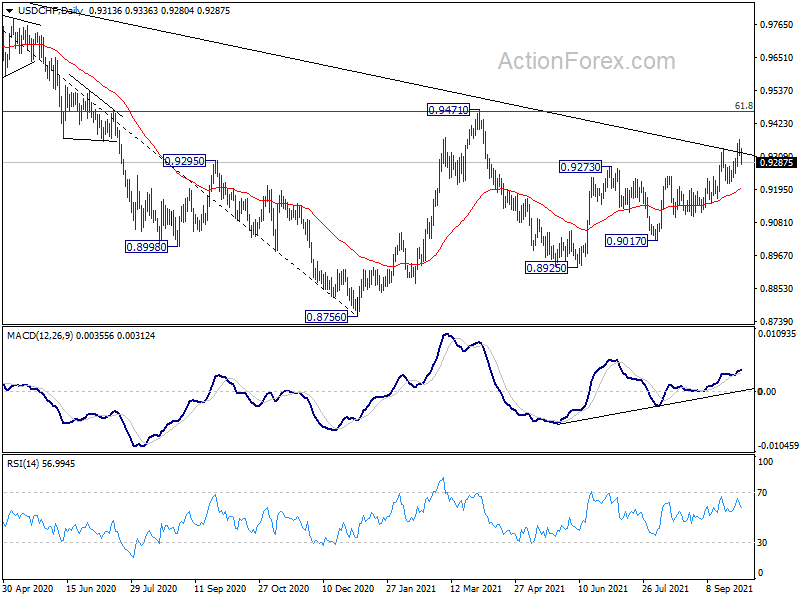
In the bigger picture, the strong rally above 55 week EMA (now at 0.9190) now tilts favor to the case of bullish trend reversal. That is, decline from 1.3042 (2016 high) is probably completed at 0.8756 already. Sustained break of 0.9471 resistance should confirm this case and pave the way to retest 1.0342 ahead. However, rejection by 0.9471 will mix up the outlook again and retain some medium term bearishness.
GBP/USD Mid-Day Outlook
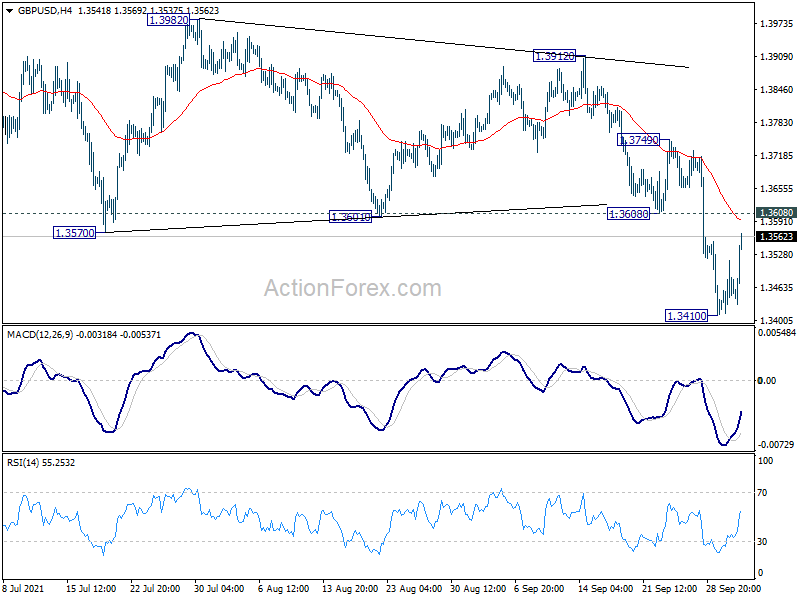
Daily Pivots: (S1) 1.3418; (P) 1.3467; (R1) 1.3519; More...
Intraday bias in GBP/USD remains neutral for the moment. Further fall is expected as long as 1.3608 support turned resistance holds. Below 1.3410 will extend the fall form 1.4248 to 1.3163 medium term fibonacci level next. Nevertheless, firm break of 1.3608 will turn bias back to the upside for stronger rebound.
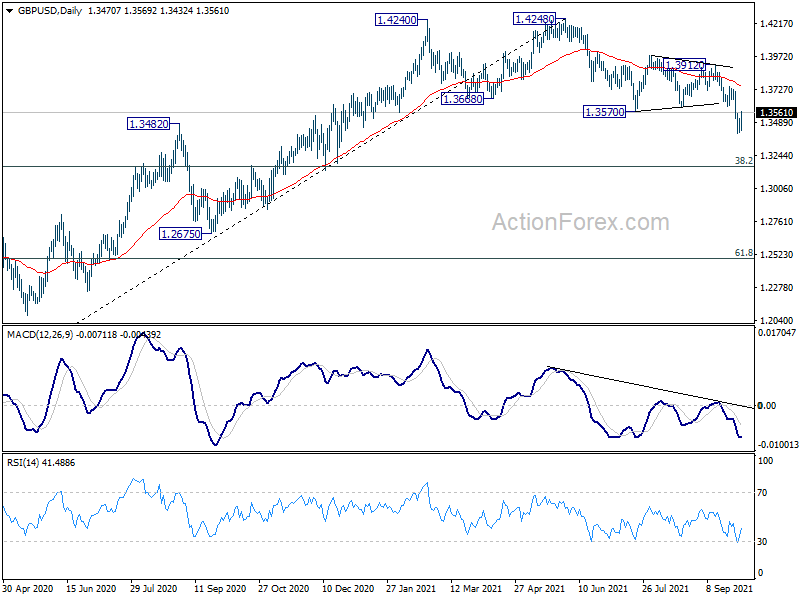
In the bigger picture, fall from 1.4248 is at least a correction to the up trend from 1.1409 (2020 low). Such correction could extend to 38.2% retracement of 1.1409 to 1.4248 at 1.3164 before completion. However, considering the rejection by 1.4376 key resistance (2018 high), sustained trading below 1.3164 will argue that it's indeed a bearish trend reversal and would target 61.8% retracement at 1.2493. Nevertheless, break of 1.3912 resistance will revive medium term bullishness and target 1.4248/4376 resistance zone again.
EUR/USD Mid-Day Outlook
Daily Pivots: (S1) 1.1556; (P) 1.1583; (R1) 1.1603; More...
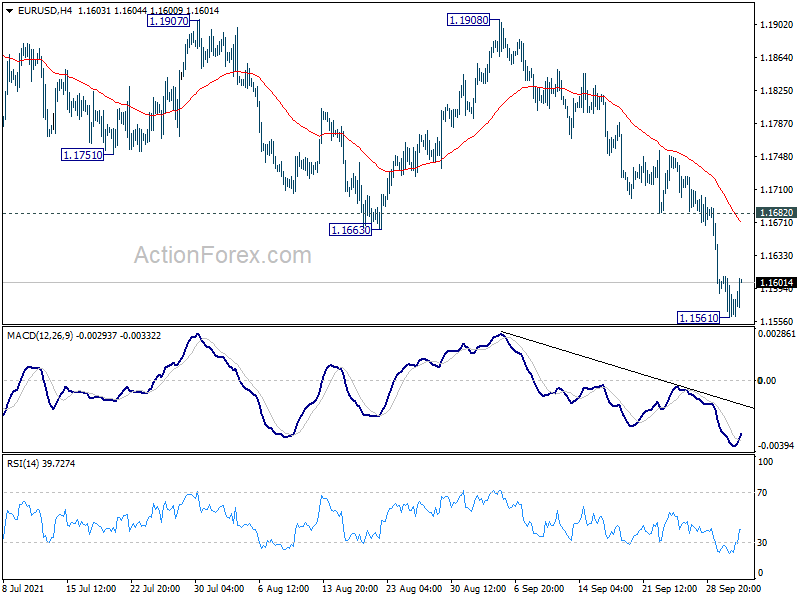
Intraday bias in EUR/USD is turned neutral with 4 hour MACD crossed above signal line. Upside of recovery should be limited by 1.1682 resistance to bring another fall. On the downside, break of 1.1561 will extend the whole fall from 1.2348, as a correction to whole rise from 1.0634. Next target is 1.1289 medium term fibonacci level. Nevertheless, sustained break of 1.1682 will bring stronger rebound back towards 1.1908 resistance.
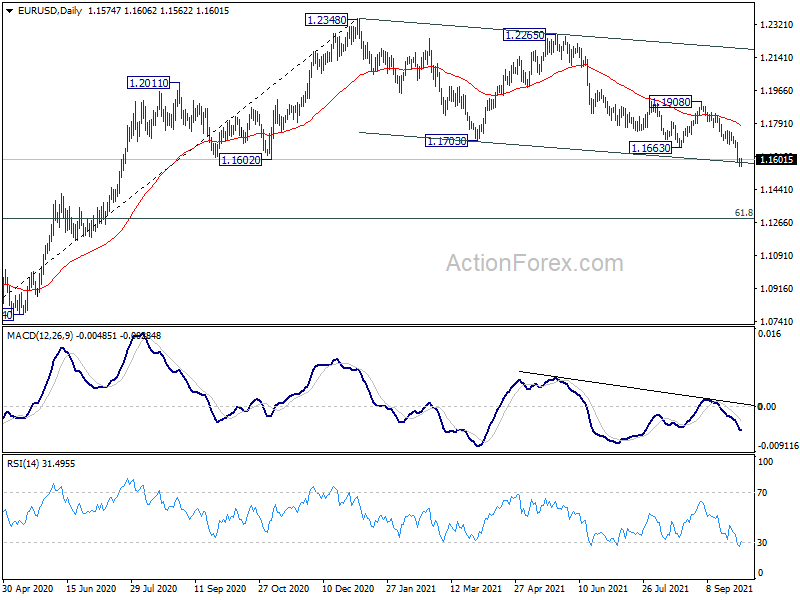
In the bigger picture, sustained break of 1.1602 will argue that rise from 1.0635 (2020 low) has completed at 1.2348. Deeper fall would be seen to 61.8% retracement of 1.0635 to 1.2348 at 1.1289. Note also that the firm break of 55 week EMA (1.1830) also carries medium term bearish implication. Firm break of 1.1289 will pave the way to retest 1.0635 low. On the upside, though, break of 1.1908 resistance will revive medium term bullishness and turn focus back to 1.2348 high.
Dollar Continues to Pare Gain, Shrugs Higher PCE Inflation
Dollar continues to pare gains in early US session as the week is coming to a close. PCE inflation data is largely ignored by the markets, while Euro also shrugs CPI. Canadian Dollar also ignores smaller than expected GDP contraction. Sterling is leading the way in the rebound, followed by Aussie. As for the week, the greenback is still in favor to close as the best performer, while New Zealand Dollar is the worst.
In Europe, at the time of the writing, FTSE is down -0.59%. DAX is down -0.31%. CAC is down -0.05%. Germany 10-year yield is down -0.039 at -0.236. Earlier in Asia, Nikkei dropped -2.31%. Japan 10-year JGB yield dropped -0.0145 to 0.055. Singapore Strait Times dropped -1.15%. China and Hong Kong were on holiday.
US PCE price index rose to 4.3% in Aug, core PCE unchanged at 3.6%
US personal income rose 0.2% mom, or USD 35.5B, in August, matched expectations. Personal spending rose 0.8% mom, or USD 130.5B, above expectation of 0.7% mom.
Headline PCE price index rose to 4.3% yoy, up from 4.2% yoy, above expectation of 3.9% yoy. Core PCE price index was unchanged at 3.6% yoy, matched expectations.
Canada GDP contracted -0.1% mom in Jul, to rise 0.7% mom in Aug
Canada GDP dropped -0.1% mom in July, better than expectation of -0.2% mom. Total activity remains -2% below pre-pandemic level in February 2020. Overall, 13 of 20 industrial sectors were up. Preliminary information indicates approximate 0.7% rise in real GDP for August.
Eurozone CPI jumped to 3.4% yoy in Sep, core CPI rose to 1.9% yoy
Eurozone CPI accelerated to 3.4% yoy in September, up from 3.0% yoy, above expectation of 3.3% yoy. Core CPI rose to 1.9% yoy, up from 1.6% yoy, above expectation of 1.8% yoy.
Looking at the main components of euro area inflation, energy is expected to have the highest annual rate in September (17.4%, compared with 15.4% in August), followed by non-energy industrial goods (2.1%, compared with 2.6% in August), food, alcohol & tobacco (2.1%, compared with 2.0% in August) and services (1.7%, compared with 1.1% in August).
Eurozone PMI manufacturing finalized at 58.6, growing toll from supply chain headwinds
Eurozone PMI Manufacturing was finalized at 58.6 in September, down from August's 61.4. That was the largest drop in the headline index since April 2020 as supply-side constraints impacted goods producers. Acute inflationary pressures persisted as supplier deliver time continued to lengthen considerably.
Chris Williamson, Chief Business Economist at IHS Markit said: "While Eurozone manufacturing expanded at a robust pace in September, growth has weakened markedly as producers report a growing toll from supply chain headwinds... The supply situation should start to improve now that COVID-19 cases are falling and vaccination rates are improving in many countries, notably in several key Asian economies from which many components are sourced, but it will inevitably be a slow process which could see the theme of supply issues and rising prices run well into 2022."
Germany PMI Manufacturing was finalized at 58.4 in September, down from August's 62.6. Markit said output and new orders rose at slowest rate in 15 months. Input shortages continued to push up costs, leading to higher output prices. Pace of job creation slowed as growth expectations dipped to 13-month low.
France PMI Manufacturing was finalized at 55.0 in September, down from August's 57.5, lowest since January. Markit said that input lead times deteriorated at unprecedented rate prior to COVID-19. Output growth lost further momentum amid supply-side challenges. New order growth softened further.
UK PMI manufacturing finalized at 57.1, descending towards a bout of stagflation
UK PMI Manufacturing was finalized at 57.1 in September, down from August's 60.3. Markit said output and new orders rose at slowest rates since February. New export business fell for the first time in eight months.
Rob Dobson, Director at IHS Markit, said: "The September PMI highlights the risk of the UK descending towards a bout of 'stagflation', as growth of manufacturing output and new orders eased sharply while input costs and selling prices continued to surge higher.... With little sign of resolution to these issues, manufacturers, especially smaller firms with lower market power or capacity flexibility, will continue to be buffeted by these headwinds for the foreseeable future, hinting at a tough autumn and winter ahead for many firms."
BoJ opinions: No significant change in the situation in Japan
In the Summary of Opinions of BoJ's September 21-22 meeting, it's noted, "since there is no significant change in the situation in Japan where economic activity, such as of firms, has been supported by accommodative financial conditions, it is appropriate for the Bank to maintain the current monetary policy measures".
One opinion also noted, "although financial markets have been stable on the whole, it is necessary to be vigilant in closely monitoring economic and financial developments, including the impact of developments in the Chinese real estate sector on global financial markets, and be ready to respond promptly if necessary."
Japan Tankan large manufacturing index rose to 18, highest since 2018
Japan's Tankan large manufacturing index rose from 14 to 18 in Q3, above expectation of 13. That's the highest level since 2018. Large manufacturing outlook rose from 13 to 14, below expectation of 15. Non-manufacturing index rose from 1 to 2, above expectation of 0. Non-manufacturing outlook was unchanged at 3, below expectation of 5.
Large companies expected to expand capital investment by 10.1% in the fiscal year started April, risen from prior indication of 9.6%. Inflation is expected to be 0.7% a year from now, slightly higher than 0.6% as expected in prior survey.
Japan PMI manufacturing finalized at 51.5
Japan PMI Manufacturing was finalized at 51.5 in September, down from August's 52.7. Markit noted renewed reductions in production and incoming business. Cost burdens has the sharpest rise in 13 years amid supply chain disruption. Businesses confidence, however, strengthened for the first time in three months.
Also released, unemployment rate was unchanged at 2.8% in August.
Australia AiG manufacturing dropped to 51.2, recovery all-but-stalled
Australia AiG Performance of Manufacturing Index dropped from 51.6 to 51.2 in September. Looking at some details, production rose 2.9 to 53.1. Employment dropped from -4.3 to 47.1. New orders dropped -5.1 to 52.0. Exports rose 6.8 to 51.9.
Ai Group Chief Executive Innes Willox said: "The recovery in the manufacturing sector over the past year all-but-stalled in September as the impacts of lockdowns and border closures constrained activity in the two largest states.... Manufacturers are hoping that the prospect of restrictions being wound back will see a strong lift in performance over coming months."
EUR/USD Mid-Day Outlook
Daily Pivots: (S1) 1.1556; (P) 1.1583; (R1) 1.1603; More...
Intraday bias in EUR/USD is turned neutral with 4 hour MACD crossed above signal line. Upside of recovery should be limited by 1.1682 resistance to bring another fall. On the downside, break of 1.1561 will extend the whole fall from 1.2348, as a correction to whole rise from 1.0634. Next target is 1.1289 medium term fibonacci level. Nevertheless, sustained break of 1.1682 will bring stronger rebound back towards 1.1908 resistance.
In the bigger picture, sustained break of 1.1602 will argue that rise from 1.0635 (2020 low) has completed at 1.2348. Deeper fall would be seen to 61.8% retracement of 1.0635 to 1.2348 at 1.1289. Note also that the firm break of 55 week EMA (1.1830) also carries medium term bearish implication. Firm break of 1.1289 will pave the way to retest 1.0635 low. On the upside, though, break of 1.1908 resistance will revive medium term bullishness and turn focus back to 1.2348 high.
Economic Indicators Update
| GMT | Ccy | Events | Actual | Forecast | Previous | Revised |
|---|---|---|---|---|---|---|
| 23:50 | JPY | Tankan Large Manufacturing Index Q3 | 18 | 13 | 14 | |
| 23:50 | JPY | Tankan Large Manufacturing Outlook Q3 | 14 | 15 | 13 | |
| 23:50 | JPY | Tankan Non-Manufacturing Index Q3 | 2 | 0 | 1 | |
| 23:50 | JPY | Tankan Non-Manufacturing Outlook Q3 | 3 | 5 | 3 | |
| 23:50 | JPY | Tankan Large All Industry Capex Q3 | 10.10% | 9.10% | 9.60% | |
| 23:30 | JPY | Unemployment Rate Aug | 2.80% | 2.90% | 2.80% | |
| 23:50 | JPY | BoJ Summary of Opinions | ||||
| 00:30 | JPY | Manufacturing PMI Sep F | 51.5 | 51.2 | 51.2 | |
| 05:00 | JPY | Consumer Confidence Index Sep | 37.8 | 38.9 | 36.7 | |
| 06:00 | EUR | Germany Retail Sales M/M Aug | 1.10% | 1.60% | -5.10% | |
| 07:30 | CHF | SVME PMI Sep | 68.1 | 65.6 | 67.7 | |
| 07:45 | EUR | Italy Manufacturing PMI Sep | 59.7 | 60.1 | 60.9 | |
| 07:50 | EUR | France Manufacturing PMI Sep F | 55 | 55.2 | 55.2 | |
| 07:55 | EUR | Germany Manufacturing PMI Sep F | 58.4 | 58.5 | 58.5 | |
| 08:00 | EUR | Eurozone Manufacturing PMI Sep F | 58.6 | 58.7 | 58.7 | |
| 08:30 | GBP | Manufacturing PMI Sep F | 57.1 | 56.3 | 56.3 | |
| 09:00 | EUR | Eurozone CPI Y/Y Sep P | 3.40% | 3.30% | 3.00% | |
| 09:00 | EUR | Eurozone CPI Core Y/Y Sep P | 1.90% | 1.80% | 1.60% | |
| 12:30 | CAD | GDP M/M Jul | -0.10% | -0.20% | 0.70% | |
| 12:30 | USD | Personal Income M/M Aug | 0.20% | 0.20% | 1.10% | |
| 12:30 | USD | Personal Spending Aug | 0.80% | 0.70% | 0.30% | -0.10% |
| 12:30 | USD | PCE Price Index M/M Aug | 0.40% | 0.40% | ||
| 12:30 | USD | PCE Price Index Y/Y Aug | 4.30% | 3.90% | 4.20% | |
| 12:30 | USD | Core PCE Price Index M/M Aug | 0.30% | 0.20% | 0.30% | |
| 12:30 | USD | Core PCE Price Index Y/Y Aug | 3.60% | 3.60% | 3.60% | |
| 13:30 | CAD | Manufacturing PMI Sep | 57.2 | |||
| 13:45 | USD | Manufacturing PMI SepF | 60.2 | 60.5 | ||
| 14:00 | USD | Michigan Consumer Sentiment Index Sep | 71 | 71 | ||
| 14:00 | USD | ISM Manufacturing PMI Sep | 59.9 | 59.9 | ||
| 14:00 | USD | ISM Manufacturing Prices Paid Sep | 83.8 | 79.4 | ||
| 14:00 | USD | ISM Manufacturing Employment Index Sep | 49 | |||
| 14:00 | USD | Construction Spending M/M Aug | 0.30% | 0.30% |
US PCE price index rose to 4.3% in Aug, core PCE unchanged at 3.6%
US personal income rose 0.2% mom, or USD 35.5B, in August, matched expectations. Personal spending rose 0.8% mom, or USD 130.5B, above expectation of 0.7% mom.
Headline PCE price index rose to 4.3% yoy, up from 4.2% yoy, above expectation of 3.9% yoy. Core PCE price index was unchanged at 3.6% yoy, matched expectations.
Canada GDP contracted -0.1% mom in Jul, to rise 0.7% mom in Aug
Canada GDP dropped -0.1% mom in July, better than expectation of -0.2% mom. Total activity remains -2% below pre-pandemic level in February 2020. Overall, 13 of 20 industrial sectors were up. Preliminary information indicates approximate 0.7% rise in real GDP for August.