Sample Category Title
USD/CHF Weekly Outlook
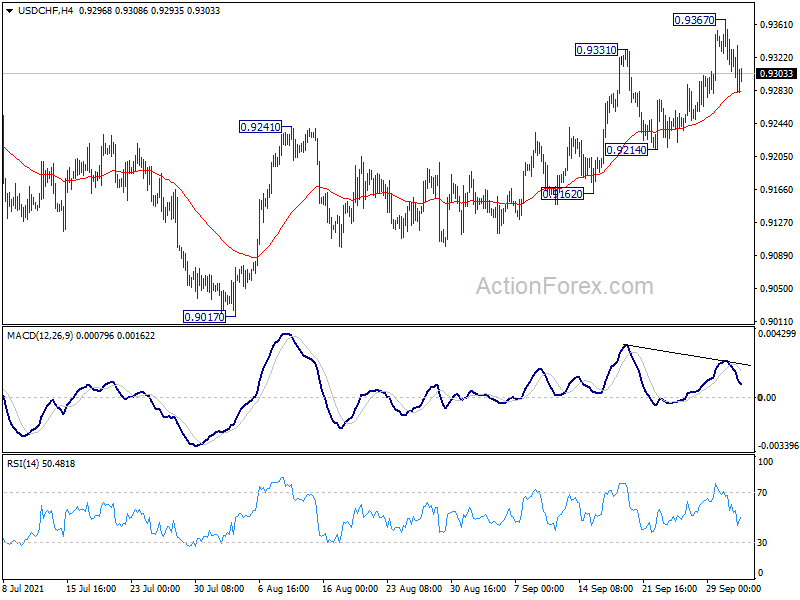
USD/CHF's rise resumed last week and edged higher to 0.9367, but lost momentum again. Initial bias remains neutral this week first. On the upside, break of 0.9367 will resume the rise from 0.8925 to 0.9471 key resistance next. On the downside, however, break of 0.9214 will turn bias back to the downside for 0.9017 support again.
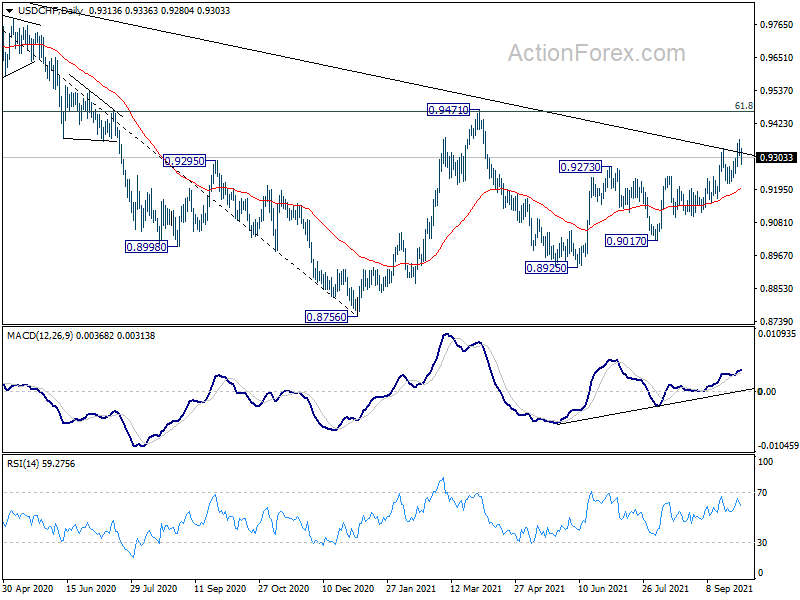
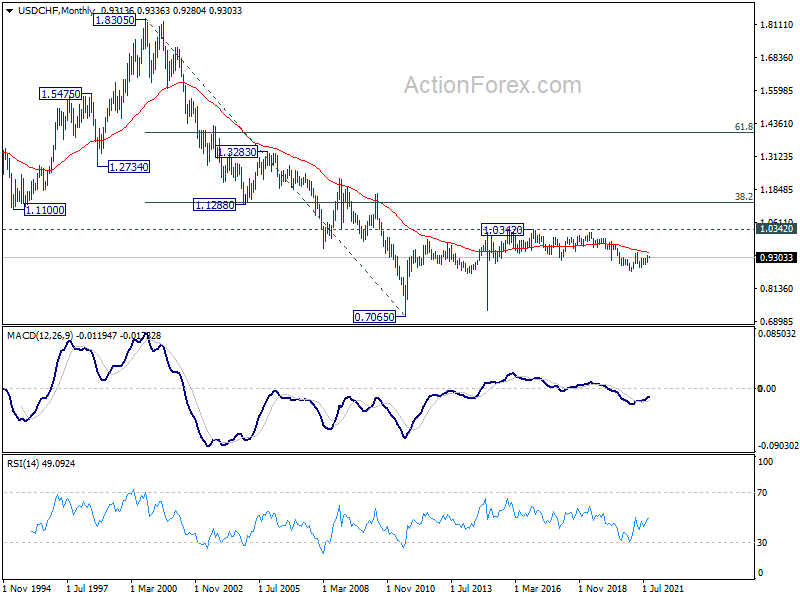
In the bigger picture, the strong rally above 55 week EMA (now at 0.9188) now tilts favor to the case of bullish trend reversal. That is, decline from 1.3042 (2016 high) is probably completed at 0.8756 already. Sustained break of 0.9471 resistance should confirm this case and pave the way to retest 1.0342 ahead. However, rejection by 0.9471 will mix up the outlook again and retain some medium term bearishness.
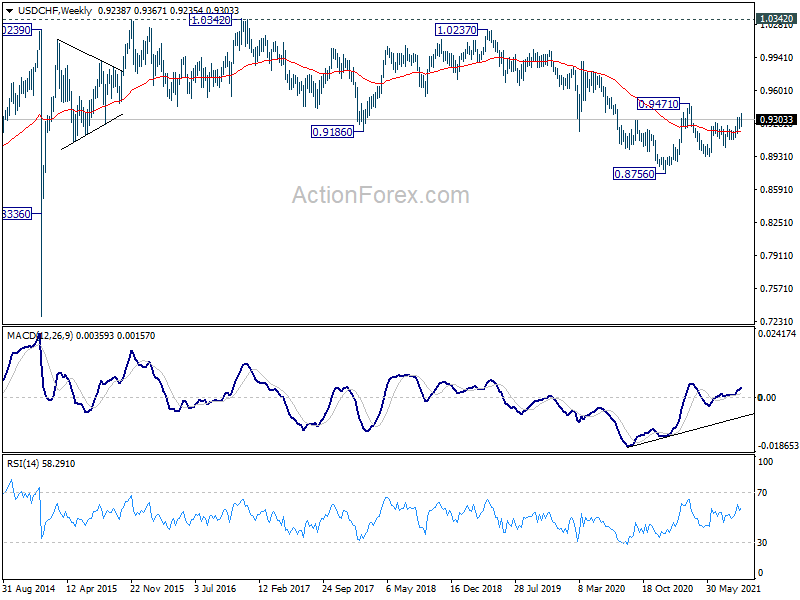
In the long term picture, price actions from 0.7065 (2011 low) are currently seen as developing into a long term corrective pattern, at least until a firm break of 1.0342 resistance.
AUD/USD Weekly Outlook
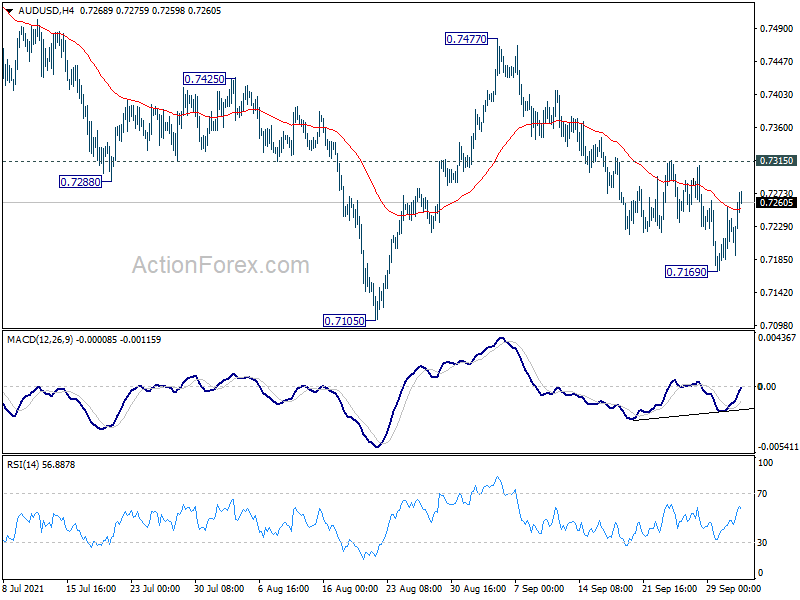
AUD/USD's fall from 0.7477 extended lower to 0.7169 last week, but recovered since then. Initial bias remains neutral this week first. On the downside, below 0.7169 will target a test on 0.7105 low. Firm break there will resume whole decline from 0.8006 for 0.6991 support next. On the upside, above 0.7315 minor resistance will turn bias back to the upside for 0.7477 resistance instead.
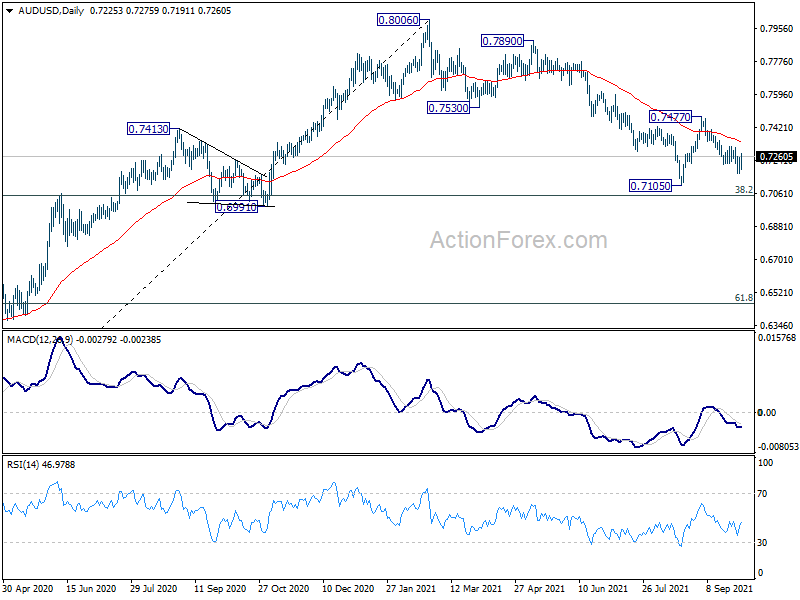
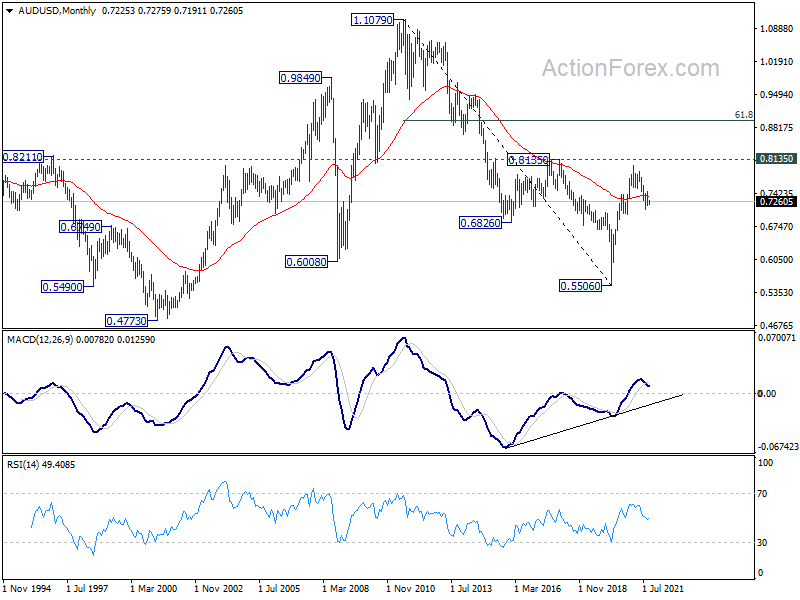
In the bigger picture, with 0.6991 cluster support (38.2% retracement of 0.5506 to 0.8006 at 0.7051) intact, we're seeing price action from 0.8006 as a correction only. That is, up trend from 0.5506 low would resume after the correction completes. In that case, main focus will be 0.8135 key resistance (2018 high). Sustained break there will carry larger bullish implications. However, sustained break of 0.6991 will argue that the whole medium term trend has indeed reversed.
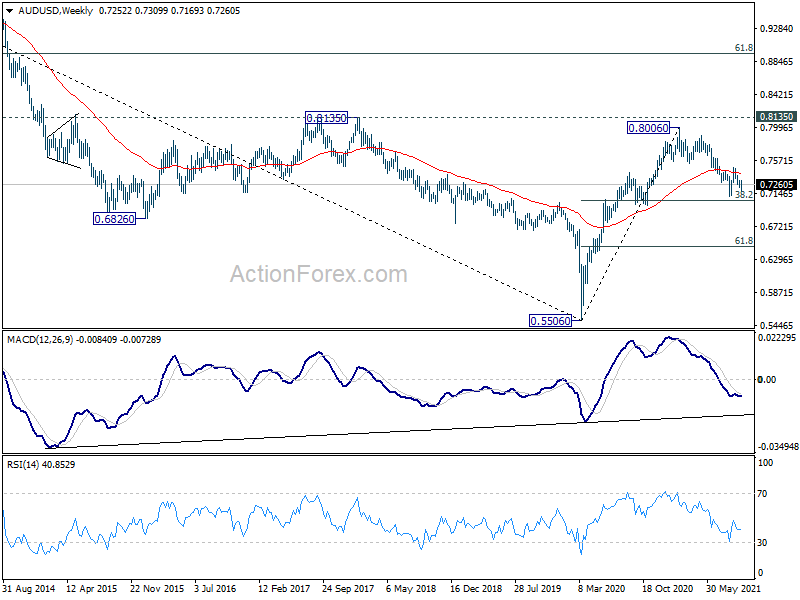
In the longer term picture, focus remains on 0.8135 structural resistance. Decisive break there will argue that rise from 0.5506 is developing into a long term up trend that reverses whole down trend from 1.1079 (2011 high). In that case, further rally would be seen to 61.8% retracement of 1.1079 to 0.5506 at 0.8950 and possibly above. Rejection by 0.8135 will keep long term outlook neutral at best.
USD/CAD Weekly Outlook
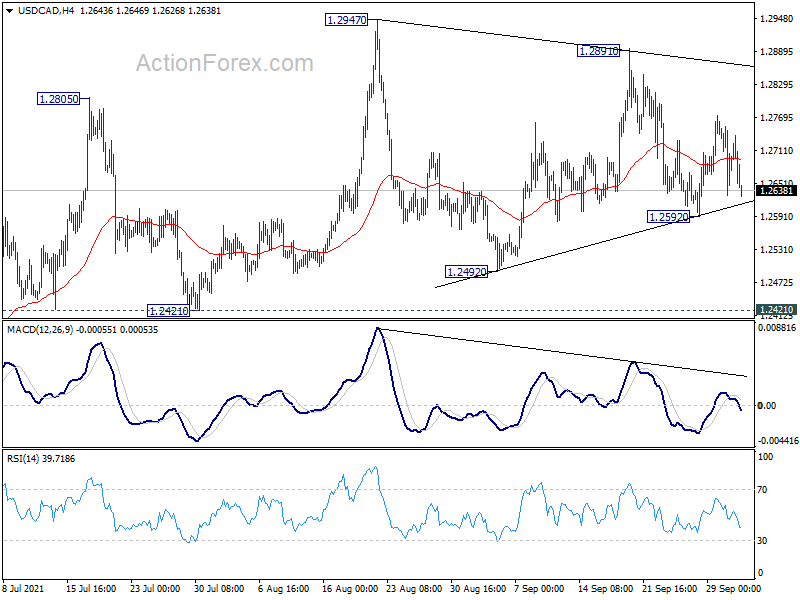
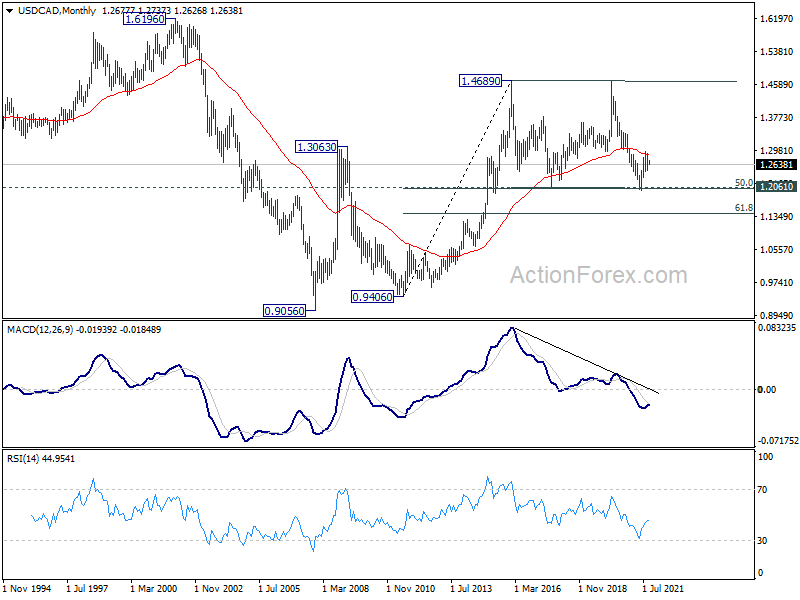
USD/CAD recovered after dipping to 1.2592 last week, but quickly lost momentum. Initial bias remains neutral this week first and more sideway trading could be seen. On the downside, break of 1.2592 will extend the fall from 1.2891, as the third leg of the pattern from 1.2947, to 1.2492 support and possibly below. On the upside, break of 1.2891 resistance will bring retest of 1.2947 high. Overall, with 1.2421 support intact, rise from 1.2005 should still be in progress for another rise through 1.2947 at a later stage.
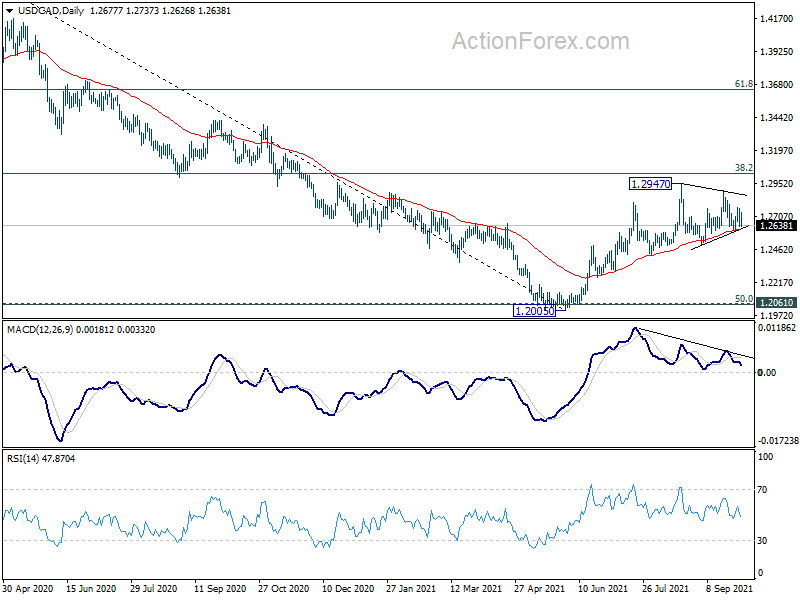
In the bigger picture, fall from 1.4667 is seen as the third leg of the corrective pattern from 1.4689 (2016 high). It should have completed after hitting 1.2061 (2017 low) and 50% retracement of 0.9406 to 1.4689 at 1.2048. Sustained break of 38.2% retracement of 1.4667 to 1.2005 at 1.3022 will pave the way to 61.8% retracement at 1.3650 and above. Overall, medium term outlook remains neutral at worst with 1.2048/61 support zone intact.
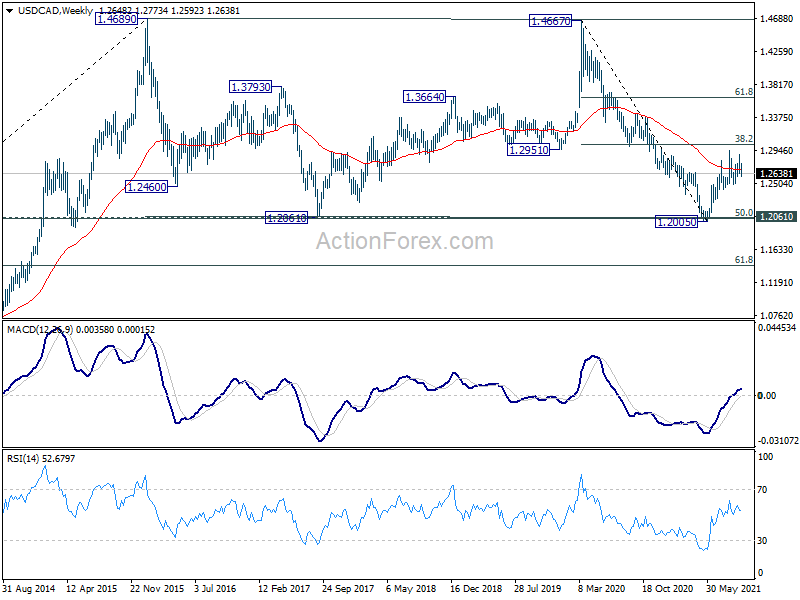
In the longer term picture, we're viewing price actions from 1.4689 as a consolidation pattern. Thus, up trend from 0.9506 (2007 low) is still expected to resume at a later stage. This will remain the favored case as long as 1.2061 support holds, which is close to 50% retracement of 0.9406 to 1.4689 at 1.2048. However, rejection by 55 month EMA, follow by firm break of 1.2061 support, will argue that USD/CAD has already started a long term down trend.
GBP/JPY Weekly Outlook
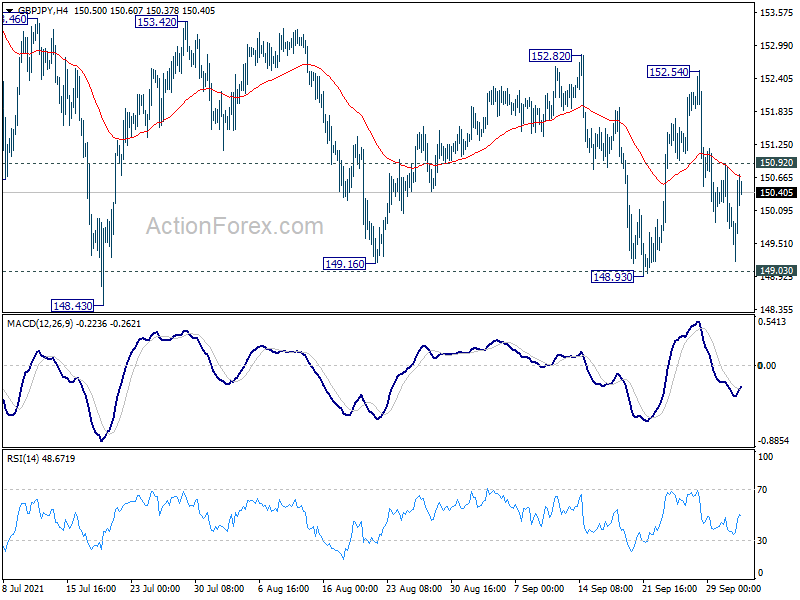
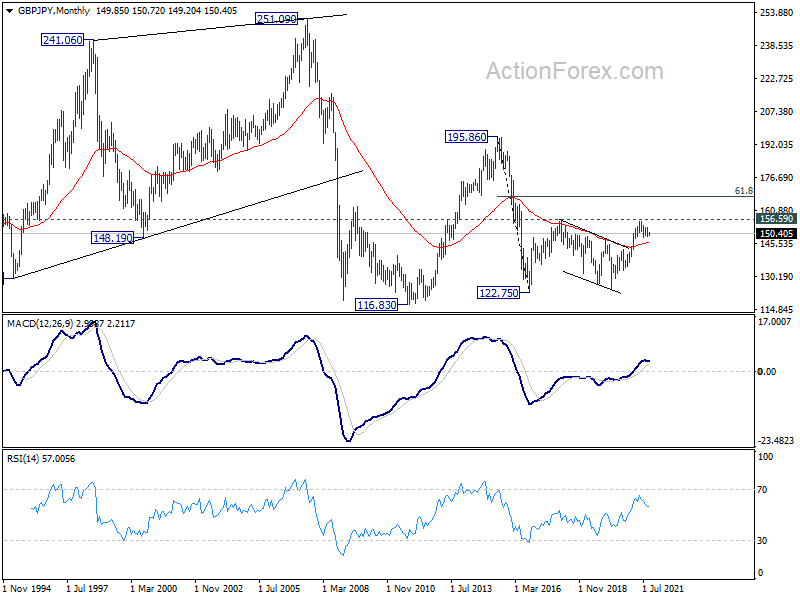
GBP/JPY flip-flopped in range of 148.93/152.54 last week. Initial bias is neutral this week first. On the upside, above 150.92 minor resistance will turn bias back to the upside for 152.54. Firm break there will suggest that correction from 156.05 has completed, and turn near term outlook bullish for retesting this high. On the downside, however, sustained break of 149.03 key support will carry larger bearish implication and target 13.78 fibonacci level.
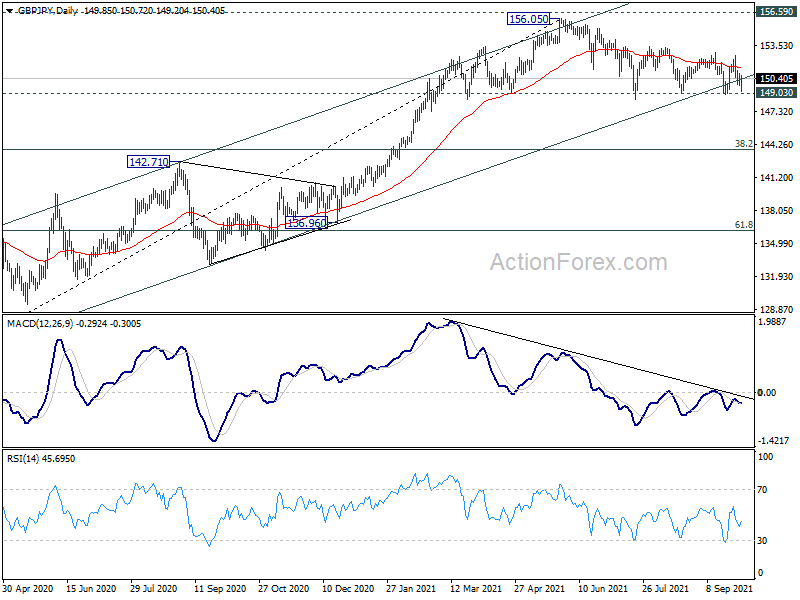
In the bigger picture, rise from 123.94 is seen as the third leg of the pattern from 122.75 (2016 low). As long as 149.03 support holds, such rise would still resume at a later stage. However, sustained break of 149.03 support will indicate rejection by 156.59 (2018 high). Fall from 156.05 would at least be correcting the whole rise from 123.94 (2020 low). Deeper fall would be seen back 38.2% retracement of 123.94 to 156.05 at 143.78 first.
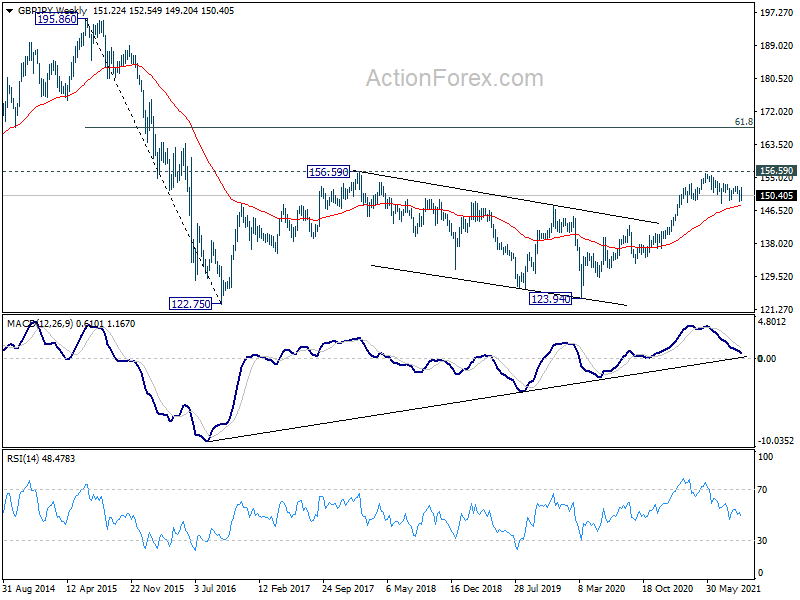
In the longer term picture, the strong break of 55 months EMA was an early sign of long term bullish reversal. Firm break of 156.69 resistance should now confirm the start of an up trend for 195.86 (2015 high). However, rejection by 156.69 will invalidate the bullish signal and keep long term outlook neutral first.
EUR/JPY Weekly Outlook
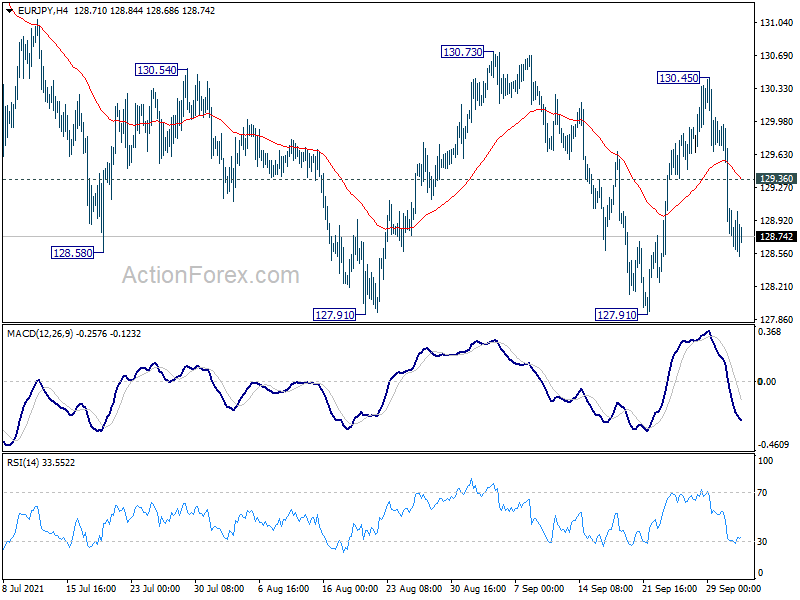
EUR/JPY edged higher to 130.45 last week but failed to break through 130.73 resistance and retreated sharply. Initial bias is mildly on the downside for retesting 127.91 support. Firm break there will resume the whole decline from 134.11 to 127.07 resistance turned support next. On the upside, though, break of 130.73 resistance will argue that correction from 134.11 has completed and turn near term outlook bullish for retesting this high.
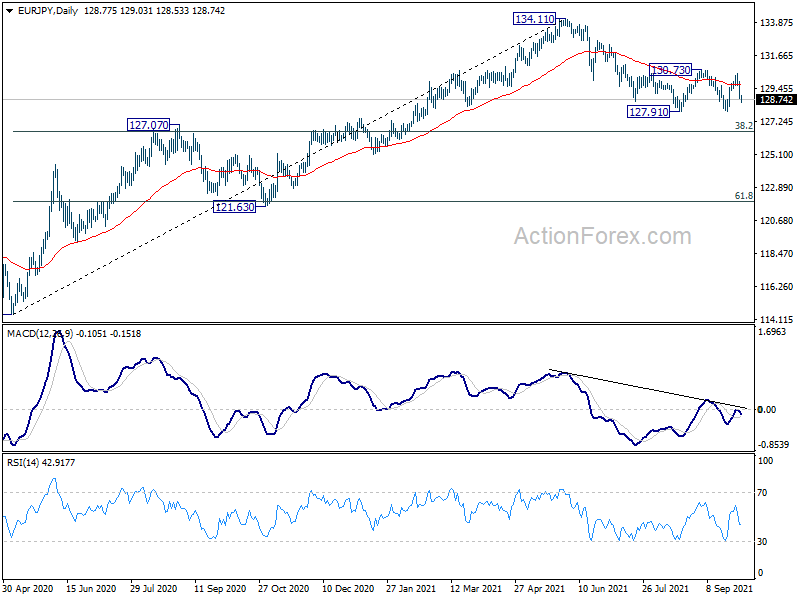
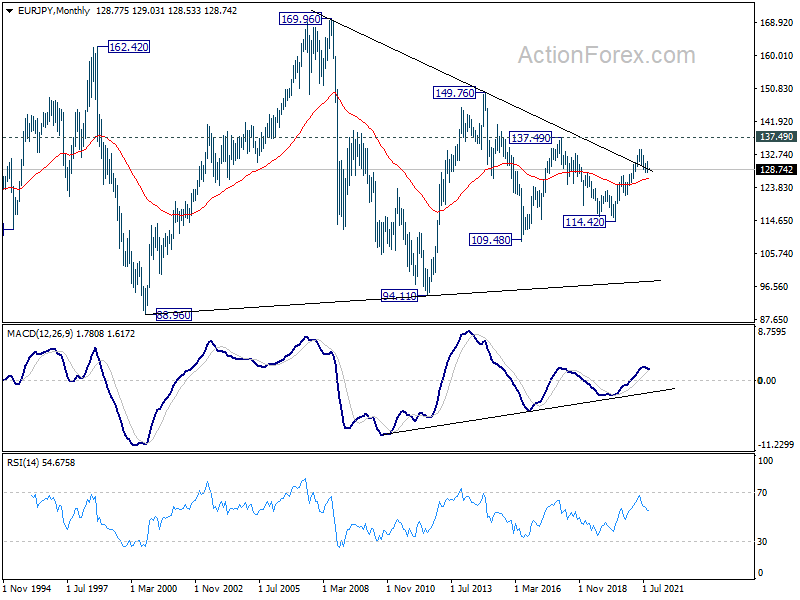
In the bigger picture, rise from 114.42 is seen as a medium term rising leg inside a long term sideway pattern. As long as 127.07 resistance turned support holds, further rise is still expected to retest 137.49 (2018 high). However, firm break of 127.07 will argue that the medium term trend has reversed, deeper fall would be seen to 61.8% retracement of 114.42 to 134.11 at 121.94.
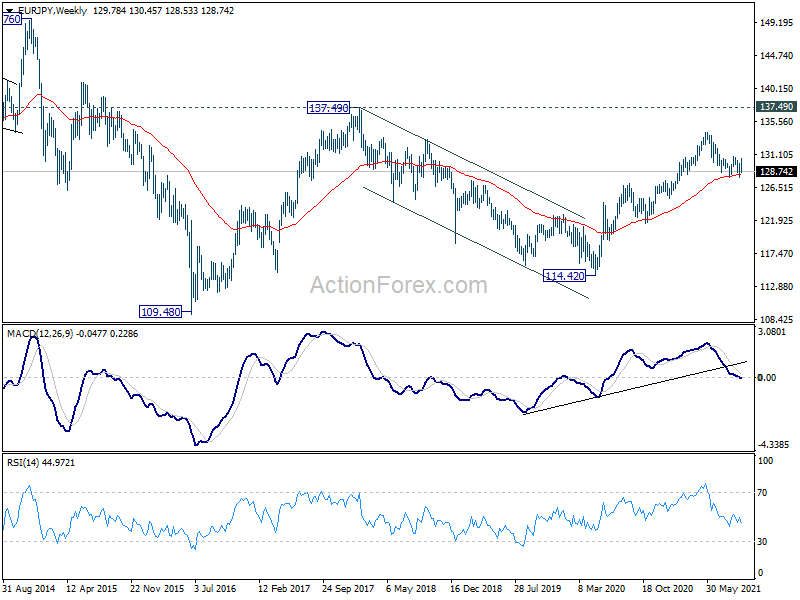
In the long term picture, EUR/JPY is staying in long term sideway pattern, established since 2000. Another rising leg in progress for 137.49 resistance and above.
EUR/GBP Weekly Outlook
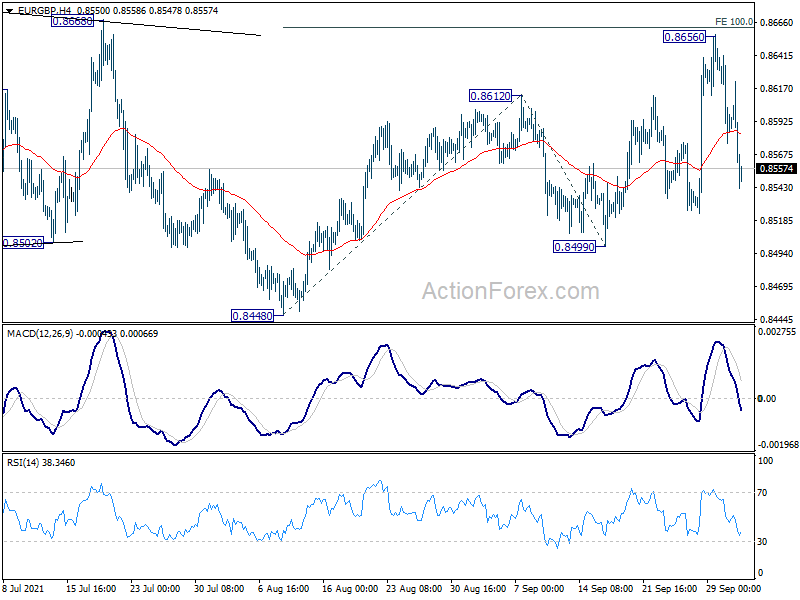
EUR/GBP rose to as high as 0.8656 last week but failed to break through 0.8668 key structural resistance and retreated sharply. Initial bias remains neutral this week first. On the upside, sustained break of 0.8668 will be a strong sign of larger bullish reversal. Next target will be 161.8% projection of 0.8448 to 0.8612 from 0.8499 at 0.8764. On the downside, though, break of 0.8499 will bring retest of 0.8448 low instead.
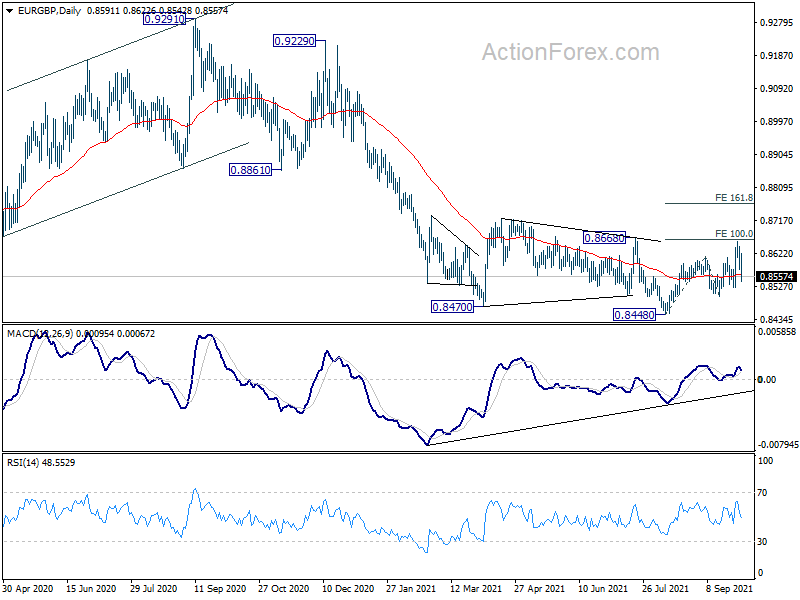
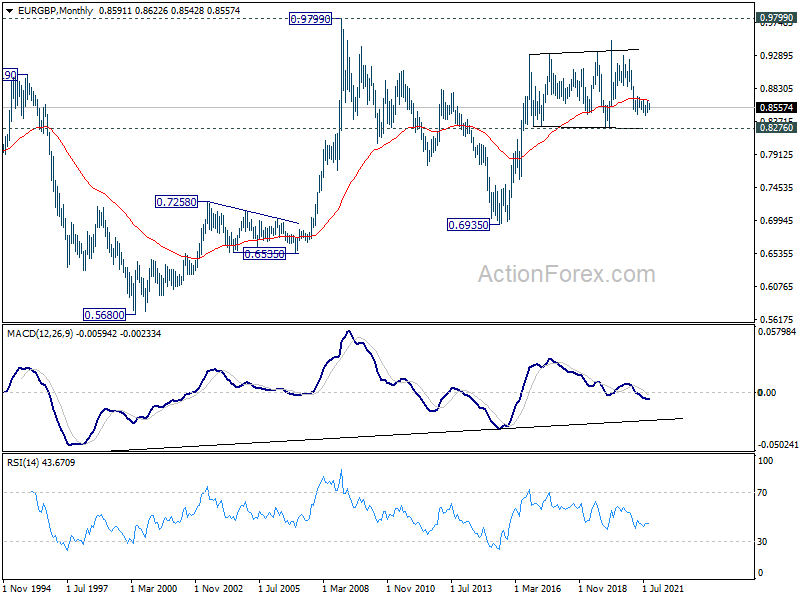
In the bigger picture, price actions from 0.9499 (2020 high) are still seen as developing into a corrective pattern. Deeper fall could be seen as long as 0.8668 resistance holds, towards long term support at 0.8276. However, firm break of 0.8668 resistance would argue that a medium term bottom was already formed. Stronger rise would be seen to 0.8861 support turned resistance to confirm completion of the corrective pattern.
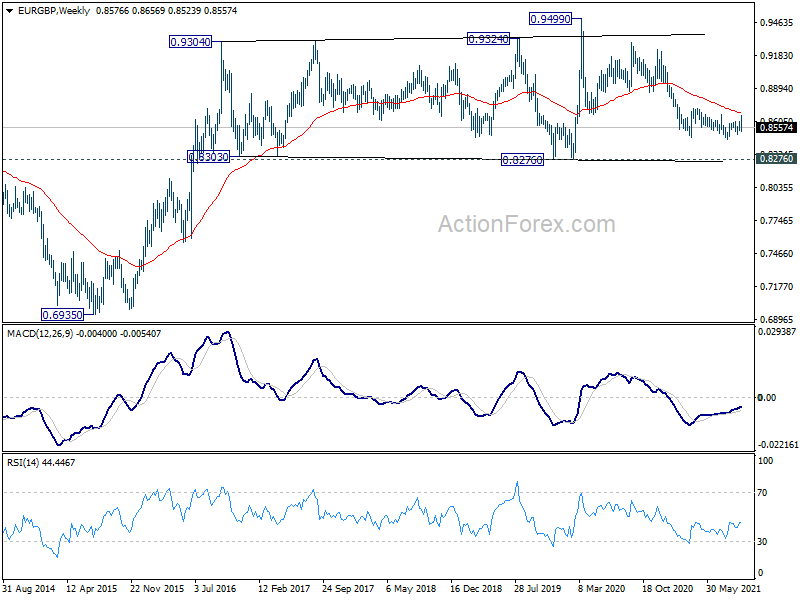
In the long term picture, outlook will stay bullish as long as 0.8276 support holds. Break of 0.9499 is in favor at a later stage, to resume the up trend from 0.6935 (2015 low).
EUR/AUD Weekly Outlook
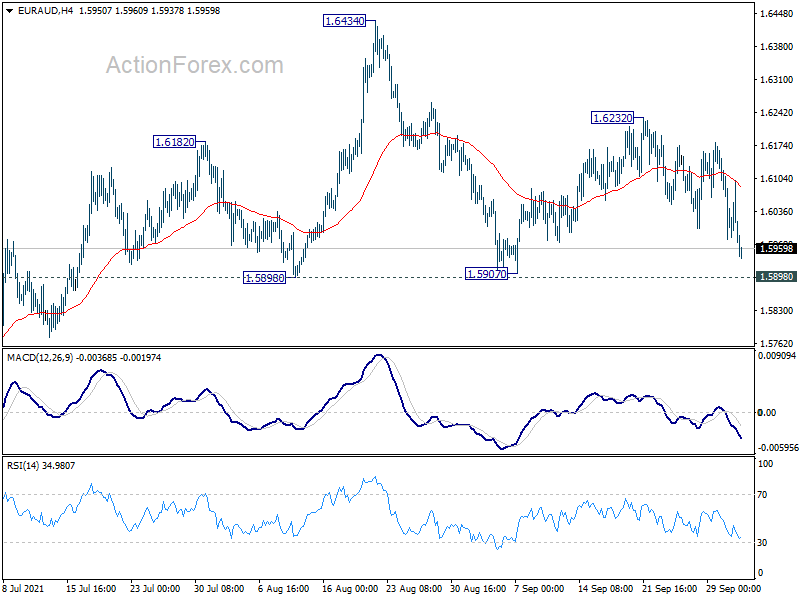
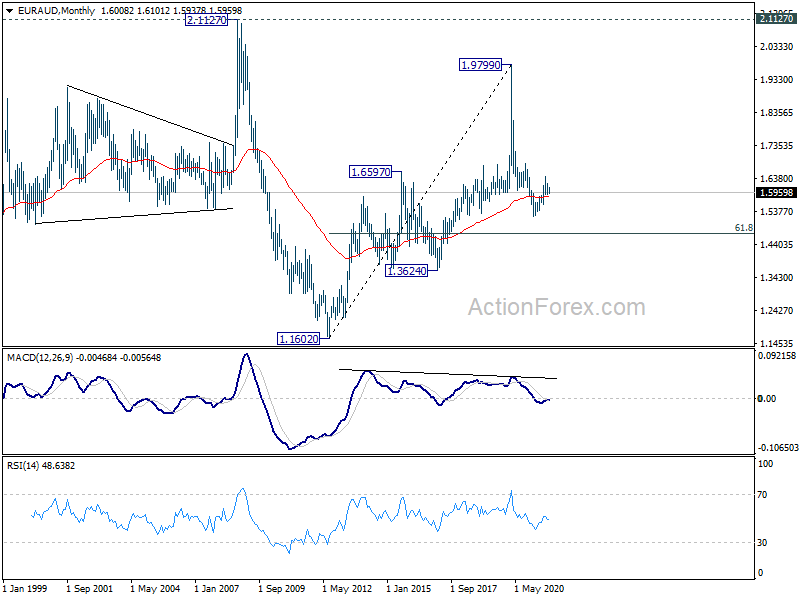
EUR/AUD's fall from 1.6232 extended lower last week but stays above 1.5898 key support. Initial bias remains neutral this week first. As long as 1.5898 holds, larger rise from 1.5250 is still in favor to continue. Break of 1.6232 will turn bias to the upside for retesting 1.6434 high first. However, sustained break of 1.5898 will argue that rise from 1.5250 has completed, and turn near term outlook bearish for 1.5614 support first.
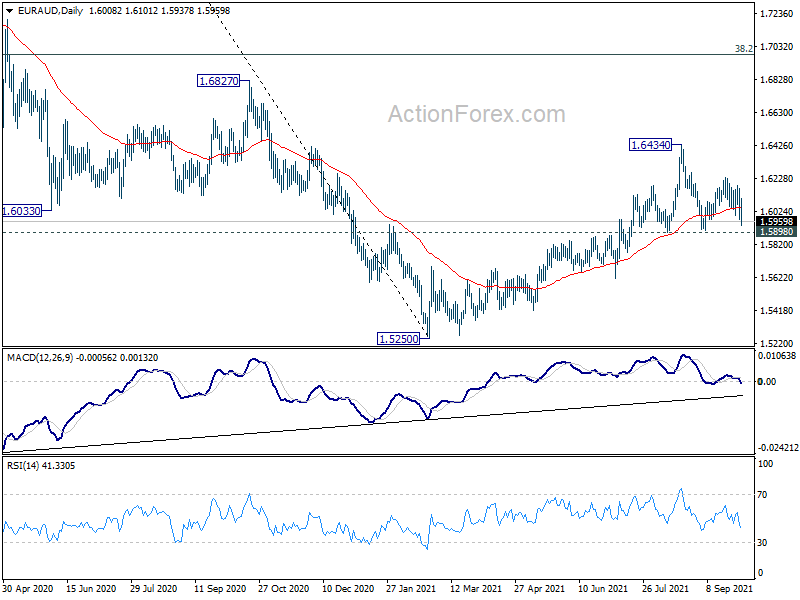
In the bigger picture, rise from 1.5250 medium term bottom is currently seen as a correction to the down trend from 1.9799 first. Stronger rise could be seen to 38.2% retracement of 1.9799 to 1.5250 at 1.6988 next. We'd tentatively expect strong resistance from there to limit upside, at least on first attempt. Meanwhile, break of 1.5898 support will indicate that the rebound has completed. Larger down trend from 1.9799 might be ready to resume through 1.5250 low.
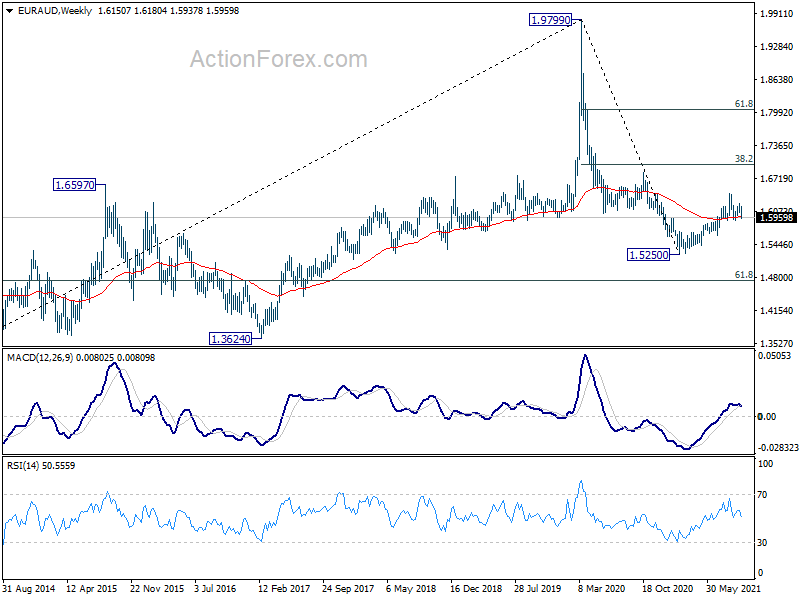
In the longer term picture, rise from 1.1602 (2012 low) should have already completed with three waves up to 1.9799 (2020 high). Fall from there is seen as a medium term to long term down leg as a long term down trend, or a sideway pattern. We'll assess the odds again at a later stage.
EUR/CHF Weekly Outlook
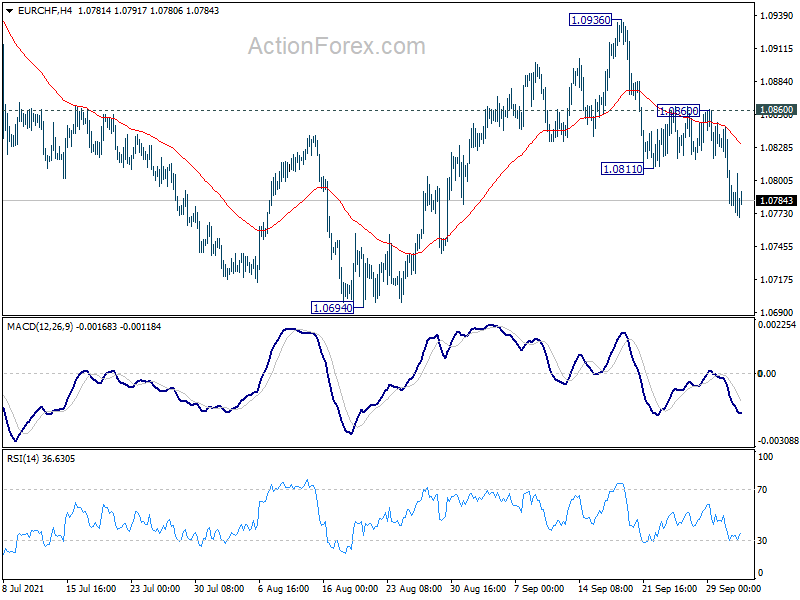
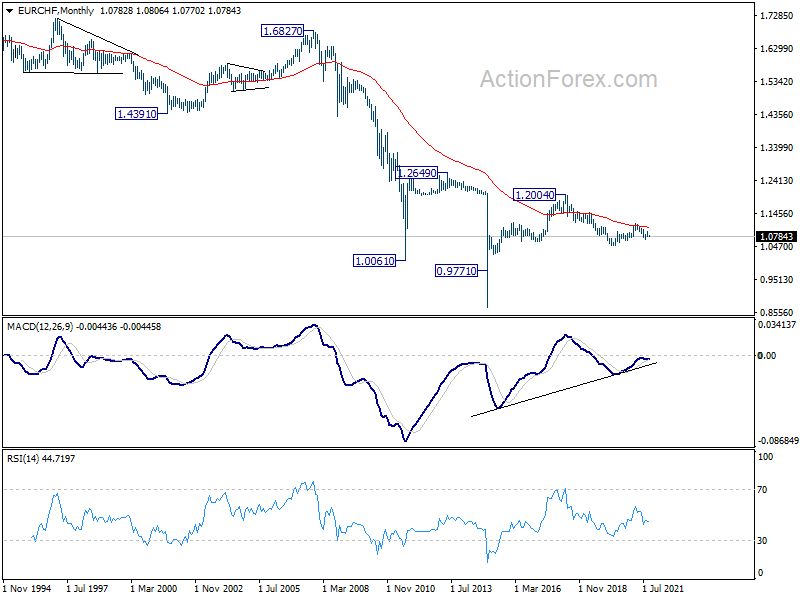
EUR/CHF's decline from 1.0936 resumed last week and intraday bias stays on the downside this week for retesting 1.0694 low. Firm break there will resume whole decline from 1.1149. On the upside, above 1.0860 minor resistance will turn bias back to the upside for 1.0936 resistance instead.
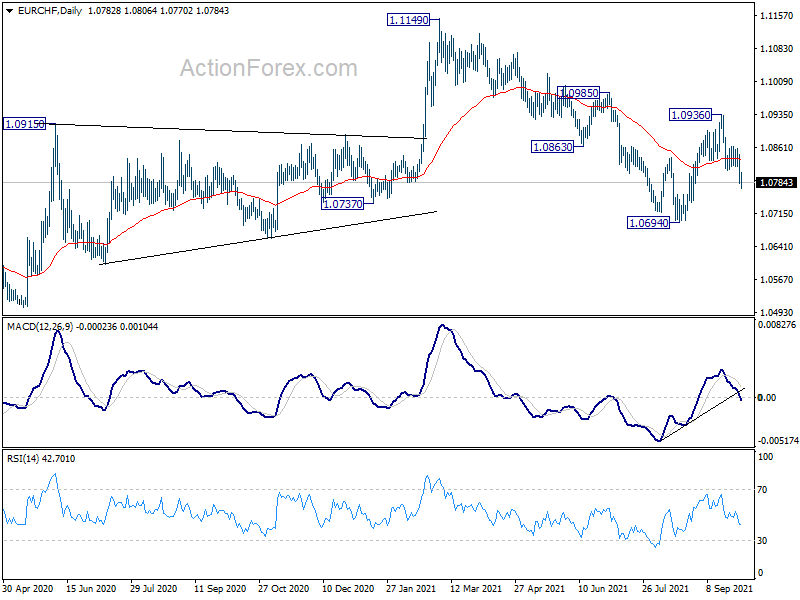
In the bigger picture, medium term outlook remains mixed as EUR/CHF is still failing to get rid of 55 week EMA cleanly. On the upside, break of 1.1149 will resume the whole rise from 1.0505 (2020 low). On the downside, break of 1.0694 will revive some medium term bearishness for 1.0505 and below.
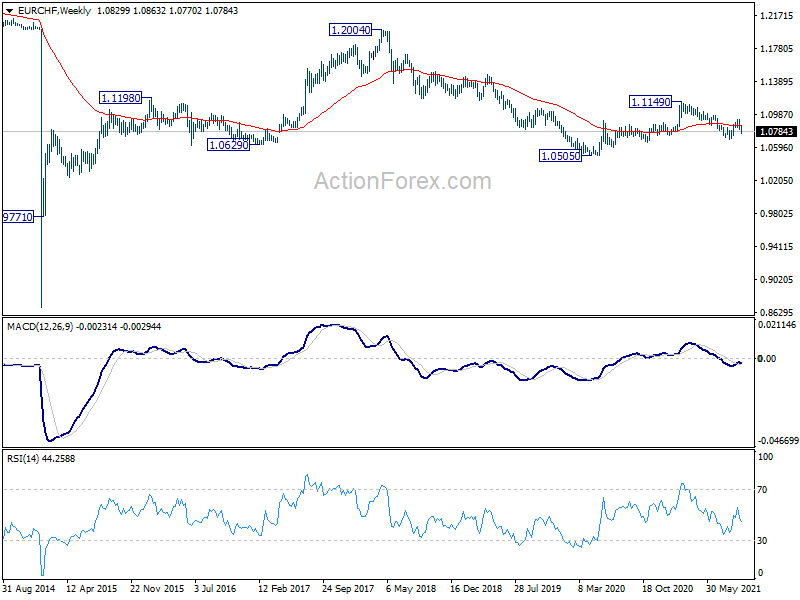
In the long term picture, rejection by 55 month EMA (now at 1.1039) retains long term bearishness. Break of 1.0505 low will resume down trend to 61.8% projection of 1.2004 to 1.0505 to 1.1149 at 1.0223.
Dollar Index Could Be Capped by 94.46 Fibonacci Level as Yields Rally Halts
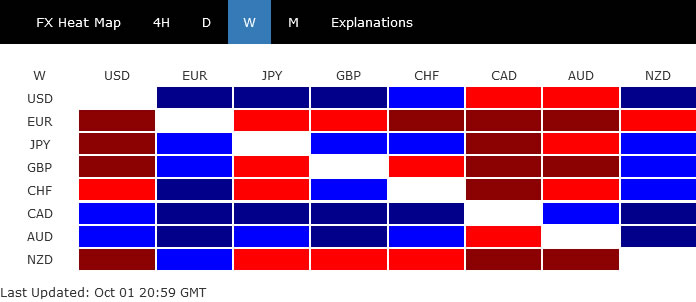
Dollar had been the strongest for most of the week but lost it first place at the time, as treasury yields retreated. Instead, resilient risk appetite in the US, as well as firm oil price helped Canadian and Australian Dollars stole the first and second place. On the other hand, Euro ended as the worst performing one, weighed down particularly by selloff in crosses. New Zealand Dollar was the second worst.
As rally in yield lost steam and stocks proved to be resilient so far, we'd argue that Dollar index might not be ready to take out 94.46 key fibonacci resistance yet. But a bearish reversal in the greenback is not expected for now. A question ahead is whether Euro's selling would persist even if Dollar turns into consolidation. In particular, the common currency looks rather vulnerable against Canadian Dollar.
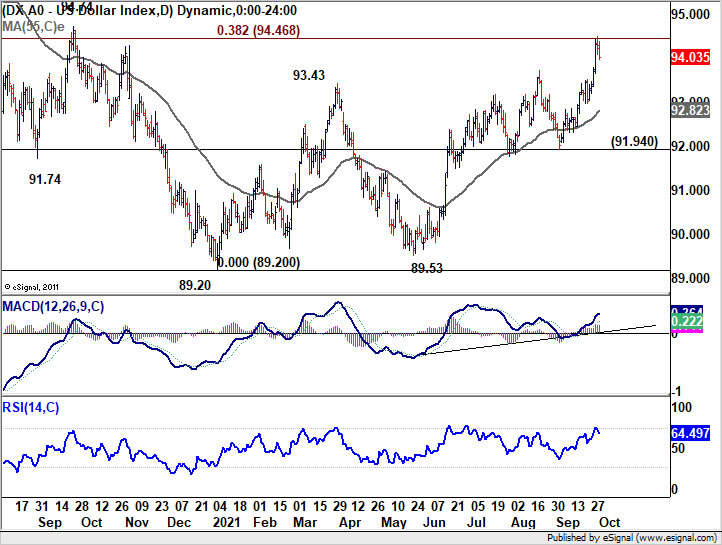
DXY taking on key fibonacci resistance at 94.46
Dollar index rose to as high as 94.50 last week as the rise from 89.53 extended. Overall near term bias is bullish with the rally above both 55 day and 55 week EMA. Sustained trading above 38.2% retracement of 102.99 to 89.20 at 94.46 will carry larger bullish implication. That is, rise from 89.20 is already reversing the whole down trend from 102.99 (2020 high). In this case, stronger rally would be seen to 61.8% retracement of 97.72 and possibly above. However, rejection by 94.46 fibonacci level, followed by break of 91.94 support, will argue that price actions from 89.20 are merely just a consolidation pattern, and revive medium term bearishness.
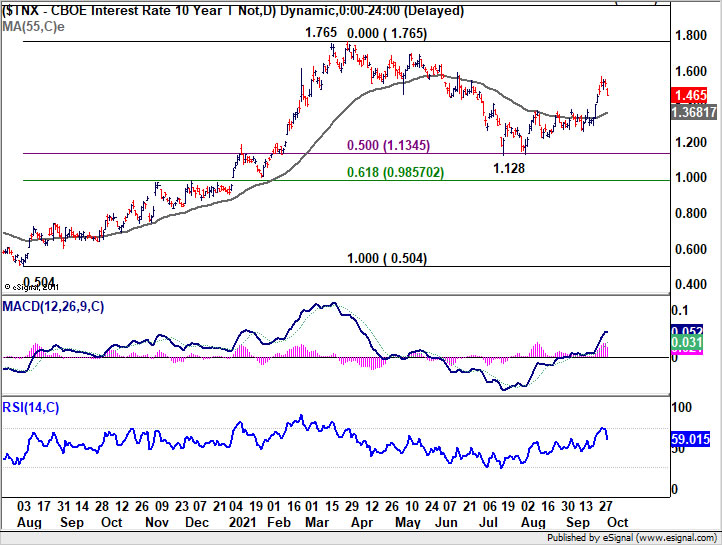
10-year yield lost upside momentum after hitting 1.567
For DXY to power through 94.46 fibonacci resistance mentioned above, the markets might need to see further sustained rally in treasury yields. While 10-year yield hit as high as 1.567 last week, it retreated notably to close at 1.465, just slightly above prior week's close at 1.460. It remains to be seen if that's just a result of quarter-end repositioning. Or, the selloff in bonds is really running out of steam. Or investors are getting easier on inflation threat.
For the near term, TNX might dip back towards 55 day EMA (now at 1.368). We'd expect strong support from there to contain downside. Rise from 1.128 is still expected to resume later in the year to retest 1.765 high. But the pull back in yields could start to cap Dollar's rally for the near term.
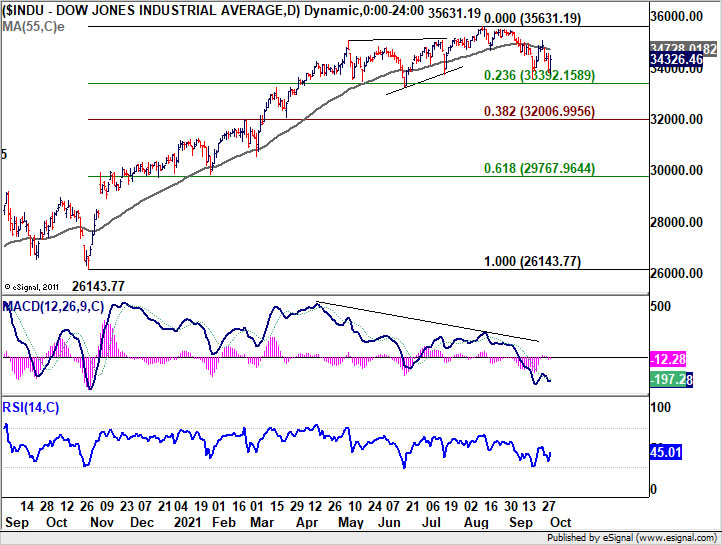
DOW holding above 23.6% retracement as sideway consolidation continued.
Resilience in stocks is also not providing much support to the greenback. While DOW struggled to break through 55 day EMA , it's downside is so far held well above 23.6% retracement of 26143.77 to 35631.19 at 33392.15. The development argues that price actions from 35631.19 are merely developing into a shallow, and brief sideway consolidations. Hence, the next move is more likely an upside breakout than a down. But of course, firm break of 33392.15 will dampen this view and bring deeper correction to 38.2% retracement at 32006.99 and even below.
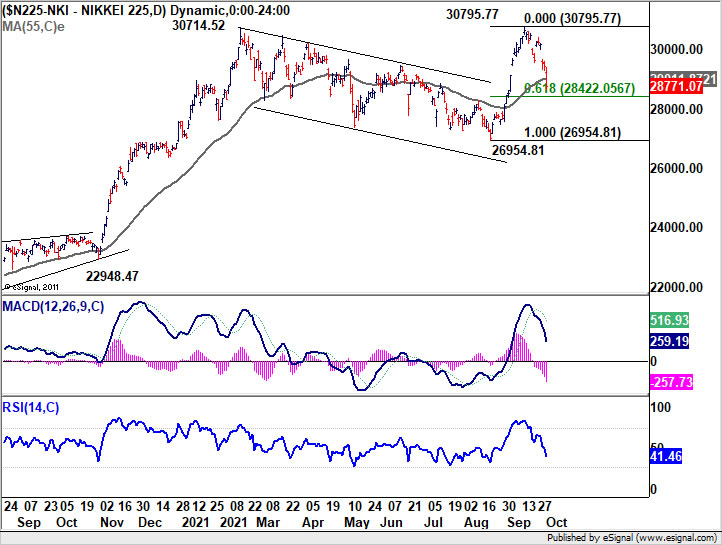
Nikkei closed below 55 day EMA, USD/JPY retreated
Talking about stocks, near term bullishness in Nikkei now looks much less certain with last week's sharp fall and close below 55 day EMA. We'd look for support from 61.8% retracement of 26954.81 to 30795.77 at 28422.05 to contain downside and bring rebound. However, sustained break of 28422.05 could bring even deeper decline to retest 26954.81 support and threatens the medium term up trend.
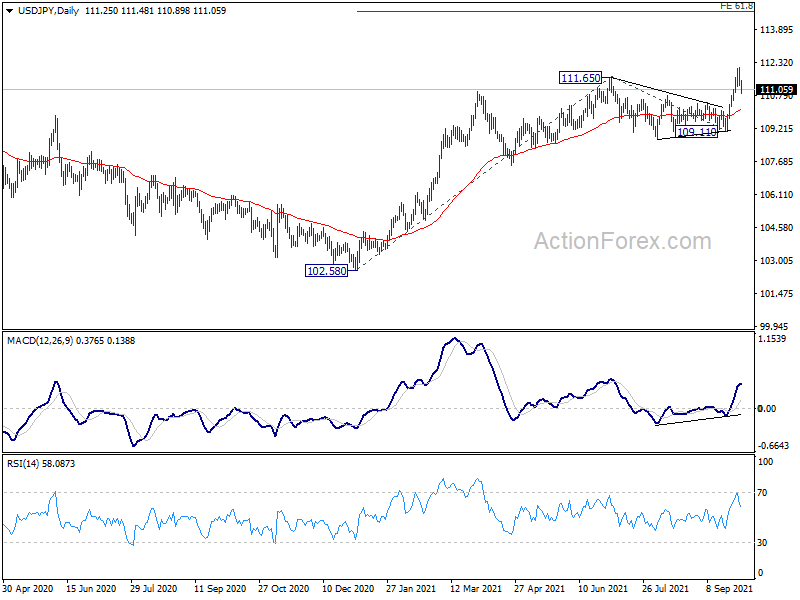
USD/JPY also retreated after a brief break of 111.65 high. It remains to be seen if it's dragged down by the retreat in US yields only. Or, USD/JPY is also weighed by the sharp fall in Nikkei and risk sentiment in Asia. It could take a while for it to unveil the next path.
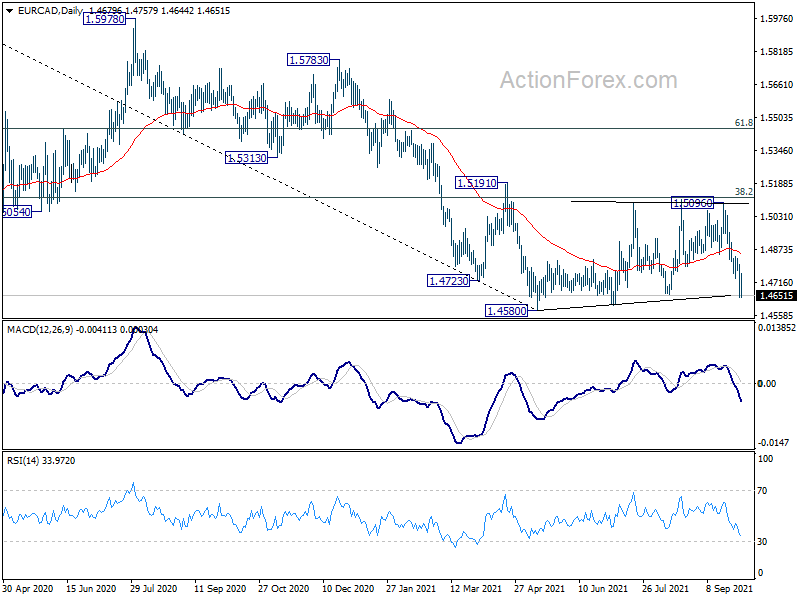
EUR/CAD ready to resume down trend through 1.4580
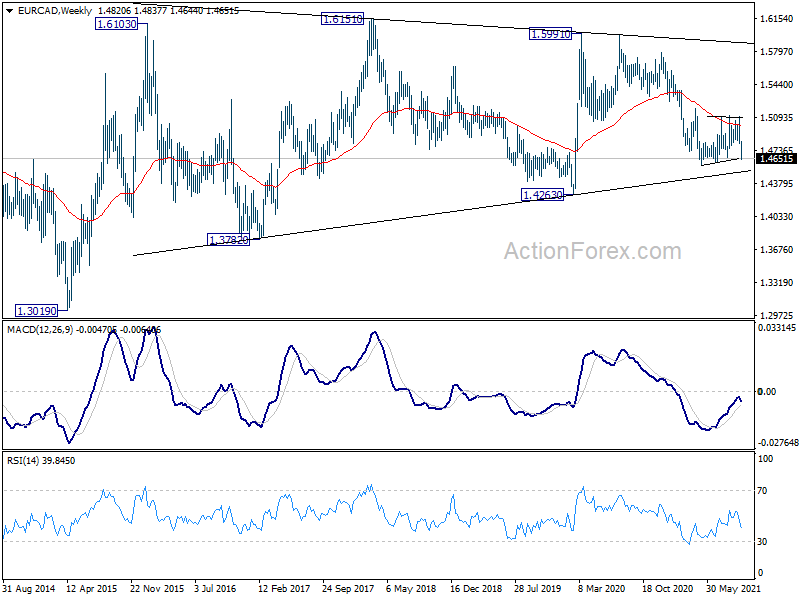
EUR/CAD was the biggest mover last week. The development argues that consolidation pattern from 1.4580 might have completed already, after failing 38.2% retracement of 1.5991 to 1.4580 at 1.5119 three times. The rejection by 55 week EMA also affirms medium term bearishness. Immediate focus is now on 1.4580 low for the near term. Firm break there will resume whole down trend from 1.5991.
EUR/CAD would then enter an important zone between 1.4263 (2020 low) and long term trend line support (1.4497). Strong support from this zone will keep EUR/CAD inside the long term range pattern from 1.6103 and maintain long term neutrality. However, firm break of 1.4263 would open up long term bearishness for 1.3782 and below.
AUD/USD Weekly Outlook
AUD/USD's fall from 0.7477 extended lower to 0.7169 last week, but recovered since then. Initial bias remains neutral this week first. On the downside, below 0.7169 will target a test on 0.7105 low. Firm break there will resume whole decline from 0.8006 for 0.6991 support next. On the upside, above 0.7315 minor resistance will turn bias back to the upside for 0.7477 resistance instead.
In the bigger picture, with 0.6991 cluster support (38.2% retracement of 0.5506 to 0.8006 at 0.7051) intact, we're seeing price action from 0.8006 as a correction only. That is, up trend from 0.5506 low would resume after the correction completes. In that case, main focus will be 0.8135 key resistance (2018 high). Sustained break there will carry larger bullish implications. However, sustained break of 0.6991 will argue that the whole medium term trend has indeed reversed.
In the longer term picture, focus remains on 0.8135 structural resistance. Decisive break there will argue that rise from 0.5506 is developing into a long term up trend that reverses whole down trend from 1.1079 (2011 high). In that case, further rally would be seen to 61.8% retracement of 1.1079 to 0.5506 at 0.8950 and possibly above. Rejection by 0.8135 will keep long term outlook neutral at best.
CFTC Commitments of Traders- Bets on Lower Euro Jumped amidst Energy Crisis
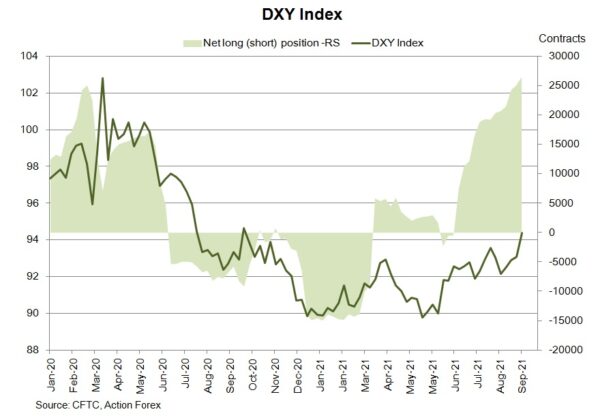
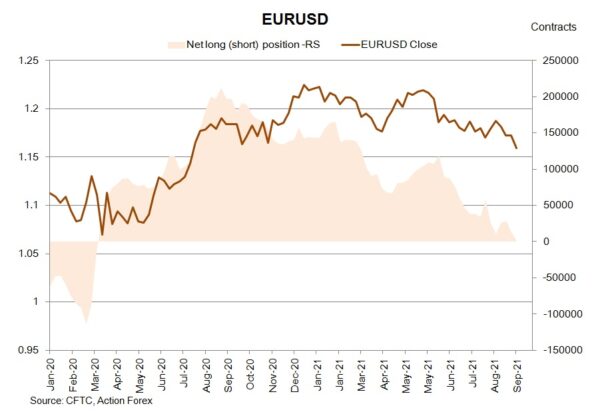
As suggested in the CFTC Commitments of Traders report in the week ended September 28, NET LENGTH of USD index futures gained +1 361 contracts to 26 461. Concerning European currencies, NET LENGTH in EUR futures slumped -11 223 contracts to just 872. Speculative shorts soared remarkably, by +16 860 contracts. GBP futures returned to NET LENGTH of 1 964 contracts. British pound's recovery after the hawkish BOE meeting proved short-lived. The market is concerned about the implications of energy shortage.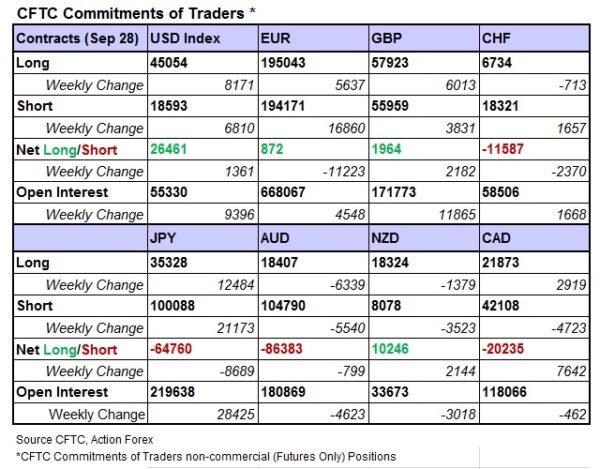
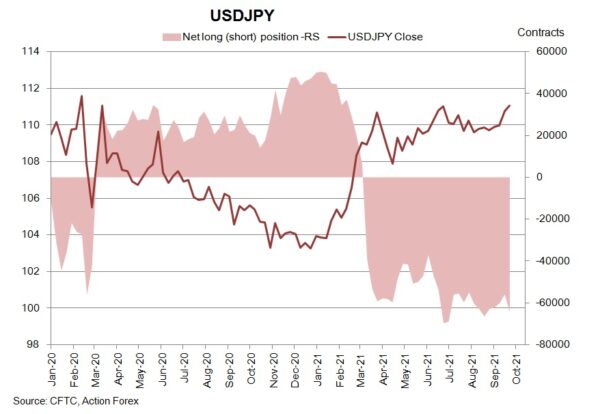
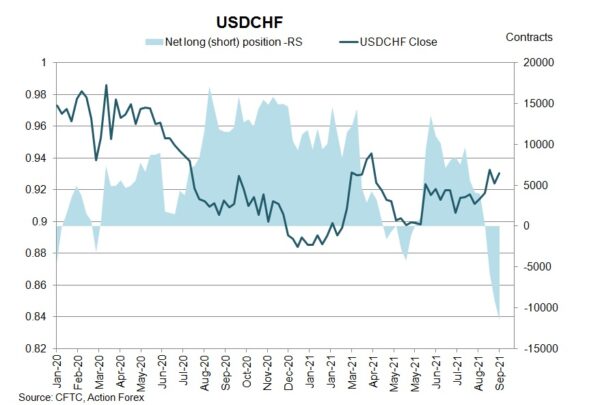
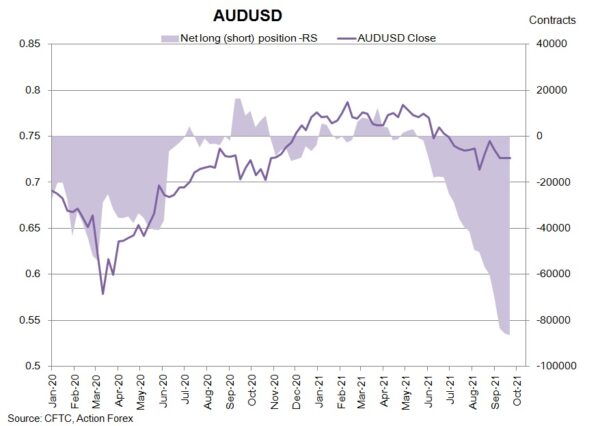
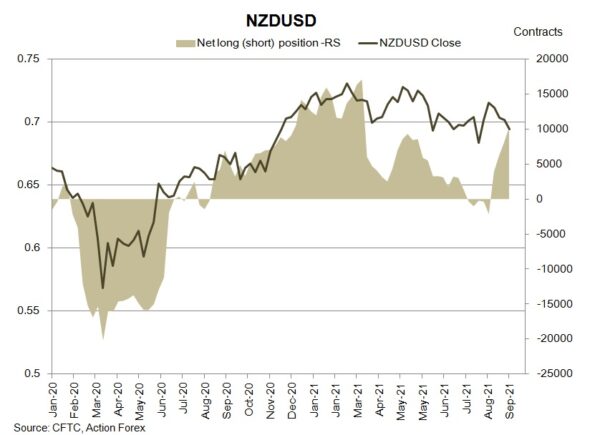
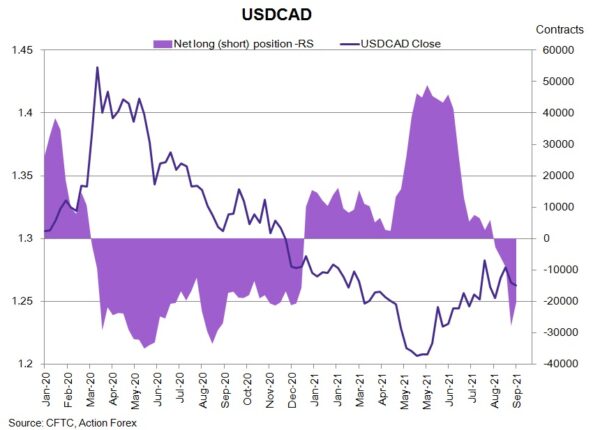
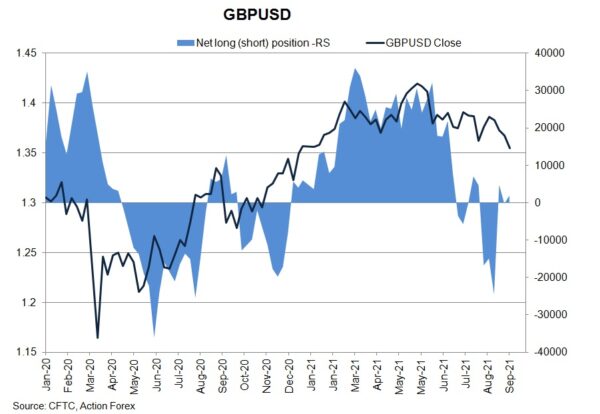 On safe-haven currencies, NET SHORT of CHF future gained +2 370 contracts to 11 587 while that of JPY futures jumped +8 689 contracts to 64 760. Concerning commodity currencies, NET SHORT of AUD futures added (but decelerated further), by +799 contracts to 86 383. NET LENGTH for NZD futures added +2 144 contracts to 10 246 during the week. CAD futures' NET SHORT fell -7 642 contracts to 20 235.