

Sample Category Title
Japanese Yen Yawns As Tankan Index Rises
The Japanese yen is showing limited movement in the Friday session. Currently, USD/JPY is trading at 111.11, down 0.11% on the day.
The yen finally stopped a nasty slide against the US dollar on Thursday, which saw it fall around two percent. The dollar briefly pushed above the 112 level for the first time since February. However, the dollar has eased lower, a result of some profit-taking and slightly lower US Treasury yields.
There was some positive news from Japan’s Tankan reports, which was welcome news after Retail Sales and Industrial Production both came in at a disappointing -3.2%. The Tankan Manufacturing Index improved to 18 in the third quarter, above the consensus of 14 and higher than the Q2 reading of 13 points. This points to stronger growth in manufacturing, but the strong release did not translate into gains for the Japanese yen.
The Federal Reserve has been in the headlines for weeks, as investors anxiously await an announcement from the Fed with regard to tapering. There are other pressing domestic issues, of course, such as the US debt ceiling and the USD 3.5 trillion Biden infrastructure proposal. Lawmakers managed to reach an agreement to fund the US government until December 3rd, which essentially provides a short respite before the problem has to be dealt with again. The House of Representatives had scheduled a vote on the infrastructure bill late on Thursday, but House Speaker Nancy Pelosi was forced to delay the vote since the opposition of Republicans and progressive Democrats would have resulted in the bill being defeated. The continuing uncertainty over a possible government shutdown and the infrastructure bill is weighing on investors’ risk appetite, which could translate into gains for the US dollar.
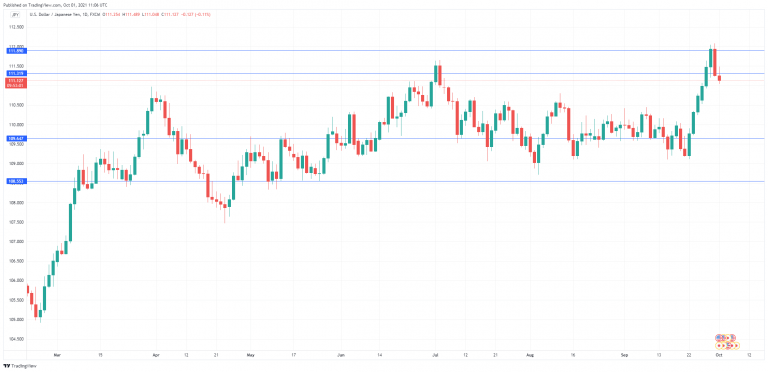
USD/JPY Technical
- 109.64 is providing support. Below, there is support at 108.55
- 111.31 has switched to resistance and is a weak line. Next, there is resistance at 111.89
Turbulent Times, October Seasonals
The US dollar gave back some ground in the final trading day of September but the theme remained volatility with large intraday swings growing in frequency.
The temporary 9-week funding bill to prevent a government shutdown passed yesterday, but the threat of US default still looms as no agreement has been reached regarding the suspension of the Federal debt limit. Ashraf shared a crucial FX chart for the Arabic and English WhatsApp Broadcast Groups with 4-cycle accuracy, suggesting a key inflection point ahead. We have a look at October seasonal patterns. The EURUSD short was stopped out, while the GBPJPY short and EURGBP long deepened in the profit.
Wednesday's trade featured another sharp rise in energy price and another painful fall in equities. The dollar strength from earlier in the week reversed to some degree and gold rebounded sharply.
Solid fundamental news was light aside from a rise in initial jobless claims to 362K compared to 333K expected. It's the second week in a row of rising numbers, though it was largely disregarded by the market.
Washington is an increasing focus but there was no real progress on steps towards solving the debt ceiling, passing the bipartisan infrastructure deal or agreeing on how to use reconciliation. Time is ticking though and we may see votes fail before anything comes together. That could represent a TARP-like buying opportunity, particularly on the debt ceiling.
Energy prices in Europe and Asia continued to soar with year-ahead power prices in southern Europe rising to crippling levels. A newswire report said a top Chinese official gave an order to secure supplies 'at any cost' and that headline gave fresh lift to energy, along with commodity currencies.
The bad news for China and anyone else on the wrong side of the trade is that October is a especially strong seasonally for gas. It's risen in 15 of the past 20 years for an average gain of 6.65%. Early weather forecasts are temperate though, so that could help.
Another market at extremes that could also face seasonal pressure is gold. October is the second-worst month for buillon. A further drop here could set up a fantastic buying opportunity ahead of the pattern of seasonal strength from late November through February.
One spot in the energy market that could get some help from seasonals is oil. October and November are the two worst months for crude and on Thursday there was a report that OPEC could look at new ways to add supply at next week's meeting.
Other trends include moderate USD strength, CAD weakness, rising yields and middling stock market performance until the traditional strength in Nov-Dec.
he dollar bid this week has been relentless and it's now getting extra fuel by technical factors and a potential squeeze. Cable broke through the July-Sept triple bottom and has plunged down to the lowest levels of the year, with little support nearby.
The euro is very close to the lows from last November and a break below would be a 15-month low. USD/JPY rose for the sixth day to the best since Feb 2020 in what looks like a major awakening after a long slumber in the pair.
These are all major moves and represent a possible trend change in the dollar. Of course, we're right in the thick of quarter end so signals can be confusing.
The best explanation for the dollar rally is also the simplest: Fed tapering. Though it's been well known for some time and there wasn't an immediate reaction, it certainly fits with the latest price action.
Further down the rabbit hole is the inflation picture. Powell said Wednesday that supply chain bottlenecks are worsening. That is going to put upward pressure on prices and – as we highlighted earlier this week – there's an ongoing shift in central bank messaging to acknowledge this. The next step would be a more-hawkish message. We may be seeing that priced in.
Another possibility is the US political drama around the debt ceiling, infrastructure and reconciliation. We have no doubt that the US will pay its debts but this drama has a way of frightening market participants and we can't rule out turmoil. As we often repeat, political deals are always the most-fraught at the end.
Beyond that is the signal from energy and commodity markets. There's been no let-up in European gas prices with a 10% rise on Wednesday to a new closing record.
Finally, there's still the looming threat of a Chinese slowdown and Evergrande. Bond payments continue to be missed and we await signs that officials will take steps to boost growth – something Blackrock predicted in a note on Tuesday.
Canada’s GDP Projected To Dip
The Canadian dollar is drifting ahead of the North American session. Currently, USD/CAD is trading at 1.2692, up 0.10% on the day.
The US dollar has looked sharp but eased lower on Thursday against the majors. USD/CAD fell 0.56% and dropped into 1.26-territory. This downward move was a result of some profit-taking as well as a slight drop in US Treasury yields. The dollar index is unchanged on Friday at 0.9421. Given the risk-aversion sentiment in the markets and the repricing of Fed tapering, the index should continue its upswing next week, which would boost USD/CAD.
Canada GDP looms
Canada will end the week with a market-mover, with the release of GDP for July. The previous GDP report was positive, with a healthy gain of 0.7%. However, the consensus for the upcoming release is -0.2%, and investors could react negatively to a decline in GDP.
A report showing negative growth is obviously not good news, but unless the reading is well below the forecast, it is unlikely to alter the market’s view that an interest rate hike is coming to a bank near you in 2o22. As Canada slowly navigates out of the Covid pandemic, the economy is grappling with supply bottlenecks, a shortage of workers and high inflation.
The Bank of Canada, taking a page out of the Fed playbook, has argued that inflation is transient. However, CPI jumped 4.1% in August (YoY), marking the fifth consecutive month that inflation has been above the Bank’s 3% ceiling. The prevailing view among investors is that the BoE will hike rates from the current 0.25% in the second half of 2022, but some analysts are projecting a rate rise in the first half of the year. If inflation remains above the 3% level in the coming months, bank policy makers will be under increased pressure to hike rates sooner rather than later.
USD/CAD Technical
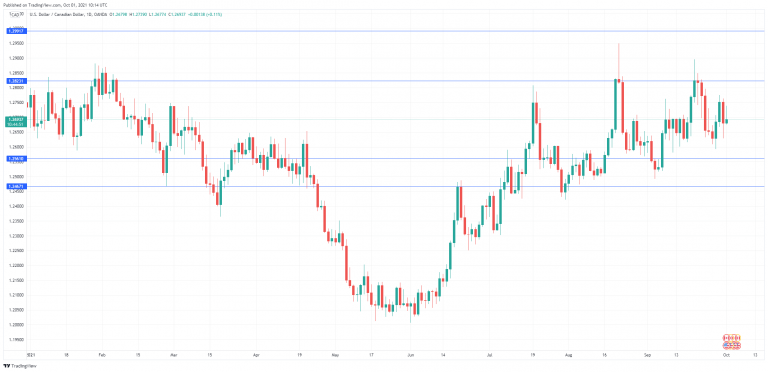
- USD/CAD faces resistance at 1.2823. Above, there is support at 1.2991, protecting the symbolic 1.30 level
- There is support at 1.2561 and 1.2489
Inflation Continues To Run Hot In Europe
Notes/Observations
- US Congress averted govt shutdown for now with 9-week extension.
- House delayed vote on $1.0T infrastructure bill until Friday as Democrat rifts persist.
- Energy price increases are adding to concerns about inflation.
- Major European PMI Manufacturing hitting lowest level of expansion since the start of the year (Beats: UK, Italy; Misses: Germany, France, Spain).
- Euro Zone Sept Flash CPI at decade highs.
- Polish inflation at 20-year high with MPC facing pressure to hike.
Asia
- Australia Sept Final PMI Manufacturing: 56.8 v 57.3 prior (confirms 16th month of expansion).
- Japan Sept Final PMI Manufacturing: 51.5 v 51.2 prelim (confirm the 8th straight month of expansion).
- Japan Aug Jobless Rate: 2.8% v 2.9%e.
- Japan Q3 Tankan Large Manufacturing Index: 18 v 13e; Outlook Survey: 14 v 14e (aka Japan business mood improved).
- Chinese markets closed for a week from today (reopens Fri, Oct 8th).
Europe
- France PM Castex stated that Govt to enact a 'tariff shield' to ease the cost of rising billsand put a halt to gas price increases; Gas prices were expected to decline again from April.
Americas
- Senate passed bill to fund the govt through Dec 3rd (as expected); House voted to approve stopgap funding bill, which averted a Friday govt shutdown. President Biden signed bill.
- House Leadership Aide stated that the House would NOT vote on $1.0T infrastructure bill on Sept 30th and would return Friday (Oct 1st) to attempt to vote on bill.
- Fed Chair Powell House testimony noted that the Fed found itself in difficult situation in regards to tension between inflation and employment; Inflation was well above target but still far away from full employment.
- Mexico Central Bank (Banxico) again raised the raise the Overnight Rate by 25bps to 4.50% (as expected).
Energy
- OPEC+ said to be considering options for releasing more oil to the market at next week's meeting beyond the plan for adding 400K bpd in Nov.
Speakers/Fixed income/FX/Commodities/Erratum
Equities
- Indices [Stoxx600 -1.2% at 449.4, FTSE -0.7% at 7,035, DAX -0.7% at 15,147, CAC-40 -0.6% at 6,482, IBEX-35 -0.6% at 8,743, FTSE MIB -0.8% at 25,502, SMI -1.2% at 11,508, S&P 500 Futures -0.5%].
- Market Focal Points/Key Themes: European indices open lower across the board but moderated loses as the session progressed; less negative sectors include utilities and telecom; sectors leading to the downside include materials and industrials; Bilia reaches agreement with Volvo Cars in Sweden; Orange acquires take in Orange Bank; Daimler shareholders to vote on truck spin-off; earnings expected in the upcoming US session include S&P Global.
Equities
- Consumer discretionary: AO World AO.UK -18.1% (trading update), Bilia BILIA.SE +0.4% (agreement with Volvo Cars), Euromoney ERM.UK +3.0% (trading update).
- Energy: EDF EDF.FR +4.3% (electricity tariffs remain in place).
- Financials: Icade ICAD.FR +0.4% (suspends IPO of health unit), Sampo SAMAS.FI +0.7% (buyback).
- Healthcare: METabolic EXplorer METEX.FR 5.0% (results).
- Industrials: Gulf Marine Services GMS +4.3% (trading update).
- Technology: Darktrace DARK.UK -5.3% (stake sale), Iomart IOM.UK -14.1% (cuts outlook).
- Utilities: Engie ENGI.FR +1.6% (France to block further price hikes).
Speakers
- Poland Central Bank's Hardt stated that might need steeper hike unless MPC acted now; needed urgently to hike by 15bps.
Currencies/Fixed income
- USD continued to hold onto its recent weekly gains as the prospects for Fed tapering gathered momentum. Dealers continued looking for formally announce the start of tapering in November by the Fed.
- EUR/USD remained under the 1.16 level in the session as Major European PMI Manufacturing continued to move off recent record highs and drift to their lowest level of expansion since the start of the year. Rate divergence also weighing upon the Euro as market participants are reluctant to price in monetary policy normalization any time soon.
Economic data
- (DE) Germany Aug Retail Sales M/M: 1.1% v 1.5%e ; Y/Y: 0.4% v 1.8%e.
- (RU Russia Sept PMI Manufacturing: 49.8 v 47.1e (4th straight contraction).
- (SE) Sweden Sept PMI Manufacturing: 64.6 v 60.1 prior (16th month of expansion).
- (FR) France Aug YTD Budget Balance: -€178.0B v -€166.6B prior.
- (AT) Austria Sept Preliminary CPI M/M: 0.4% v 0.1% prior; Y/Y: 3.2% v 3.1% prior.
- (NL) Netherlands Sept PMI Manufacturing: 62.0 v 65.8 prior (14th straight expansion).
- (PL) Poland Sept PMI Manufacturing: 53.4 v 54.8e (14th straight expansion).
- (TR) Turkey Sept PMI Manufacturing: 52.5 v 54.1 prior (4th straight expansion).
- (HU) Hungary Sept Manufacturing PMI: 52.1 v 54.5e (6th straight expansion).
- (HU) Hungary July Final Trade Balance: -€0.2B v -€0.2B prior.
- (ES) Spain Sept Manufacturing PMI: 58.1 v 58.2e(8th month of expansion).
- (CH) Swiss Sept PMI Manufacturing: 68.1 v 65.5e (14th straight expansion).
- (CZ) Czech Republic Sept PMI Manufacturing: 58.0 v 58.3e (13th straight expansion).
- (TH) Thailand Sept Business Sentiment Index: 42.6 v 40.0 prior.
- (IT) Italy Sept Manufacturing PMI: 59.7 v 59.5e (15th month of expansion).
- (FR) France Sept Final PMI Manufacturing: 55.0 v 55.2 prelim (confirmed 10th month of expansion but lowest reading since Jan 2021).
- (DE) Germany Sept Final PMI Manufacturing: 58.4 v 58.5 prelim (confirmed 15th month of expansion).
- (EU) Euro Zone Sept Final PMI Manufacturing: 58.6 v 58.7 prelim (confirmed 15th month of expansion but lowest since Feb).
- (GR) Greece Sept Manufacturing PMI: 58.4 v 59.3 prior (7th month of expansion).
- (NO) Norway Sept PMI Manufacturing: 59.2 v 61.7 prior (13th month of expansion).
- (NO) Norway Sept Unemployment Rate: 2.4% v 2.5%e.
- (RU) Russia Narrow Money Supply w/e Sept 24th (RUB):14.41 T v 14.54T prior.
- (PL) Poland Sept Preliminary CPI M/M: 0.6% v 0.3%e; Y/Y: 5.8% v 5.5%e (5th month above target and highest since 2001).
- (UK) Sept Final PMI Manufacturing: 57.1 v 56.3 prelim(confirmed 15th straight expansion and lowest since Feb).
- (EU) Euro Zone Sept Advance CPI Estimate Y/Y: 3.4% v 3.3%e (highest annual pace since 2011); CPI Core Y/Y: 1.9% v 1.9%e.
- (DK) Denmark Sept PMI Survey: 65.2 v 67.3 prior (7th straight expansion).
- (ZA) South Africa Sept Manufacturing PMI: 56.8 v 53.3e (2nd month of expansion).
Fixed income issuance
- None seen.
Looking ahead
- (RO) Romania Sept International Reserves: No est v $46.7B prior.
- (ZA) South Africa Sept Naamsa Vehicle Sales Y/Y: No est v 24.6% prior.
- (IT) Italy Sept Budget Balance: No est v €9.1B prior.
- (US) Sept Total Vehicle Sales data in session.
- (AR) Argentina Sept Government Tax Revenue (ARS): No est v 1.005T prior.
- 05:25 (EU) Daily ECB Liquidity Stats.
- 05:30 (IN) India to sell combined INR240B in 2028, 2031 and 2061bonds.
- 05:30 (ZA) South Africa to sell combined ZAR1.2B in I/L 2033, 2038 and 2050 Bonds.
- 06:00 (UK) DMO to sell £2.0B in 1-month, 3-month and 6-month bills (£0.5B, £0.5B and £1.0B respectively).
- 06:45 (US) Daily Libor Fixing.
- 07:00 (IN) India announces upcoming bill issuance (held on Wed); to sell combined INR170B in 3-month, 6-month and 12-month Bills on Oct 6th.
- 07:30 (CL) Chile Aug Economic Activity Index (Monthly GDP) M/M: No est v 1.4% prior; Y/Y: 16.9%e v 18.1% prior.
- 07:30 (IN) India Weekly Forex Reserve w/e Sept 24th: No est v $639.6B prior.
- 08:00 (CZ) Czech Sept Budget Balance (CZK): No est v -298.1B prior.
- 08:00 (UK) Daily Baltic Dry Bulk Index.
- 08:00 (ES) Spain Debt Agency (Tesoro) announces upcoming bond issuance.
- 08:30 (US) Aug Personal Income: 0.2%e v 1.1% prior; Personal Spending: 0.7%e v 0.3% prior; Real Personal Spending: +0.4%e v -0.1% prior.
- 08:30 (US) Aug PCE Deflator M/M: 0.3%e v 0.4% prior; Y/Y: 4.2%e v 4.2% prior.
- 08:30 (US) Aug PCE Core Deflator M/M: 0.2%e v 0.3% prior; Y/Y: 3.5%e v 3.6% prior.
- 08:30 (CA) Canada July GDP M/M: -0.2%e v +0.7% prior; Y/Y: 5.0%e v 8.0% prior.
- 08:30 (CA) Canada Aug MLI Leading Indicator M/M: No est v 1.0% prior.
- 09:00 (BR) Brazil Sept PMI Manufacturing: No est v 53.6 prior.
- 09:30 (CA) Canada Sept Manufacturing PMI: No est v 57.2 prior.
- 09:45 (US) Sept Final Markit PMI Manufacturing: 60.5e v 60.5 prelim.
- 10:00 (US) Sept Final University of Michigan Confidence: 71.0e v 71.0 prelim.
- 10:00 (US) Aug Construction Spending M/M: 0.3%e v 0.3% prior.
- 10:00 (US) Sept ISM Manufacturing: 59.5e v 59.9 prior; Prices Paid: 78.5e v 79.4 prior.
- 10:00 (MX) Mexico Aug Total Remittances: $4.4Be v $4.5B prior.
- 10:00 (MX) Mexico Central Bank Economist Survey.
- 10:30 (MX) Mexico Sept PMI Manufacturing: No est v 47.1 prior.
- 11:00 (CO) Colombia Sept PMI Manufacturing: No est v 53.2 prior.
- 11:00 (CO) Colombia Aug Exports: $3.6Be v $3.3B prior.
- 11:00 (PE) Peru Sept CPI M/M: 0.2%e v 1.0% prior; Y/Y: 4.8%e v 5.0% prior.
- 11:00 (EU) Potential sovereign ratings after European close.
- 11:00 (US) Fed’s Harker.
- 11:30 (DE) ECB’s Schnabel (Germany).
- 12:00 (RU) Russia Q2 GDP (3rd reading) Y/Y: 10.5%e v 10.5% prelim.
- 12:00 (RU) Russia Aug Unemployment Rate: 4.5%e v 4.5% prior.
- 12:00 (RU) Russia Aug Real Retail Sales Y/Y: 4.9%e v 4.7% prior.
- 12:00 (RU) Russia July Real Wages Y/Y: 2.6%e v 4.9% prior.
- 12:00 (IT) Italy Sept New Car Registrations Y/Y: No est v -27.3% prior.
- 13:00 (MX) Mexico Sept IMEF Manufacturing Index: No est v 51.3 prior; Non-Manufacturing Index: No est v 50.1 prior.
- 13:00 (US) Weekly Baker Hughes Rig Count.
- 13:00 (US) Fed’s Mester.
- 14:00 (BR) Brazil Sept Trade Balance: $4.5Be v $7.7B prior; Total Exports: $25.3B v $27.2B prior; Total Imports: $20.6Be v $19.6B prior.
Gold Analysis: Breaks Pattern
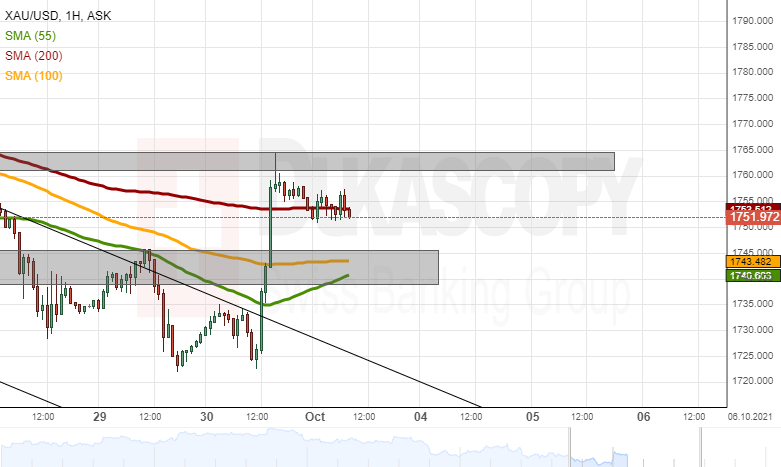
The yellow metal has clearly broken the resistance of the channel down pattern. It occurred in a sharp four hour jump, which also passed the resistance of the 55, 100 and 200-hour simple moving averages. Eventually, the metal's price was stopped by the 1,765.00 level's resistance.
On Friday, the pair traded sideways around the 200-hour SMA and the 1,755.00 level.
If the metal's price surges, it would once again test the resistance of the 1,765.00 mark. On the other hand, a potential decline could find support in the 1,745.00 level and the 55 and 100-hour simple moving averages.
USD/JPY Analysis: Bounces Off 112.00
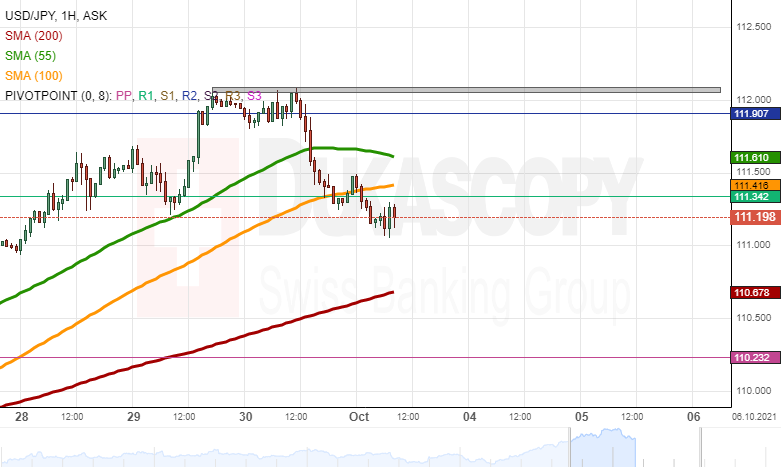
The USD/JPY made three attempts to pass the 112.00 level before bouncing off it. At mid-day on Friday the rate had declined and almost reached the 111.00 level.
If the 111.00 level provides support, the pair might recover. A potential recovery could encounter resistance at the weekly R2 simple pivot point at 111.34, the 100-hour simple moving average at 111.42 and the 55-hour SMA at 111.61. Above these levels, the weekly R3 simple pivot point at 111.91 and the 112.00 mark would once again act as resistance.
However, a decline of the USD/JPY below the 111.00 level, might result in the rate looking for support in the 200-hour simple moving average near 110.70.
GBP/USD Analysis: Respects Hourly SMA
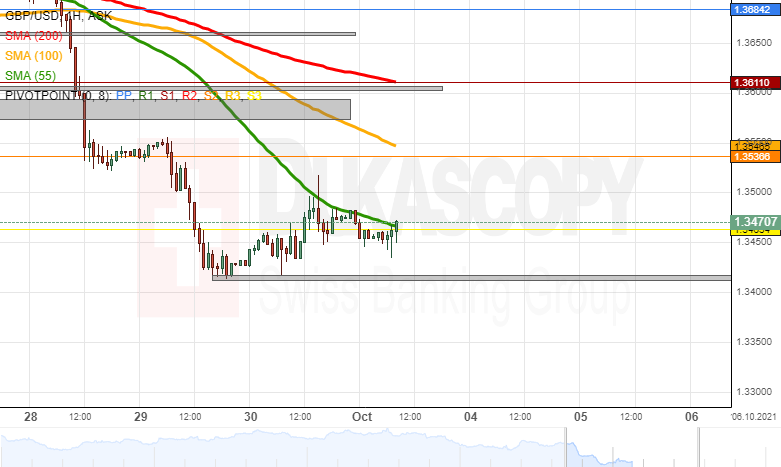
The GBP/USD found support on Wednesday and Thursday above the 1.3400 level. The support zone has been marked on the hourly candle chart.
After finding support, the pair surged to the resistance of the 55-hour simple moving average and the 1.3500 level. These levels provided resistance and the 55-hour SMA began to push the rate down. By the middle of Friday's trading hours, the currency exchange rate had been pushed below the 1.3450 level.
If the simple moving average continues to provide resistance and push the rate down, the GBP/USD could once again look for support in the 1.3410/1.3417 zone. Below this zone, the 1.3350 and 1.3300 levels could provide additional support.
On the other hand, the SMA could fail to provide resistance. In this case the combination of the weekly S2 simple pivot point at 1.3537 and the 100-hour SMA near 1.3540 might serve as resistance.
EUR/USD Analysis: Decline Finds Support
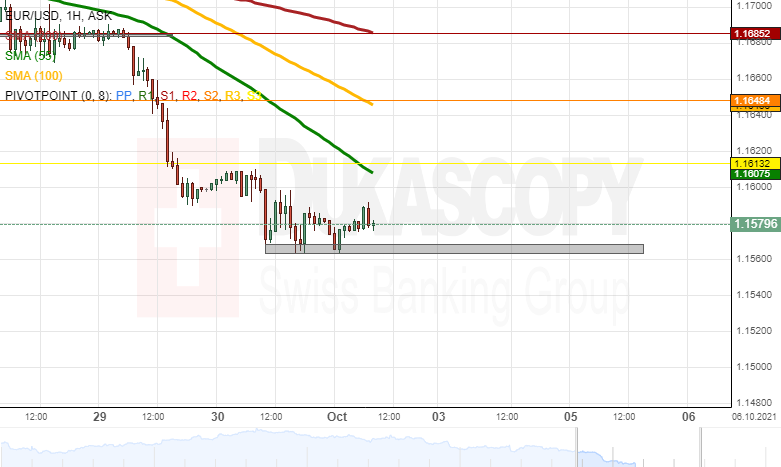
The decline of the EUR/USD resumed on Thursday. However, it immediately found support in the 1.1563/1.1568 zone. The zone held the pair up from 10:00 GMT up to 01:30 GMT, when a recovery appeared to have started.
During the early hours of Friday's trading hours, the currency exchange rate was approaching the resistance of the 1.1600 level, which could be soon strengthened by the 55-hour simple moving average.
In the case that the pair breaks the resistance of the 1.1600 level and the 55-hour simple moving average, additional resistance could be found in the weekly S3 simple pivot point at 1.1613. Higher above, the weekly S2 and the 100-hour simple moving average might serve as resistance at 1.1648.
However, a potential decline of the pair would look for support in the 1.1563/1.1568 zone. Below the zone, there are no additional technical support levels. Note that the rate has not been this low since July 2020.
Stagflation Risks Bite Stocks, Safe Havens Shine
- Stocks under pressure as investors grapple with ‘mini stagflation’
- Yen and gold shine amid flight to safety, dollar stays elevated
- ISM manufacturing survey and Fed speakers in focus today
Wall Street bleeds
Worsening supply chain disruptions and a raging energy crisis have joined forces lately to reawaken fears of a stagflationary blow to the global economy. Stagflation refers to a situation where growth slows down but inflation remains hot, a combination that hasn’t emerged since the 1970s.
With energy bills skyrocketing, the risk is that companies will see their profit margins get squeezed and pass those costs down to consumers, at a time when supply bottlenecks are already restraining growth and central banks are moving towards higher rates. Of course, this is not the 1970s - workers don’t have nearly as much bargaining power to enable the vicious price-wage growth spiral that dominated back then.
Still, this could be a much smaller modern version of that, let’s call it ‘stagflation light’. Central banks can’t do much about cost-push inflation, so it’s a lose-lose situation. If they raise rates to fight supply-powered inflation, that might do more harm than good by unnecessarily cooling demand and growth.
This threat seems responsible for the latest round of selling in stock markets. The S&P 500 lost 1.2% yesterday and futures point to more losses today after the index sliced through a crucial support region. The twist is that the roles have reversed and tech stocks have been more resilient lately as the risk aversion has also started to infect bond markets, pushing yields back down a touch.
While ‘stagflation light’ worries could continue to torment markets for now as these risks get priced in and valuations correct back to earth, this is unlikely to evolve into full-blown panic either. This is a temporary shock that’s more likely to leave a scratch instead of deep wounds, so it could turn into a buying opportunity before very long. After all, there is still no real alternative to equities.
Safe havens back in fashion
With stocks under fire and investors running for cover, defensive assets are back in vogue. We have reached the point where traders are willing to rotate back into bonds for safety, cooling yields and breathing new life into the yen and gold, which are highly sensitive to any moves in interest rates.
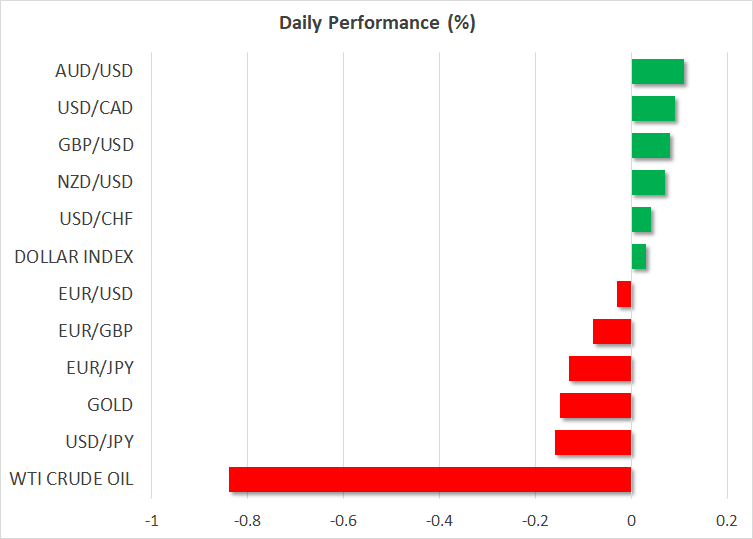
The untold story in the FX arena is that the US dollar is the most insulated major currency from the unfolding energy crisis - along with the Canadian dollar - as North America is essentially self-sufficient in power. Rising power prices globally will inevitably hit the US too, but mainly through spillover effects, in contrast to Europe and Asia. This implies less pain for the American economy from this whole ordeal.
In politics, a US government shutdown has been averted for now, with Congress passing a bill that will ensure funding until early December. However, the debt ceiling hasn’t been raised, which means either a bipartisan agreement has to be reached by October 18 or the Democrats have to do it alone through the budget reconciliation process. Either way, this isn’t a real risk. Neither party is interested in engineering the first default in the nation’s history.
Key data and Fed speakers
As for today, all eyes will be on the ISM manufacturing PMI from America. It will reveal whether supply chains worsened further in September and provide some early clues around next week’s employment report. There’s also a batch of US data releases for August, but that's ‘old news' at this point.
Finally, we will hear from the Fed’s Harker (15:00 GMT) and Mester (17:00 GMT). Looking into next week, besides the latest edition of nonfarm payrolls, there are also central bank meetings in Australia and New Zealand, as well as an OPEC+ gathering.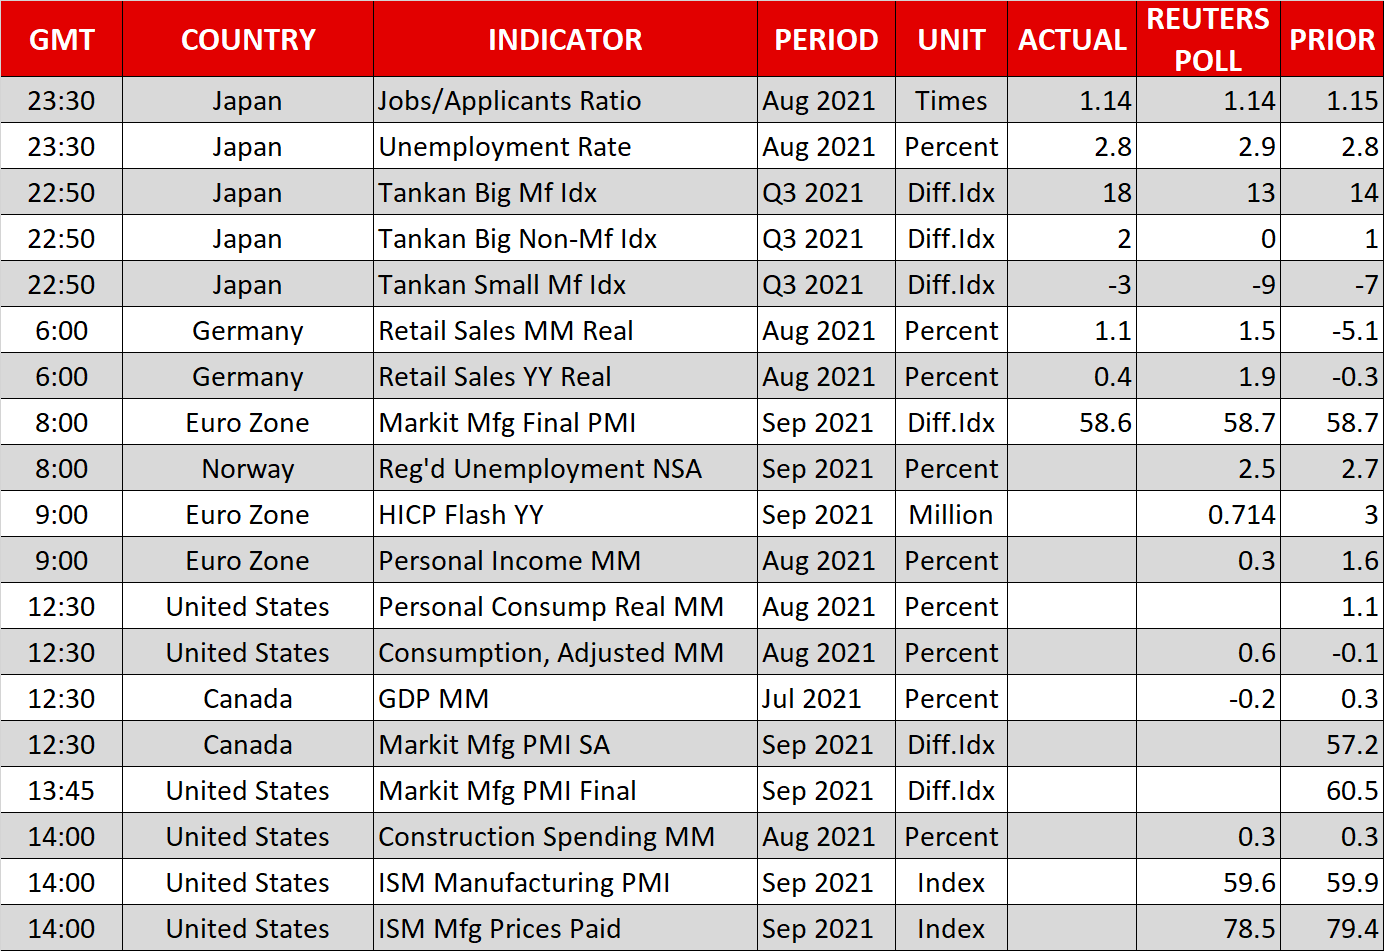
Oil Steady, Gold Rallies
Oil markets are remarkably calm in Asia
Oil prices had a volatile session overnight, trading in a large range. Ultimately, though, both Brent crude and WTI finished almost unchanged, up 0.30% at USD 78.35 and USD 75.05 a barrel. In Asia, the absence of China has had an immediate impact on volumes with both contracts almost unchanged at USD 79.50 and USD 75.00 a barrel.
If China’s state-owned energy companies have indeed been instructed to “do whatever it takes” to secure winter energy supplies, it is unlikely that oil prices can fall very far, even if most China buying occurs in the natural gas and coal markets. Similarly, the Reuter’s reporting around Monday’s OPEC+ ministerial meeting leaves me with the impression that the grouping is only prepared to, or can only apply a band-aid to the energy supply crunch.
Therefore, although speculative oil futures markets could see some sharp intraday moves lower, as occurred yesterday on OPEC+ hopes, they are likely to rebound just as quickly, inevitably meeting a wall of buyers on the dips. The scramble for pre-winter energy supplies from the northern hemisphere heavyweights is not something that can be magically alleviated by physical markets in the short term.
Brent crude’s overnight low at USD 76.70 is initial support, but only a daily close under USD 76.00 temporarily changes the bullish outlook. It has resistance just above USD 79.00 followed by USD 81.00 a barrel. WTI has support at USD 73.00 a barrel, which held overnight, with resistance at USD 76.00 and USD 76.60 a barrel.
The potential for disappointment from the OPEC+ meeting on Monday is high. A one-month increase of 800,000 bpd in November just won’t cut it for markets scrambling for energy supplies. Nor, it appears, is OPEC+ overly concerned right now either, with a chance to replenish state coffers seemingly irresistible right now. Don’t expect much hope from the world’s swing producer, Saudi Arabia, either. A unilateral weekend announcement opening the pumps, for example, would undermine its leadership and the cohesion of OPEC+.
Gold optimists return
It seems that you just can’t keep the gold bugs down for long, even if the light at the end of the tunnel is the train coming the other way. Gold staged an impressive rally overnight, rising by 1.76% to USD 1757.00 an ounce, a 30 dollar move. There was no clear singular reason for gold’s powerful rally; US yields and the US dollar edged only slightly lower, and nothing materially changed in the world, with US jobless claims only slightly higher than expected. In Asia, gold has hardly moved, easing slightly to USD 1753.00 an ounce today.
I would certainly agree that the uncertainty sweeping the world has prompted risk-hedging buying and rightly so. Still, despite seeing those flows all week, gold had still sunk until yesterday when it unwound the whole week’s losses. Some loading up ahead of the one-week China holiday may have seen greater than usual haven flows, but the whole move smacks of hope and false optimism and speculative zeal over reality.
This looks like a sucker’s rally to me as none of the fundamentally bearish factors for gold, the Fed taper, higher US yields and a stronger US dollar, has changed. Join in the fun at your peril. Gold has resistance at USD 1763.00, the overnight high, followed by USD 1780.00 and USD 1800.00 an ounce. Support is distant at the USD 1622.00 double bottom followed by USD 1720.00, USD 1700.00 and long-term support in the USD 1680.00 an ounce region.