Sample Category Title
The Deficit On Energy Resources Increaes Ahead Of The Winter Season
US stock indices ended yesterday's trading in the negative area. Over the month, the S&P 500 decreased by 4.8%, the Dow Jones lost 4.3%, and the Nasdaq lost 5.3%. The S&P 500 and Nasdaq indices have had their worst month-to-month performance since March 2020. Why is the stock market going down? While investors expect the Federal Reserve to cut its stimulus, the concerns about slowing economic growth, rising inflation, supply chain problems, the global energy crisis, and regulatory risks emanating from China are also increasing. The end of the month in the stock market was the time of increased volatility, hedging, and economic concerns. As a result, investors and hedge funds are rebalancing their investment portfolios. It should also be noted that the stock market saw record money outflows last week. However, many investment banks and hedge funds are still urging investors to buy all drawdowns.
Some Congress members have raised the Fed’s issue of ending the QE program as a condition for a budget deal.
Boeing received a $23.8 billion contract from the US Department of Defense.
European stock indices also closed lower yesterday. The British FTSE 100 decreased by 0.31%, German DAX lost 0.68%, French CAC 40 decreased by 0.62%, Italian FTSE MIB and Spanish IBEX 35 lost 0.21% and 0.94% respectively.
According to Bloomberg Economics, Eurozone inflation data for September is likely to be pessimistic. Inflation is expected to be clearly above the European Central Bank's 2% target in all major economies in the region. German inflation accelerated to 4.1% in September from 3.9% in August, the highest rate since 1993. In September, inflation in France and Italy also accelerated as households in the Eurozone's two largest economies faced a jump in energy prices. Unemployment in the Eurozone fell to 7.5% in August. European natural gas and electricity prices jumped to record highs, signaling that supply shortages will only worsen before the winter.
Oil is rising as potential demand growth caused by the global energy crisis counteracts the impact of the crisis on the overall economy. According to preliminary data, OPEC+ is considering throwing more oil on the market at next week's meeting because of a strong deficit.
Gold is on the way to its biggest monthly loss since June, as the prospect of stimulus cuts pressures the precious metals. Yesterday, gold and silver increased sharply amid a temporary drop in US government bond yields.
Manufacturing activity in Asia rebounded in September after some countries eased restrictions associated with the Covid-19 virus. In Asia, all resources for the electricity generation, including gas, coal, and water) are in short supply, and the situation doesn’t seem to improve anytime soon. Asian stock indices are falling due to increasing inflation concerns. Australian stocks decreased more than 2%, South Korea's Kospi is down 1.5%, and the MSCI Asia Pacific Index decreased by 1.1%. Japan's Nikkei 225 index lost more than 2%.
Japan's next prime minister, Fumio Kishida, may have no choice but to sell most government bonds worth hundreds of billions of dollars to finance the pandemic package.
Main market quotes:
- S&P 500 (F) 4,307.54 −51.92 (−1.19%)
- Dow Jones 33,843.92 −546.80 (−1.59%)
- DAX 15,260.69 −104.58 (−0.68%)
- FTSE 100 7,086.42 −21.74 (−0.31%)
- USD Index 94.25 -0.08 (-0.09%)
Important events for today:
- Japan Unemployment Rate (m/m) at 02:30 (GMT+3);
- Japan Tankan Manufacturing Index (m/m) at 02:50 (GMT+3);
- German Manufacturing PMI (m/m) at 10:55 (GMT+3);
- Eurozone Manufacturing PMI (m/m) at 11:00 (GMT+3);
- UK Manufacturing PMI (m/m) at 11:30 (GMT+3);
- Eurozone Consumer Price index (m/m) at 12:00 (GMT+3);
- US PCE price index (m/m) at 15:30 (GMT+3);
- Canada GDP (m/m) at 15:30 (GMT+3);
- US ISM Manufacturing PMI (m/m) at 17:00 (GMT+3);
- US Michigan Consumer Sentiment (m/m) at 17:00 (GMT+3).
UK PMI manufacturing finalized at 57.1, descending towards a bout of stagflation
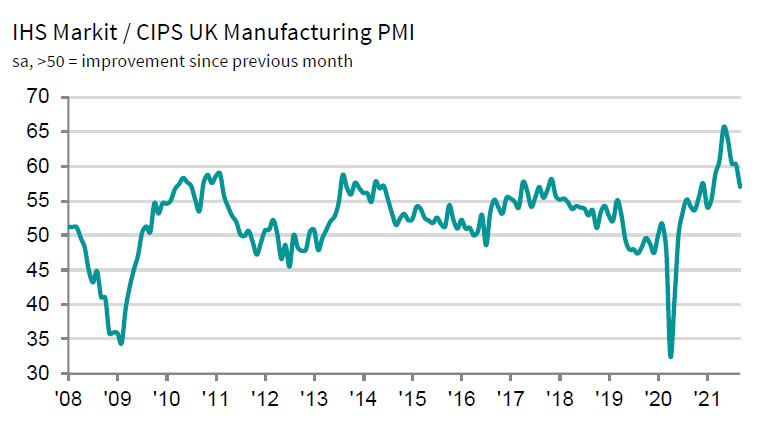
UK PMI Manufacturing was finalized at 57.1 in September, down from August's 60.3. Markit said output and new orders rose at slowest rates since February. New export business fell for the first time in eight months.
Rob Dobson, Director at IHS Markit, said: "The September PMI highlights the risk of the UK descending towards a bout of 'stagflation', as growth of manufacturing output and new orders eased sharply while input costs and selling prices continued to surge higher.... With little sign of resolution to these issues, manufacturers, especially smaller firms with lower market power or capacity flexibility, will continue to be buffeted by these headwinds for the foreseeable future, hinting at a tough autumn and winter ahead for many firms."
GBPUSD Falls Without A Parachute
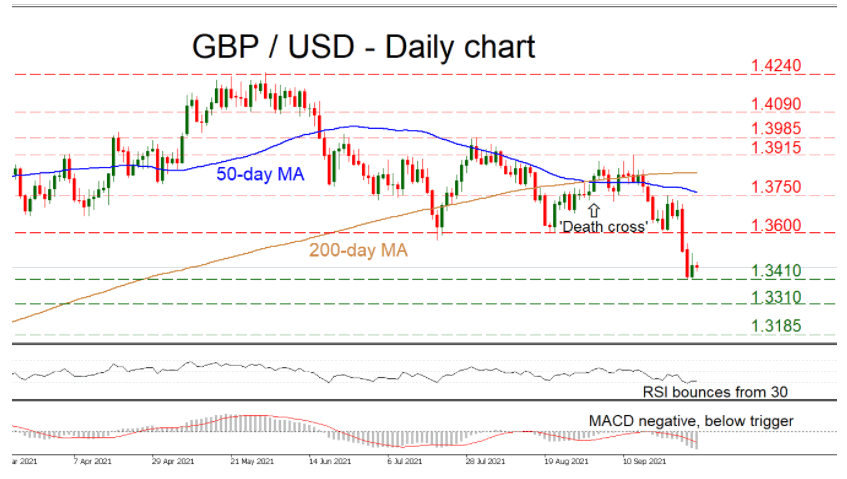
GBPUSD sliced through some crucial support levels this week, erasing all its gains for the year. The pair rebounded off the 1.3410 support region, but there’s a series of lower highs and lower lows forming since early June. Indeed, the 50-day moving average (MA) has also crossed below the 200-day one, forming a ‘death cross’. All this points to a downtrend.
The short-term oscillators are mixed, with the RSI reflecting the latest rebound in the price action but the MACD staying firmly negative and below its red trigger line.
If sellers remain in control and manage to pierce below the 1.3410 barrier, their next target could be the 1.3310 zone, marked by the lows in late December. If that’s violated too, the focus would then turn towards the 1.3185 area.
Now in case buyers retake the reins, the first test to the upside would be the 1.3600 hurdle, which acted as support in recent months and may now provide resistance. A potential break above it could open the door for the 1.3750 neighborhood, which also encompasses the 50-day MA.
In short, the latest breaks have turned the picture bearish. A move below 1.3410 would reinforce the negative outlook.
AUD/NZD Still In Downtrend But The Price Is Retracing
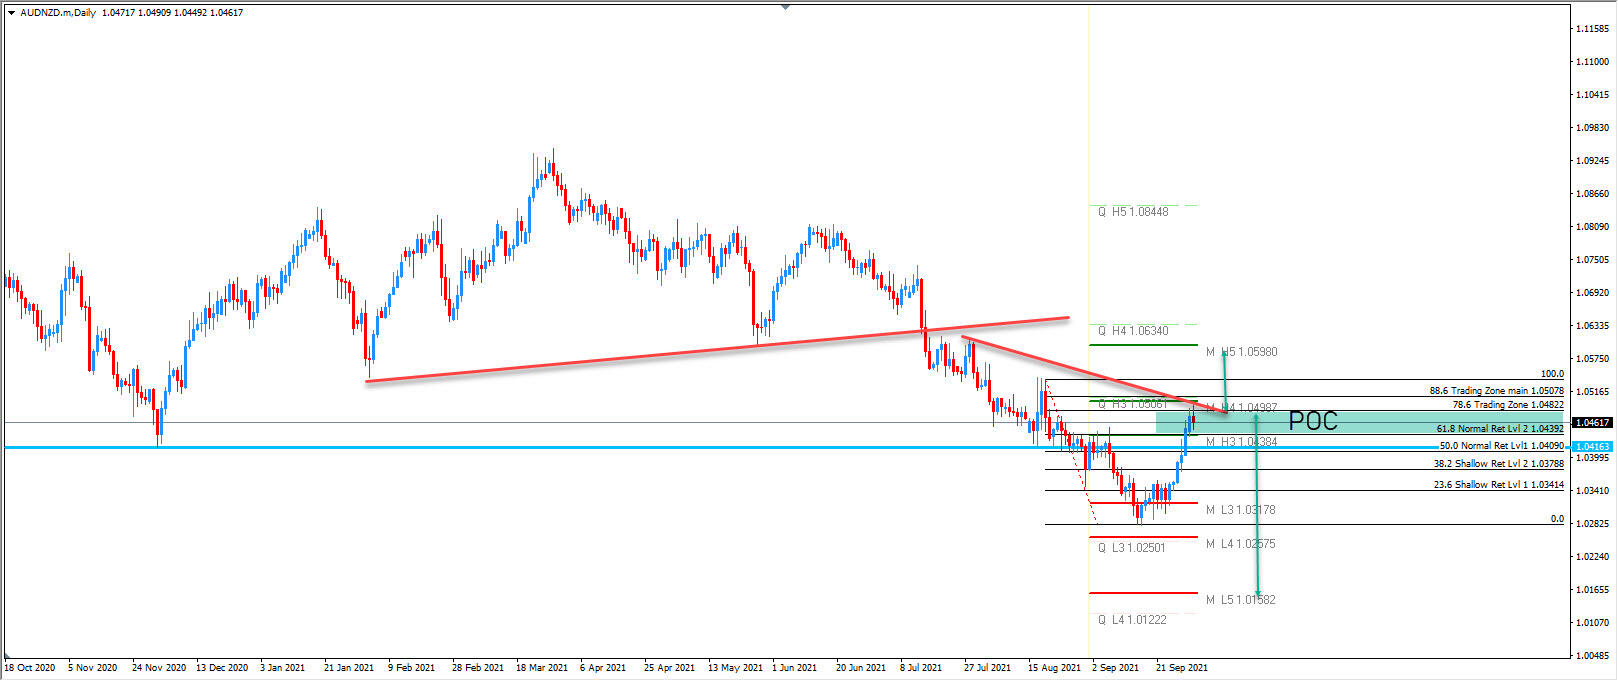
AUD/NZD is in downtrend and the price has retraced to the POC zone. We might see a mover soon.
1.0440-82 is the POC zone where the price could bounce up or down. If 1.0498 breaks to the upside we should see 1.05980. A move below 1.0440 should be targeting 1.0438 and 1.03178 at least. Below those levels we should see a new low of 1.0158.
US Stocks: Ready And Just Steady
September confirmed its title as the worst month of the year for US equities. Seasonal patterns suggest a much more optimistic view of the market outlook for the rest of the year. However, investors should not rush to stock purchases right from the first minutes of the new month and quarter.
The calculation on the history of the last 50 years available for the Nasdaq Composite (dominated by high-tech companies now) and for the Wilshire5000 Total Market Full Cap (the broadest US market index) makes for an optimistic view of the last quarter.
In October, the markets have on average managed to overcome the previous month's downturn, with the greatest growth momentum in equities occurring between November and January, when the average monthly gain exceeds 1.5%.
But October had the most devastating episodes of market declines, with the Nasdaq lost 27% and Wilshire sank 23% in 1987, and both indices decreased 17.5% in October 2008. The best October performance was in 1974, with the Nasdaq up 17.2% and Willshire up 17.6%.
A closer look at the latest development points to a correction in the stock markets on tightening the monetary policy tone. The relative strength index on the daily Nasdaq charts is approaching 30, an oversold area where it has not been since March 2020, and this could be a harbinger of increased volatility in the coming days. A buy signal in such cases is a return of the RSI to neutral territory above 30 rather than a mechanical exit to oversold territory.
The bears had the upper hand recently. The Nasdaq is losing for the fifth consecutive trading session, dipped below the previous lows. From the current levels near 14650, the index may not encounter any significant obstacles until the area of 14000 (-4.5% from the current levels), where the February and April peaks and the 200-day moving average are situated.
A more profound decline of the index would reflect a much more negative process than the regular correction and could indicate an economic recession. Potentially, this cannot be ruled out in case of an energy crisis and the Fed's intention to suppress inflation. However, such a development looks like a highly pessimistic scenario, with a low chance of materialising.
In our view, the markets are in the process of reassessing the overly optimistic expectations and valuations that have dragged equities up in recent months, but with monetary policy maintaining a broadly stimulative bias and the economy maintaining an impressive growth rate, which has caused logistical problems. But this situation promises to rectify itself in the coming weeks.
Daily Technical Analysis
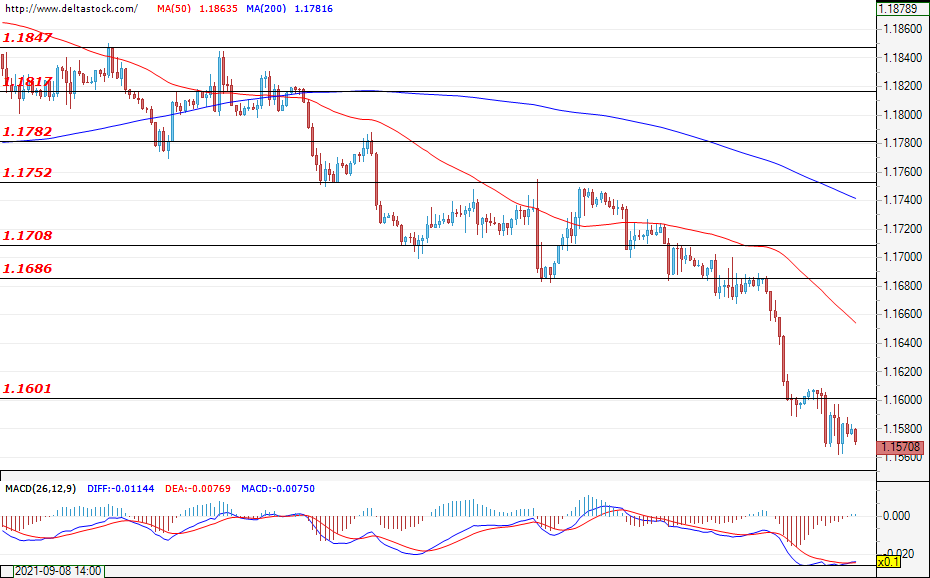
EUR/USD
Current level - 1.1570
The common European currency continues to depreciate against the dollar and yesterday violated the support level of 1.1600. The expectations are for the downtrend to continue, leading the pair towards a test of the support level of 1.1420 that is coming from the higher time frames. In the positive direction, the previously mentioned level of 1.1600 is now acting as a resistance for the pair. During today’s session, volatility will most likely spike after the euro area CPI data is announced at 09:00 GMT.
| Resistance | Support | ||
| intraday | intraweek | intraday | intraweek |
| 1.1600 | 1.1752 | 1.1560 | 1.1520 |
| 1.1686 | 1.1782 | 1.1420 | 1.1410 |
USD/JPY
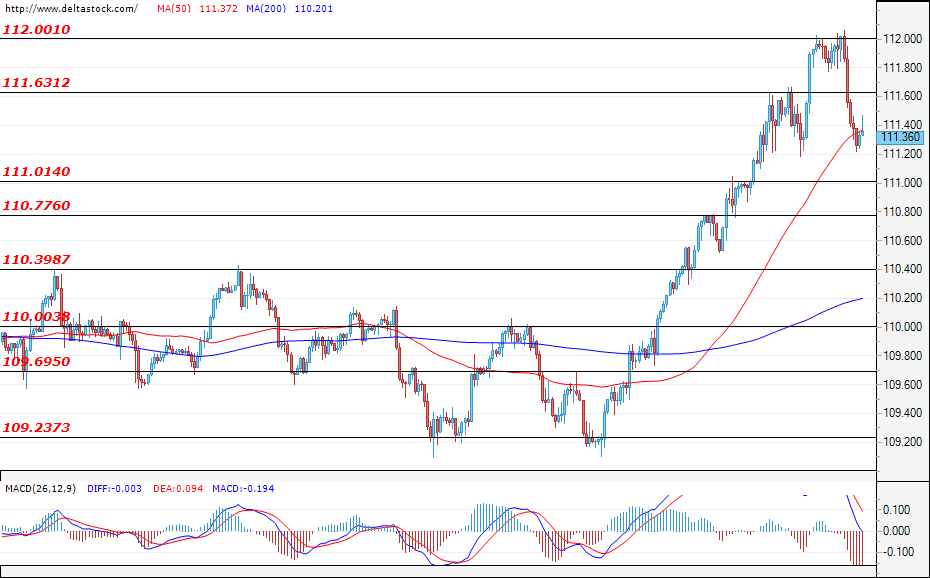
Current level - 111.36
The Ninja is currently found in a consolidation phase at around 111.40. The expectations are for the pair to retest the resistance level of 112.00 once the consolidation is over, and head towards the resistance level of 113.50 in case the test is successful. In the negative direction, the first support level is found at 111.01.
| Resistance | Support | ||
| intraday | intraweek | intraday | intraweek |
| 112.00 | 112.60 | 111.63 | 110.77 |
| 112.30 | 113.50 | 110.01 | 110.00 |
GBP/USD
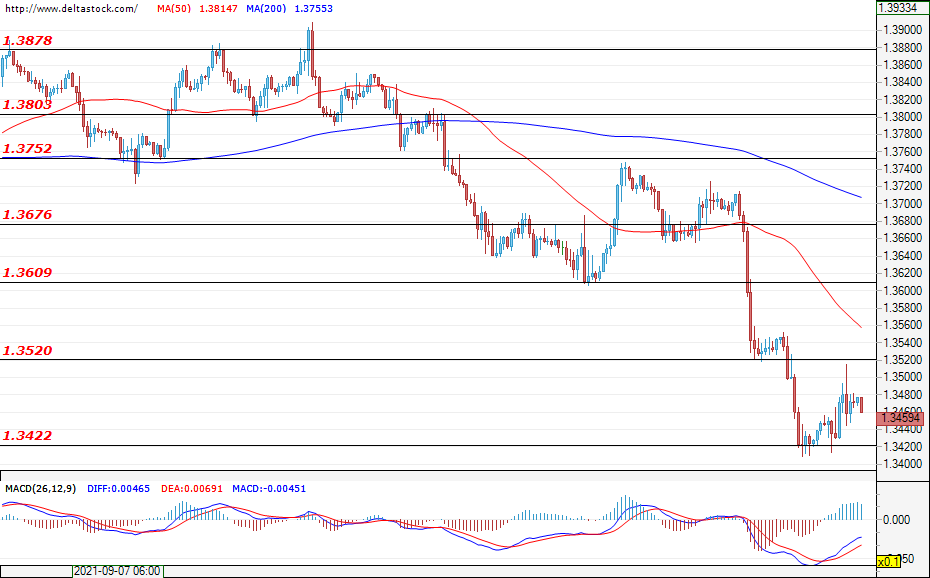
Current level - 1.3459
The support level of 1.3422 managed to stop the decline of the Cable and, at the time of writing, the pair is in a consolidation phase at around 1.3470. The expectations are for the pair to retest the support at 1.3422 and, if it manages to violate the support, to head towards the support level of 1.3360 that is coming from the higher time frames. In the positive direction, the first resistance level is found at 1.3520
| Resistance | Support | ||
| intraday | intraweek | intraday | intraweek |
| 1.3520 | 1.3676 | 1.3422 | 1.3400 |
| 1.3609 | 1.3752 | 1.3400 | 1.3250 |
EUR/USD Pair Is Now Attempting A Recovery From The 1.1562 Low
The Euro started a fresh decline from well above 1.1700 against the US Dollar. The EUR/USD pair traded below the 1.1650 and 1.1620 support levels.
The pair even declined below the 1.1600 zone and settled below the 50 hourly simple moving average. A low is formed near 1.1562 and the pair is now attempting a recovery. It surpassed a short-term bearish trend line with resistance near 1.1576 on the hourly chart.
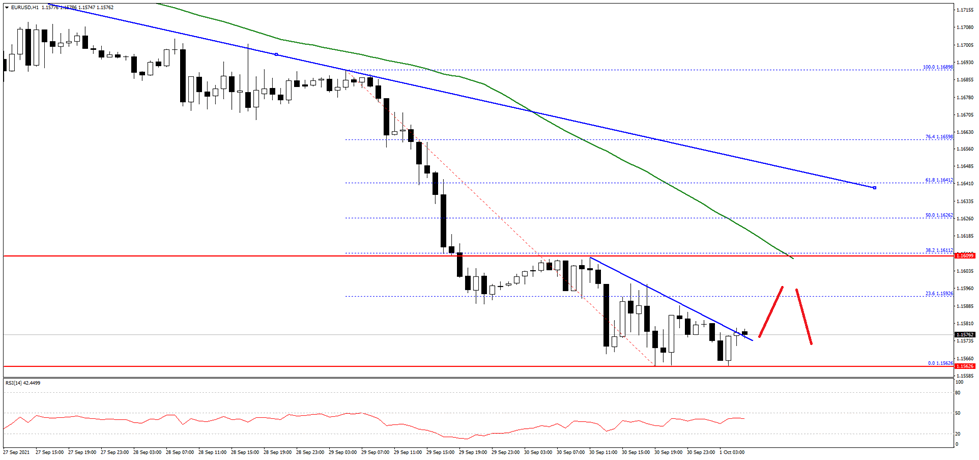
An immediate resistance is near the 1.1600 level. The main resistance is near 1.1610 and the 50 hourly simple moving average. A clear break above the 1.1600 and 1.1610 resistance levels could lead the pair towards the 1.1650 zone.
On the downside, an initial support is near the 1.1565 level. The key support is near 1.1550 on FXOpen, below which there is a risk of a larger decline. The next major support is near the 1.1500 level.
Eurozone PMI manufacturing finalized at 58.6, growing toll from supply chain headwinds
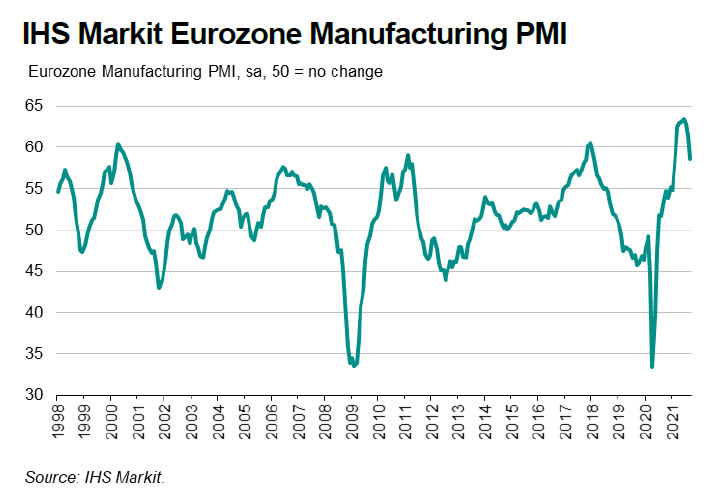
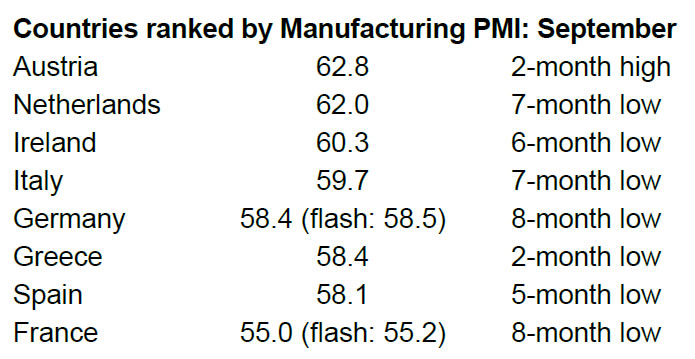
Eurozone PMI Manufacturing was finalized at 58.6 in September, down from August's 61.4. That was the largest drop in the headline index since April 2020 as supply-side constraints impacted goods producers. Acute inflationary pressures persisted as supplier deliver time continued to lengthen considerably.
Chris Williamson, Chief Business Economist at IHS Markit said: "While Eurozone manufacturing expanded at a robust pace in September, growth has weakened markedly as producers report a growing toll from supply chain headwinds... The supply situation should start to improve now that COVID-19 cases are falling and vaccination rates are improving in many countries, notably in several key Asian economies from which many components are sourced, but it will inevitably be a slow process which could see the theme of supply issues and rising prices run well into 2022."
Germany PMI manufacturing finalized at 58.4, false impression distorted by delivery times
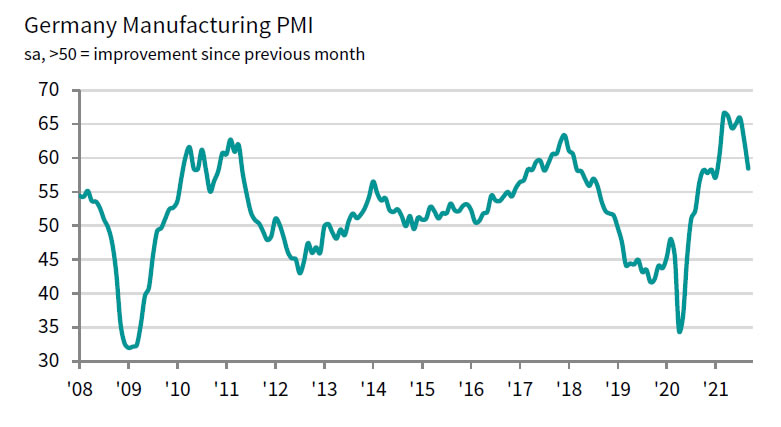
Germany PMI Manufacturing was finalized at 58.4 in September, down from August's 62.6. Markit said output and new orders rose at slowest rate in 15 months. Input shortages continued to push up costs, leading to higher output prices. Pace of job creation slowed as growth expectations dipped to 13-month low.
Phil Smith, Associate Economics Director at IHS Markit, said:
"At 58.4, the latest headline PMI reading gives a false impression as to the manufacturing sector's current performance, with the suppliers' delivery times component continuing to distort the picture. Trends in output and new orders are weaker than the headline number suggests.
"The unprecedented supply shortages we've seen in recent months have been holding back production levels for some time now, and we're increasingly seeing this disruption feed back up the supply chain and resulting in reduced demand for intermediate goods as orders are either postponed or cancelled. As a result, overall growth in new orders dropped to a 15-month low in September.
"At the same time, supply bottlenecks continue to drive up input costs and, in turn, put pressure on manufacturers to raise prices, which is acting as another headwind to growth. The rate of input price inflation looks like it might have peaked but is still running close to the fastest in the survey's history, leading to near-record numbers of goods producers raising prices.
"Manufacturers' optimism towards the outlook is steadily ebbing away, down in September to its lowest for 13 months, with many firms concerned that supply shortages will persist into next year."
France PMI manufacturing finalized at 55, intense supply-side imbalances even affecting the demand-side
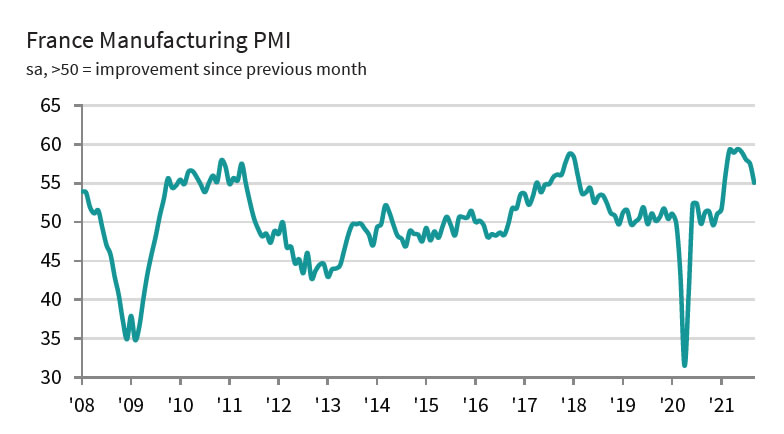
France PMI Manufacturing was finalized at 55.0 in September, down from August's 57.5, lowest since January. Markit said that input lead times deteriorated at unprecedented rate prior to COVID-19. Output growth lost further momentum amid supply-side challenges. New order growth softened further.
Joe Hayes, Senior Economist at IHS Markit, said: "September survey data show us that the intense supply-side imbalances are now starting to seriously impede the French manufacturing sector and are even affecting the demand-side of the economy too.
"Lead times are rising at extreme rates, and port closures in Asia seen recently have added fuel to the fire.... Surveyed firms mentioned that clients are becoming hesitant and orders are being postponed or not placed at all , so we're now seeing a negative demand-side impact.