Sample Category Title
A Mixed Session For Currencies
Dollar mixed versus majors
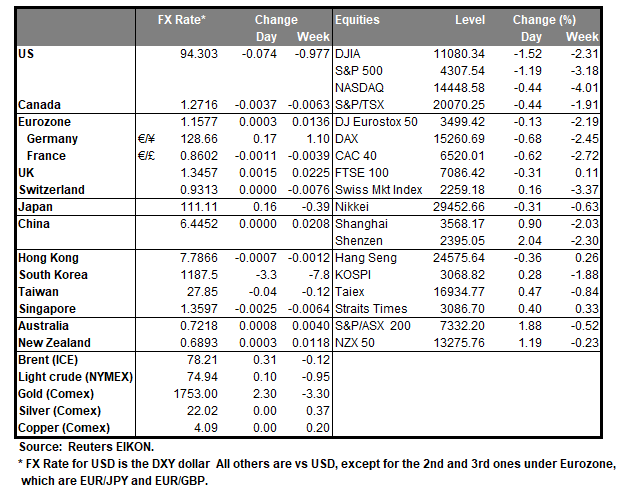
A slight easing of US yields overnight, and some profit-taking, pushed the dollar index slightly lower, falling 0.13% to 94.24, before recovering to 93.40 in Asia. As long as risk-aversion sentiment and the repricing of the Fed taper remain foremost though, the index remains on course to test 94.75 by next week.
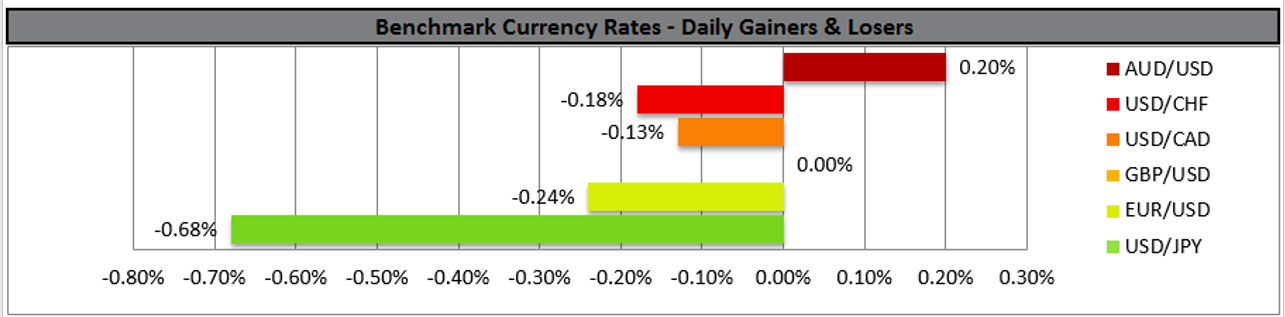
The headline moves disguised quite a lot of jostling amongst the major currencies. USD/JPY has fallen 0.62% to 111.20, tracing out a double top at 112.05. A slight fall in US yields helped the yen but most of the fall in USD/JPY can probably be attributed to exporter selling and haven buying of yen by nervous Japanese investors. Only a fall through 110.50 delays the USD/JPY rally.
EUR/USD continued to edge further under the 1.1600 pivot level and is trading at 1.1575 today. Unless it recaptures 1.1650 in the next few sessions, technicals will continue pointing to a much larger move lower to 1.1200. Some EUR/GBP selling and GBP short-covering lifted GBP/USD to 0.35% to 1.3475 overnight, although GBP/USD has retreated in Asia to 1.3455. With the recovery rally running out of steam so quickly, the signs still point to deeper losses to the 1.3200 region. Only a rise through 1.3600 changes the bearish outlook. USD/CHF has fallen 0.30% to 0.9310 and it would appear haven-buying is helping to cap USD/CHF’s advance. It remains in a well-defined uptrend though, targeting 0.9480.
The sharp drop by AUD/USD and NZD/USD this week probably flushed out exporter buyers overnight as they rose by 0.70% and 0.50% respectively to 0.7230 and 0.6900. A slight weakening of the US dollar assisting. Both have edged slightly lower today and will continue to be buffeted by swings in risk sentiment. AUD/USD would have to rise above 0.7350, and NZD/USD above 0.7000 to change what is a very bearish outlook in the currency environment. NZD/USD may get help from the RBNZ next week if it finally hikes rates to 0.50%. However, that is likely to be reflected in AUD/NZD weakness with bigger forces driving the US dollar at the moment.
Asian currencies will not have stable PBOC USD/CNY fixes to lean on for support of the next week with China on holiday. Asia FX continues to trade to the weaker side versus the US dollar as markets reprice the reality of the Fed taper and higher energy prices weigh on the region. A soft Non-Farm Payrolls next Friday is likely needed to reduce the pressure on Asian currencies, as that would mollify Fed tapering concerns temporarily. Asian currencies are falling again today and it is notable that two of the worst performers are the Thai baht and Indonesian rupiah, which are amongst the most vulnerable to a Fed taper. USD/THB and USD/IDR have risen by 0.40% today to 74.254 and 14,315.00. Interestingly, USD/PHP continues to find resistance ahead of 51.00 while THB and IDR retreat, suggesting that the BSP remains on the offer for now.
Asian Equities Slump
Asia seeing red after Wall Street slides
Wall Street endured a torrid end to the quarter, posting another punchy down day although the forces of rotation were evident between growth and value in the main indexes. The S&P 500 fell by 1.16%, with the Nasdaq retreating by just 0.44%, while the Dow Jones slumped by 1.62%. We have seen rotation flows within the big three at work all of last week, which suggests to me that the market is quite indecisive about which way to point at the moment. Notably, no short-covering has occurred in Asia today, and futures on all three have fallen again by around 0.45%.
Hong Kong and mainland China are closed for holidays, but the negative forces from energy concerns, Covid, US debt ceilings, US congressional standoffs, global growth concerns, stagflation, etc., take your pick, are as evident in Asian markets as they were in US markets overnight. The Nikkei 225 has slumped by 2.0% with the Kospi tumbling by 1.40% and Taipei slumping 1.65%.
In regional markets, Singapore is 1.25% lower, while Kuala Lumpur has fallen by 0.50% and Jakarta by 0.70% after the Finance Minister signalled income tax rises on the high earners and raised sales tax. Bangkok is 0.20% lower while Manila has bucked the trend, rising by 0.35%.
An announcement by the Australian Prime Minister that Australia’s borders would reopen in November to vaccinated Australians, has had zero impact on markets down under. The ASX 200 and All Ordinaries have tumbled by 2.10% and 2.0% respectively, with Singapore iron ore futures falling by 3.70% and copper falling by 0.80%.
The dark mood sweeping markets is unlikely to reverse course by this afternoon, meaning that European equities are likely to open lower. Weak PMIs this afternoon could further dampen that mood before we see whether the buy-the-dip mafia on Wall Street chose to remain on the sidelines.
At All Costs
Bloomberg is running a very interesting top story this morning stating that China’s Vice Premier Han Zheng has ordered the country’s top state-owned energy firms to secure energy supplies, meaning anything that comes out the ground and can be combusted, “at all costs.” It is probably a strong signal about how concerned China is regarding keeping the industry going, and more importantly, the winter that is just around the corner. I’m fairly sure it still isn’t enough for “that” phone call to be made from Beijing to Canberra. And if Chinese steel and aluminium smelters are going to be shutting down for extended periods, you can be sure that will reverberate through global supply chains. Don’t expect global PPI data to show “peak stagflation” anytime soon.
None of that is going to be good news for Europe either, who will now be in a gloves-off bidding war with Asia for spot energy supplies. Russia, whom Europe have foolishly tied their energy security to, have hinted that Gazprom might be able to pump more gas if only Nord Stream 2 approval could be hurried up a little. Subtle. Vladimir Putin and Scott Morrison make strange bedfellows. But as they cast their glances towards Europe and China, I am sure they are rubbing their hands with glee and going to bed with smiles on their faces.
Asia spot natural gas prices are now trading at near the equivalent of USD 180.00 a barrel of Brent crude, meaning that oil’s appeal as a gas substitute for power generation is almost irresistible. Damn the torpedoes on emissions targets as well, get me coal. OPEC+ may not offer much solace either. No details have emerged from the JTTC meeting ahead of the OPEC+ Ministers meeting on Monday. Reuters is reporting that OPEC+ is only considering a one-month hike of 800,000 bpd in November, with no increase in December to offset that. So basically, a one-month NPV of the planned rises. The last time I saw compliance data from OPEC+, it was at 116%. That suggests that OPEC+ is struggling to pump enough to meet its present targets, let alone ramping up production. It then needs to be pumped, loaded on tankers, and transported. After a torrid 18 months for OPEC+ producers, (does anyone remember the negative price WTI futures debacle?) the opportunity to refill government coffers may be irresistible. Whichever way you cut it; shorting oil is only for the brave with very deep pockets. I am expecting Riyadh’s hotlines to start ringing a lot more.
US equities slump over logjams in Congress
Over in the United States, a deal funding the US Government until December 3rd was passed. Kicking the can down the road didn’t save Wall Street, where equities slumped into the quarter’s end. An infrastructure bill vote happens in the House this morning Asian time. But the USD 3.5 trillion build-back better package looks to be in trouble, both from within the Democrats themselves where the “progressive wing” looks intent on progressively marching to defeat in next year’s mid-terms, and without from the Republicans. Both bills and a new debt ceiling face a Republican brick wall in the Senate. If it all looks like a mess, it is, and markets are reacting appropriately as nerves fray.
One group I hope to hold their nerve, are those central banks moving towards tapering quantitative easing, most especially the Federal Reserve. Introducing some two-way volatility into equity markets and cutting out the cancer of never-ending asset price appreciation is long overdue. About eight years overdue in fact. The cost of capital in corporate finance parlance is not zero, and the worlds’ central banks need to stop stealing the wealth creation of our children and grandchildren to keep the lights on today. If that means a taper-tantrum or two and other creative destruction, then so be it. Sadly, I know too well where the Fed, BOE and ECB’s – insert central bank here – happy place is if things start looking really wobbly, and so does the market. Don’t get too bearish on equities, property and yes, cryptos just yet.
Hong Kong is on holiday today, as is mainland China, which won’t return to the office until next Friday. That will mute liquidity in Asia and possibly explains why oil prices are not reacting to the Bloomberg story, although industrial metals are easing this morning. Asia released its first of the month dump of Jibun Bank and Markit PMIs along with Japan’s Q3 Tankan Surveys. Starting with Japan’s Tankan, the Large-Manufacturer Index beat at 18, but the Large Non-Manufacturing survey was an underwhelming 2. Ostensibly good news for manufacturing, looking under the hood, it shows that input and output prices are rising rapidly. And non-manufacturing is clearly taking a Covid-19 hit. This Tankan may be a high-water mark as those underlying pressures hollow out Q4’s outlook. Net market impact is minimal with Japan’s markets more focused on events overseas and what fiscal goodies the new Prime Minister will wheel out.
The Markit Manufacturing PMIs across Asia Pacific were a mixed bag. Australia showed remarkable resilience given the scale of its lockdowns, rising to 56.80. Taiwan and Japan eased, but remained expansionary, while South Korea rose. ASEAN was a mixed bag, with the region showing some signs of recovery, especially Indonesia where Covid-19 cases have slumped. Nevertheless, Indonesia aside, ASEAN remained in contractionary territory below 50.0 and the Asia North/South divide remains as stark as ever.
We get more PMIs from across Europe today, but the street is going to be more focused on the circus on the Hill in Washington DC, and US Personal Income and Expenditure, as well as ISM Manufacturing PMIs. Sentiment is fragile after last night’s weekly Initial Jobless Claims rose unexpectedly, raising the spectre more of recovery slowdown fears. My understanding is the number was distorted by California moving jobless claimants of the expired federal package and onto a state one. Nevertheless, it is clear that markets are in a dark mood and the US data needs to put in a good show tonight to avoid an ugly end to a torrid week for equities. A jump in personal expenditure and income may not assist anyway, as it will put tapering nerves back on edge.
A quick look into next week makes me think it will be just as frisky as this one despite China being on holiday. Apart from all the ebbs and flows of everything else I have outlined above, none of which is going away next week, it is also a US Non-Farm Payroll week. Additionally, we have three central bank policy decisions in the Asia-Pacific. India and Australia will remain on hold with their rate outlook of most interest. We also have New Zealand where the RBNZ postponed a planned rate hike due to the Covid-19 outbreak. Auckland still remains fenced in but it will be interesting to see if the RBNZ thinks the country’s containment measures have achieved enough success for it to follow Norway and hike
Eurozone CPI jumped to 3.4% yoy in Sep, core CPI rose to 1.9% yoy
Eurozone CPI accelerated to 3.4% yoy in September, up from 3.0% yoy, above expectation of 3.3% yoy. Core CPI rose to 1.9% yoy, up from 1.6% yoy, above expectation of 1.8% yoy.
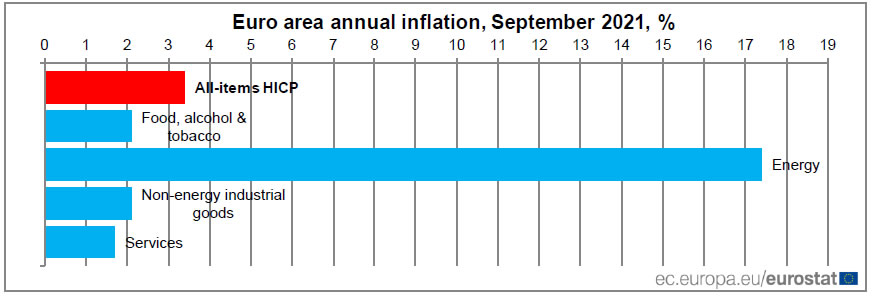
Looking at the main components of euro area inflation, energy is expected to have the highest annual rate in September (17.4%, compared with 15.4% in August), followed by non-energy industrial goods (2.1%, compared with 2.6% in August), food, alcohol & tobacco (2.1%, compared with 2.0% in August) and services (1.7%, compared with 1.1% in August).
Precious Metals Gain As USD Stabilizes Higher
The USD ended the day slightly lower on Thursday indicating some stabilization had prevailed. We must note the Dollar Index had risen to a new yearly high level during the European morning of Thursday but corrected lower later on. During the US session on Thursday, the Senate passed legislation extending government spending until Dec. 3. US President Joe Biden signed the legislation just hours before the current funding expires, avoiding a partial government shutdown. Yet at the same time, a tough debate between the Democrat party members over the infrastructure bill, seems to persist keeping the markets in a wait and see position. US economic data released on Thursday, pointed to mixed results possibly mirroring the currency’s uncertain movement throughout the day. The weekly Initial jobless claims figure came in higher than the previous reading as an increase was noted in California. On a more positive note, the US Final GDP rate for Q2 rose to 6.7% higher than both prior and expected rates. On Friday USD traders have a number of financial releases to work with, all together forming a rather interesting trading session. In our opinion, the market’s focus will be turning towards the ISM Manufacturing PMI for September. The manufacturing sector has been impacted by higher fuel prices and supply chain disruptions thus this reading would make things clearer for the sector at this stage. Precious metals gained very notably on Thursday as a result of the USD stabilization. Palladium, Silver, Platinum and Gold made gains unanimously on Thursday, gaining some of the ground lost during the previous days. Gold managed to turn positive for the week yet remains in a bearish momentum in our opinion.
Gold jumped notably higher and clearly tested the (R1) 1760 resistance which it even surpassed briefly. In our opinion if the bulls are be looking to capture higher grounds the (R2) 1780 resistance is the most probable target for now. At the top the (R3) 1795 level is the highest level for this chart and could be reached in an extensive buying interest scenario. In case of a possible movement downwards, the price action can be forced to the (S1) 1740 support while even lower the (S2) 1722.50 level which was tested various times in the past days has formed a rather solid support. At the end the (S3) 1700 support remains the lowest level for this analysis.
The energy market continues to rise while fears surge
Energy commodities rose on Thursday making the case for a close in positive territory for the current week. Even though Friday’s session is just starting at the moment, Natural Gas prices seem to have gained over 11% since Monday’s opening. WTI and Brent Oil made gains on the day but at a much smaller level.
The situation in the UK with fuel demand and supply falling out of balance seems to concern Britain’s regulators. According to the Financial Times, the Office of Gas and Electricity Markets (Ofgem) stated that it will turn to the police if it finds out energy companies are intentionally trying to worsen a supplier’s financial position. This warning was sent to energy suppliers that are possibly in a risky financial position at the moment with energy prices at yearly high levels. If these firms are to go bust then costs could be spread across all consumer energy bills putting further economic pressure on consumers. Fears over worsening circumstances and possibly higher prices on energy commodities may persist as media sources noted China is urging its state owned energy firms to secure fuels no matter the cost. Analysts consider the potential of the matter worsening as Europe, the UK and China are facing energy crisis simultaneously while prices are considerably high and supply chains remain weak currently.
Nat Gas surged higher and checked the (R1) 6.050 resistance level but failed to break above it. Yet if the bulls are to persist then the next stop higher in our opinion could be the (R2) 6.325 level which is also the multiyear high level reached just in the past days. Even higher the price action could move towards the (R3) 6.600 resistance which has not been tested before. Yet as the RSI indicator remains below 70 for the time being, we could leave space for some bearish tendencies to appear. In this case the (S1) 5.560 support level can be tested first, while even lower the (S2) 5.350 can also be in the markets focus as it was briefly reached yesterday. In a more decisive move lower the bears could aim for the (S3) 5.100 support level also.
Other economic highlights today and the following Asian session:
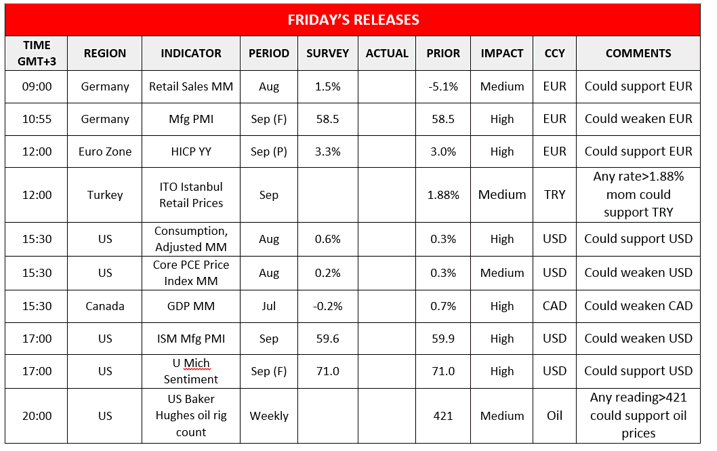
Today during the European session, we get Germany’s retail sales for August and the Final manufacturing PMI for September. Later we get the Eurozone HICP and the Turkish ITO Istanbul Retail Prices for September. In the US session we get the US Consumption Adjusted figure and Core PCE Price Index both for August, the ISM manufacturing PMI for September and the University of Michigan Economic sentiment for September. We also get the Canadian GDP rates for July while late in the US session we get the weekly Baker Hughes oil rig count.
XAU/USD H4 Chart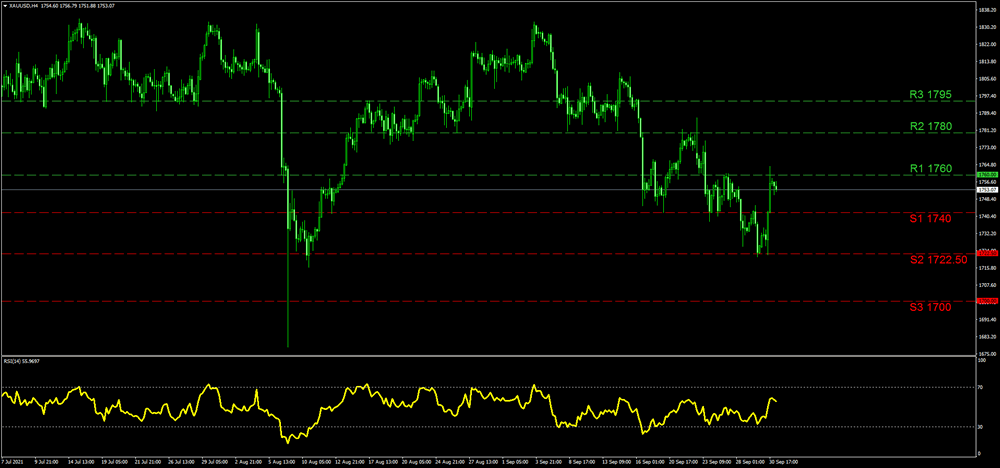
Support: 1740 (S1), 1722.50 (S2), 1700 (S3)
Resistance: 1760 (R1), 1780 (R2), 1795 (R3)
NAT.GASCash H4 Chart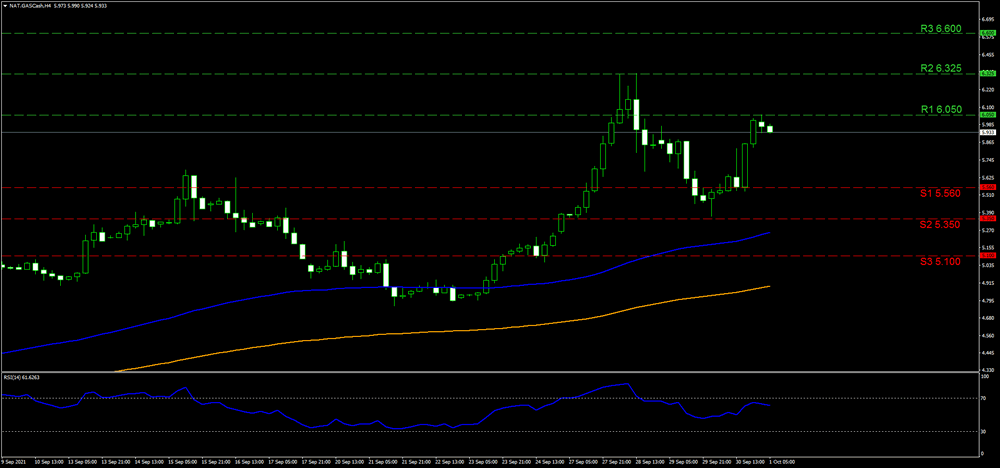
Support: 5.560 (S1), 5.350 (S2), 5.100 (S3)
Resistance: 6.050 (R1), 6.325 (R2), 6.600 (R3)
The Analytical Overview Of The Main Currency Pairs
The EUR/USD currency pair
Technical indicators of the currency pair:
Prev Open: 1.1597
Prev Close: 1.1576
% chg. over the last day: -0.18%
According to Bloomberg Economics, inflation data for September in the Eurozone is likely to be negative. Inflation is expected to be clearly above the European Central Bank's 2% target in all major economies in the region. German inflation accelerated to 4.1% in September from 3.9% in August, the highest rate since 1993. Unemployment in the Eurozone fell to 7.5% in August.
Trading recommendations
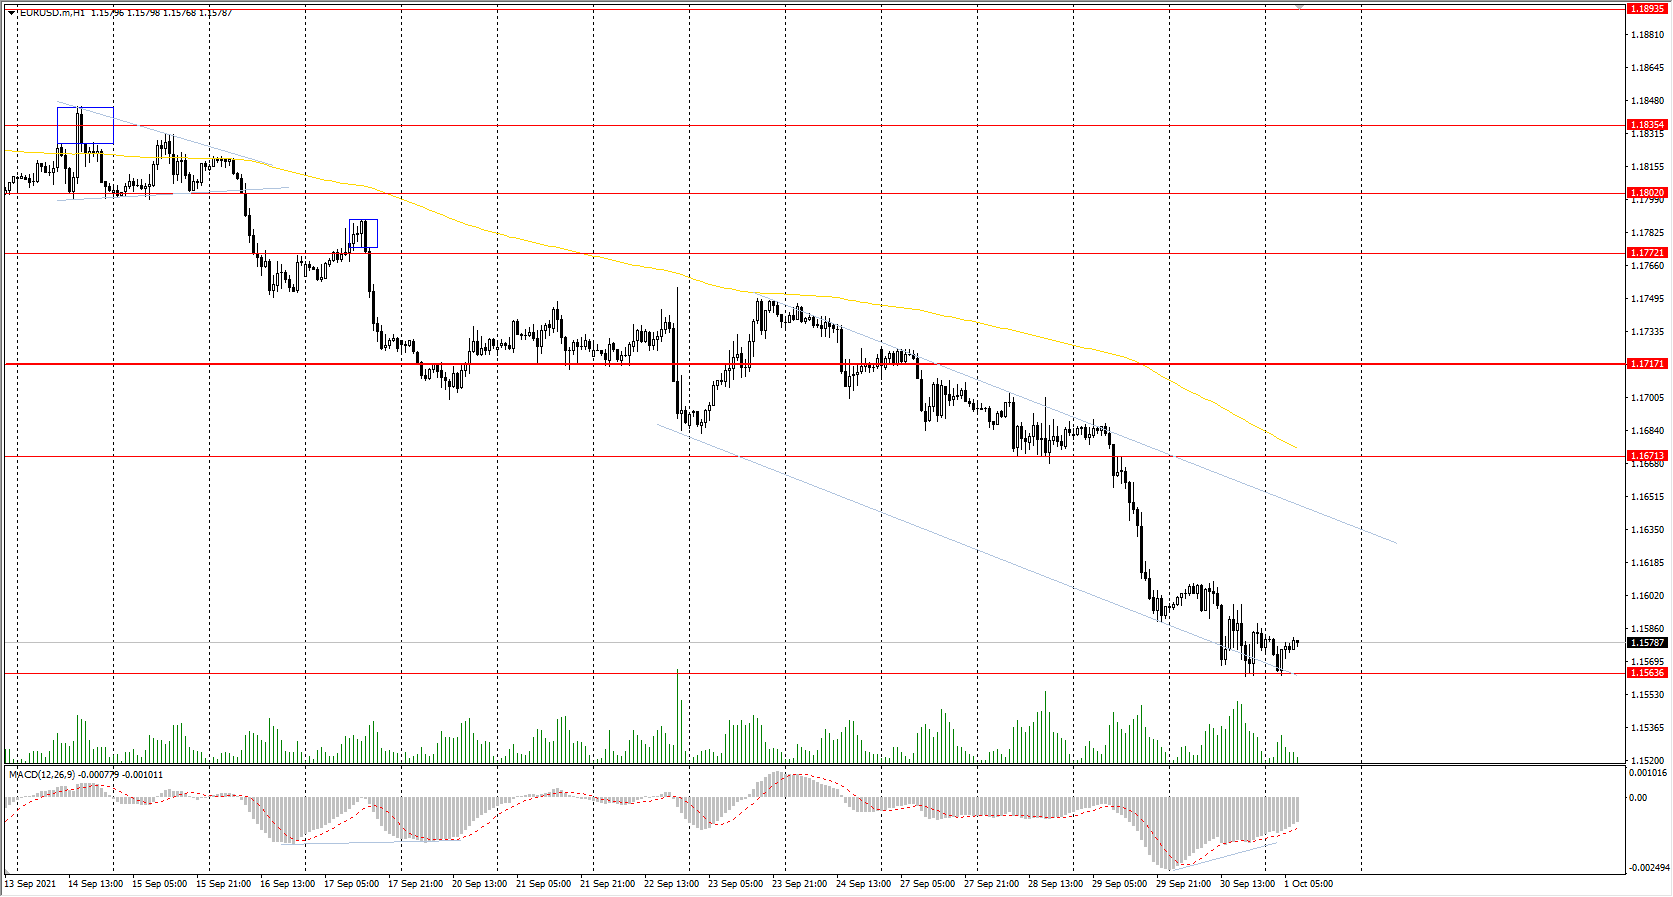
Support levels: 1.1564, 1.1453
Resistance levels: 1.1671, 1.1717, 1.1772, 1.1802, 1.1835
From the technical point of view, the EUR/USD trend has changed to bearish. On the background of the weakness of the European currency, the quotes went down sharply. The price has consolidated below the priority change level. But the MACD indicator shows a divergence. Under such market conditions, traders should consider sell deals from the resistance levels near the moving average, as the price has deviated from the middle line. Buy trades should be considered only from the support levels with additional confirmation in the form of a buyers' initiative.
Alternative scenario: if the price breaks out through the 1.1717 resistance level and fixes above, the mid-term uptrend will likely resume.
News feed for 2021.10.01:
- German Manufacturing PMI (m/m) at 10:55 (GMT+3);
- Eurozone Manufacturing PMI (m/m) at 11:00 (GMT+3);
- Eurozone Consumer Price index (m/m) at 12:00 (GMT+3);
- US PCE price index (m/m) at 15:30 (GMT+3);
- US ISM Manufacturing PMI (m/m) at 17:00 (GMT+3);
- US Michigan Consumer Sentiment (m/m) at 17:00 (GMT+3).
The GBP/USD currency pair
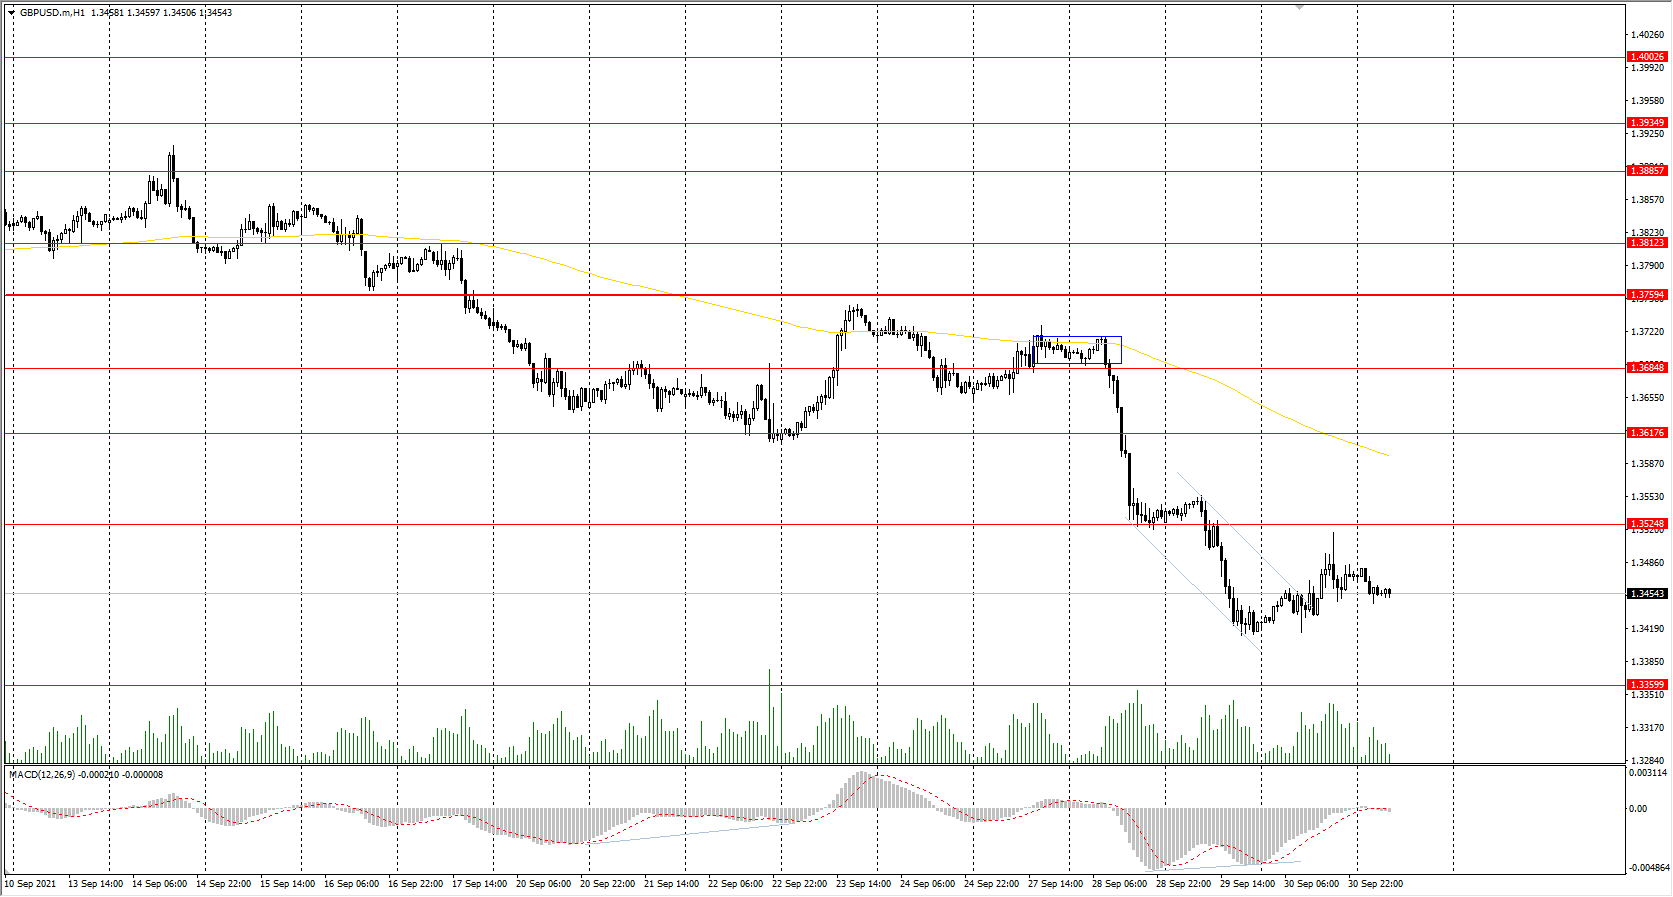
Technical indicators of the currency pair:
Prev Open: 1.3425
Prev Close: 1.3470
% chg. over the last day: +0.33%
In the UK, 15 power companies, providing services to about 2 million people, have gone bankrupt since the beginning of the year because of high gas prices. But the situation with fuel shortages at gas stations is improving. The British GDP increased to 5.5% (previous 4.8%) in annual terms.
Trading recommendations
Support levels: 1.3360, 1.3282
Resistance levels: 1.3525, 1.3617, 1.3685, 1.3759, 1.3812, 1.3886
On the hourly time frame, the GBP/USD trend is bearish. The MACD indicator has become negative. Buy trades should be considered only throughout the day and only with short targets from the support levels after the buyer’s initiative. Sell trades can be found at the resistance levels near the moving average line, as the price has deviated from the average values.
Alternative scenario: if the price breaks out through the 1.3759 resistance level and consolidates above, the bullish scenario will likely resume.
News feed for 2021.10.01:
- UK Manufacturing PMI (m/m) at 11:30 (GMT+3).
The USD/JPY currency pair
Technical indicators of the currency pair:
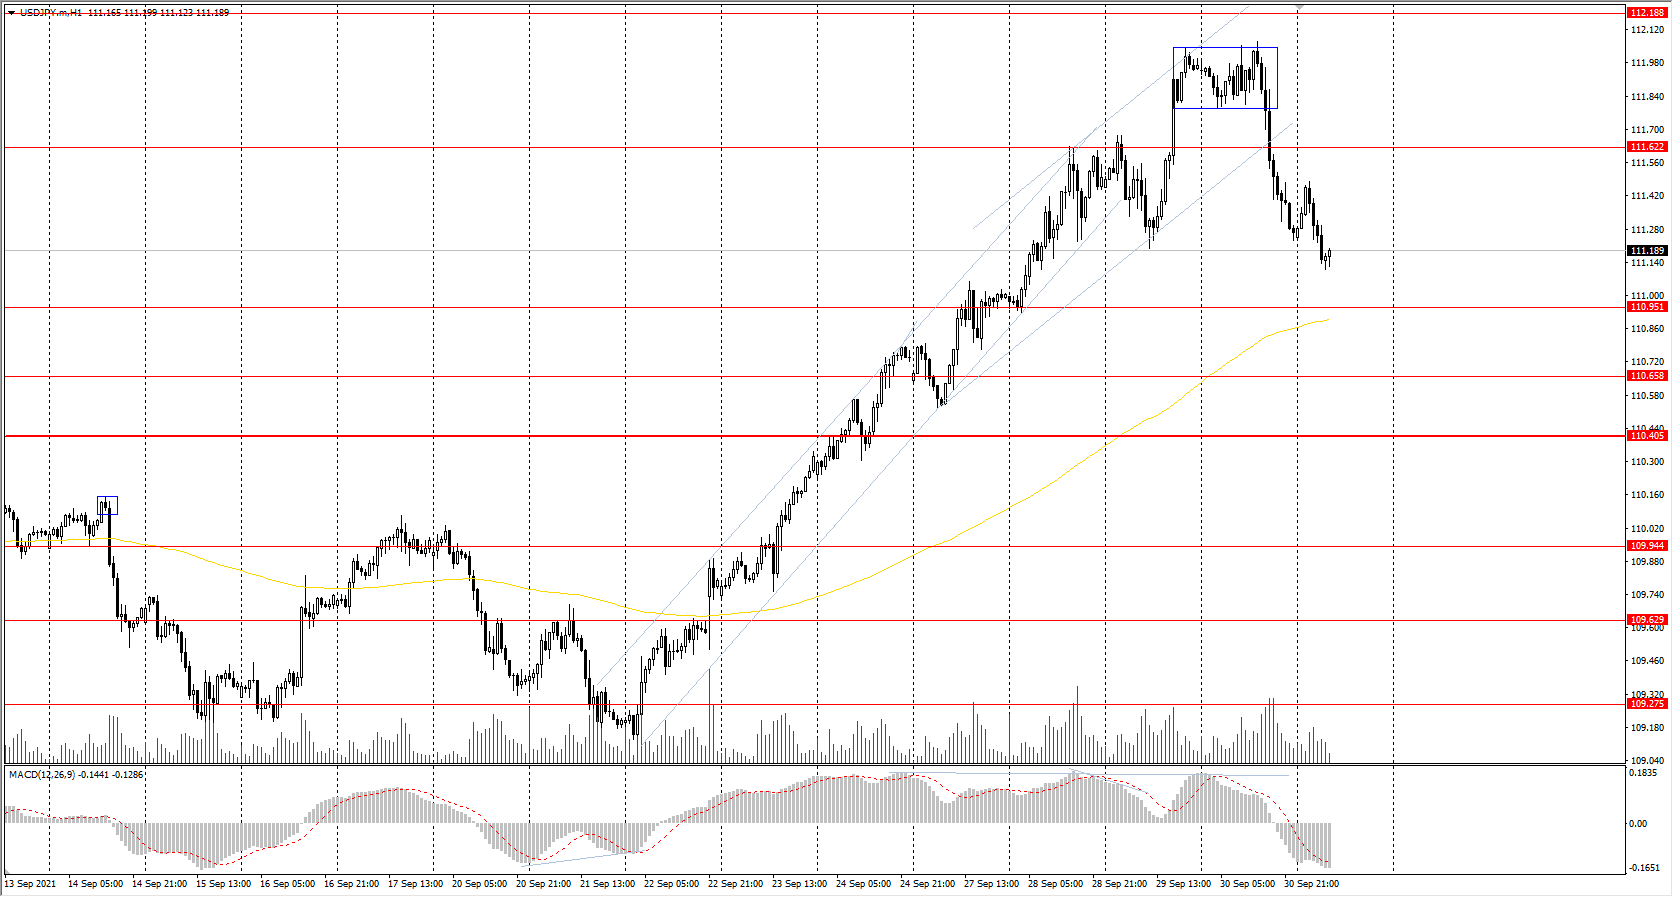
Prev Open: 111.95
Prev Close: 111.25
% chg. over the last day: -0.63%
Last month, Japan's unemployment rate remained at 2.8% (forecast 2.9%), but the business activity index unexpectedly increased. With the removal of restrictions, this indicator is going to improve. Japan's new Prime Minister, Kishida, intends to dissolve the parliament on October 14.
Trading recommendations
Support levels: 110.95, 110.65, 110.40, 109.95, 109.63, 109.27
Resistance levels: 111.62, 112.19
The main trend of the USD/JPY currency pair is bullish. The MACD indicator became negative, and the correction started. Under such market conditions, it’s better to look for buy positions from the support levels near the moving average. Sell positions should be considered only throughout the day from the resistance levels, given there is sellers' initiative.
Alternative scenario: if the price falls below 110.45, the uptrend is likely to be broken.
News feed for 2021.10.01:
- Japan Unemployment Rate (m/m) at 02:30 (GMT+3);
- Japan Tankan Manufacturing Index (m/m) at 02:50 (GMT+3).
The USD/CAD currency pair
Technical indicators of the currency pair:
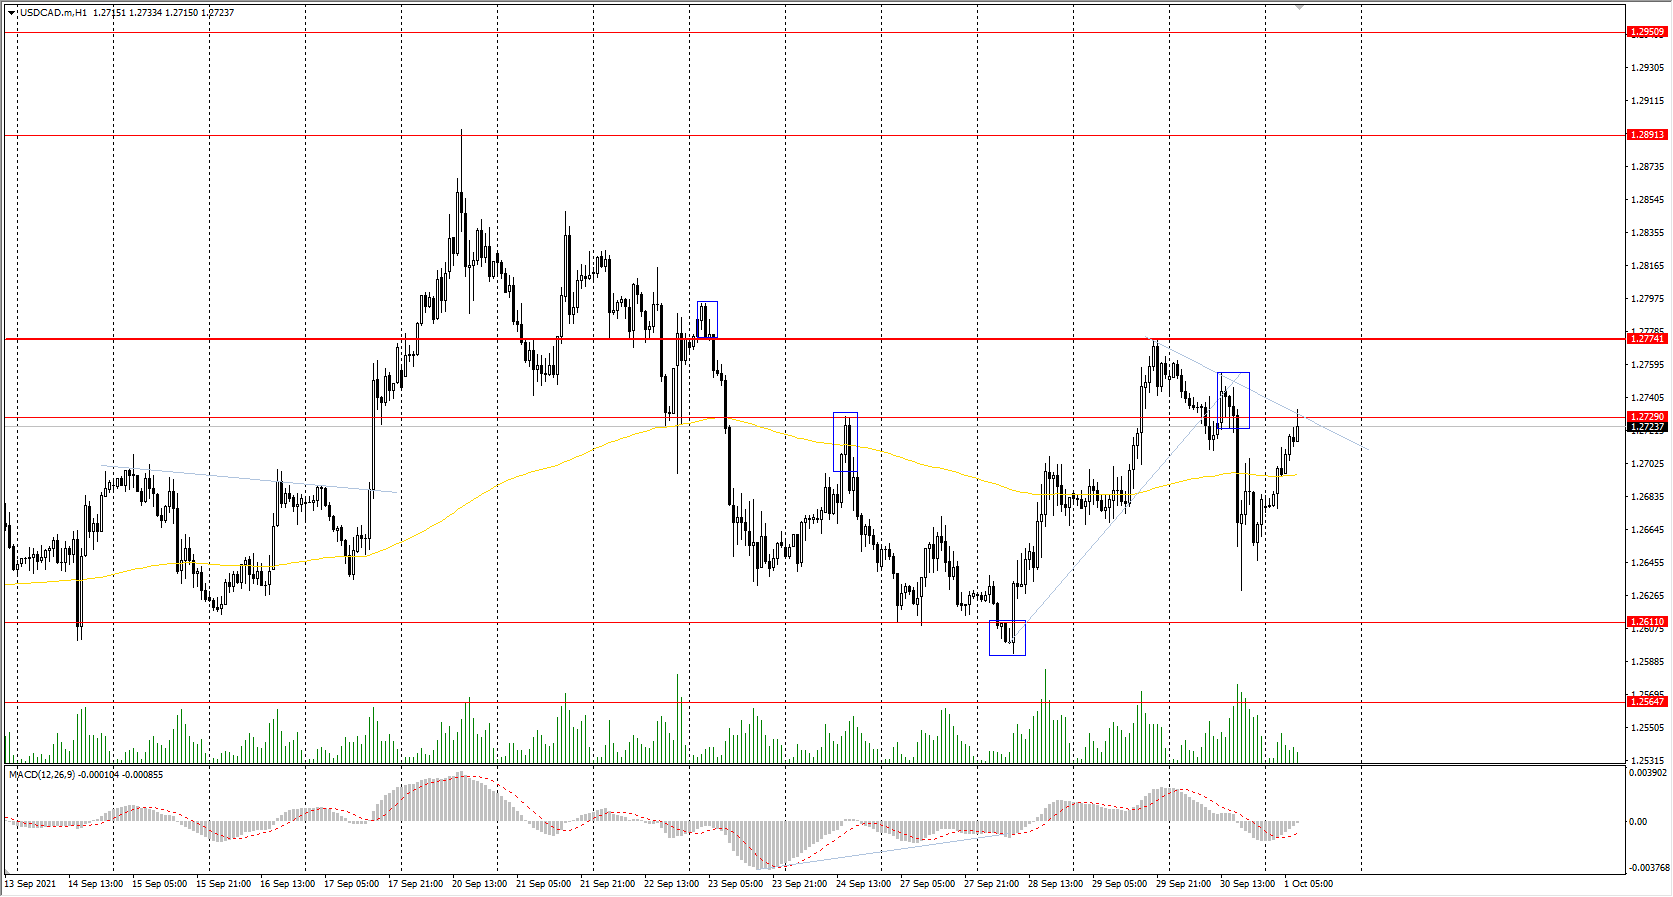
Prev Open: 1.2751
Prev Close: 1.2682
% chg. over the last day: -0.54 %
The Canadian dollar is a commodity currency, so USD/CAD is highly dependent on the dynamics of the dollar index and oil prices. The dollar index remained at the same level yesterday while oil prices increased. As a result, the USD/CAD quotes decreased due to the strengthening of the Canadian currency.
Trading recommendations
Support levels: 1.2611, 1.2565, 1.2518, 1.2425
Resistance levels: 1.2729, 1.2774, 1.2891
From the technical point of view, the trend of the USD/CAD currency pair is bearish. But the price is trading in a wide corridor now. The MACD indicator has become inactive. Under such market conditions, it is better to look for buy deals from the support levels, but only with short targets. It is best to look for sell deals from the resistance levels after the sellers' initiative, such as an impulse movement.
Alternative scenario: if the price breaks out through the 1.2774 resistance level and fixes above, the uptrend will likely resume.
News feed for 2021.10.01:
- Canada GDP (m/m) at 15:30 (GMT+3).
The Deficit On Energy Resources Increaes Ahead Of The Winter Season
US stock indices ended yesterday's trading in the negative area. Over the month, the S&P 500 decreased by 4.8%, the Dow Jones lost 4.3%, and the Nasdaq lost 5.3%. The S&P 500 and Nasdaq indices have had their worst month-to-month performance since March 2020. Why is the stock market going down? While investors expect the Federal Reserve to cut its stimulus, the concerns about slowing economic growth, rising inflation, supply chain problems, the global energy crisis, and regulatory risks emanating from China are also increasing. The end of the month in the stock market was the time of increased volatility, hedging, and economic concerns. As a result, investors and hedge funds are rebalancing their investment portfolios. It should also be noted that the stock market saw record money outflows last week. However, many investment banks and hedge funds are still urging investors to buy all drawdowns.
Some Congress members have raised the Fed’s issue of ending the QE program as a condition for a budget deal.
Boeing received a $23.8 billion contract from the US Department of Defense.
European stock indices also closed lower yesterday. The British FTSE 100 decreased by 0.31%, German DAX lost 0.68%, French CAC 40 decreased by 0.62%, Italian FTSE MIB and Spanish IBEX 35 lost 0.21% and 0.94% respectively.
According to Bloomberg Economics, Eurozone inflation data for September is likely to be pessimistic. Inflation is expected to be clearly above the European Central Bank's 2% target in all major economies in the region. German inflation accelerated to 4.1% in September from 3.9% in August, the highest rate since 1993. In September, inflation in France and Italy also accelerated as households in the Eurozone's two largest economies faced a jump in energy prices. Unemployment in the Eurozone fell to 7.5% in August. European natural gas and electricity prices jumped to record highs, signaling that supply shortages will only worsen before the winter.
Oil is rising as potential demand growth caused by the global energy crisis counteracts the impact of the crisis on the overall economy. According to preliminary data, OPEC+ is considering throwing more oil on the market at next week's meeting because of a strong deficit.
Gold is on the way to its biggest monthly loss since June, as the prospect of stimulus cuts pressures the precious metals. Yesterday, gold and silver increased sharply amid a temporary drop in US government bond yields.
Manufacturing activity in Asia rebounded in September after some countries eased restrictions associated with the Covid-19 virus. In Asia, all resources for the electricity generation, including gas, coal, and water) are in short supply, and the situation doesn’t seem to improve anytime soon. Asian stock indices are falling due to increasing inflation concerns. Australian stocks decreased more than 2%, South Korea's Kospi is down 1.5%, and the MSCI Asia Pacific Index decreased by 1.1%. Japan's Nikkei 225 index lost more than 2%.
Japan's next prime minister, Fumio Kishida, may have no choice but to sell most government bonds worth hundreds of billions of dollars to finance the pandemic package.
Main market quotes:
- S&P 500 (F) 4,307.54 −51.92 (−1.19%)
- Dow Jones 33,843.92 −546.80 (−1.59%)
- DAX 15,260.69 −104.58 (−0.68%)
- FTSE 100 7,086.42 −21.74 (−0.31%)
- USD Index 94.25 -0.08 (-0.09%)
Important events for today:
- Japan Unemployment Rate (m/m) at 02:30 (GMT+3);
- Japan Tankan Manufacturing Index (m/m) at 02:50 (GMT+3);
- German Manufacturing PMI (m/m) at 10:55 (GMT+3);
- Eurozone Manufacturing PMI (m/m) at 11:00 (GMT+3);
- UK Manufacturing PMI (m/m) at 11:30 (GMT+3);
- Eurozone Consumer Price index (m/m) at 12:00 (GMT+3);
- US PCE price index (m/m) at 15:30 (GMT+3);
- Canada GDP (m/m) at 15:30 (GMT+3);
- US ISM Manufacturing PMI (m/m) at 17:00 (GMT+3);
- US Michigan Consumer Sentiment (m/m) at 17:00 (GMT+3).
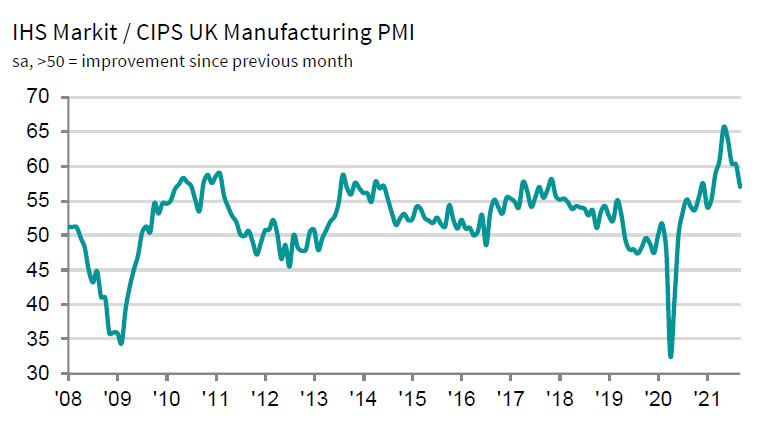
UK PMI manufacturing finalized at 57.1, descending towards a bout of stagflation
UK PMI Manufacturing was finalized at 57.1 in September, down from August's 60.3. Markit said output and new orders rose at slowest rates since February. New export business fell for the first time in eight months.
Rob Dobson, Director at IHS Markit, said: "The September PMI highlights the risk of the UK descending towards a bout of 'stagflation', as growth of manufacturing output and new orders eased sharply while input costs and selling prices continued to surge higher.... With little sign of resolution to these issues, manufacturers, especially smaller firms with lower market power or capacity flexibility, will continue to be buffeted by these headwinds for the foreseeable future, hinting at a tough autumn and winter ahead for many firms."
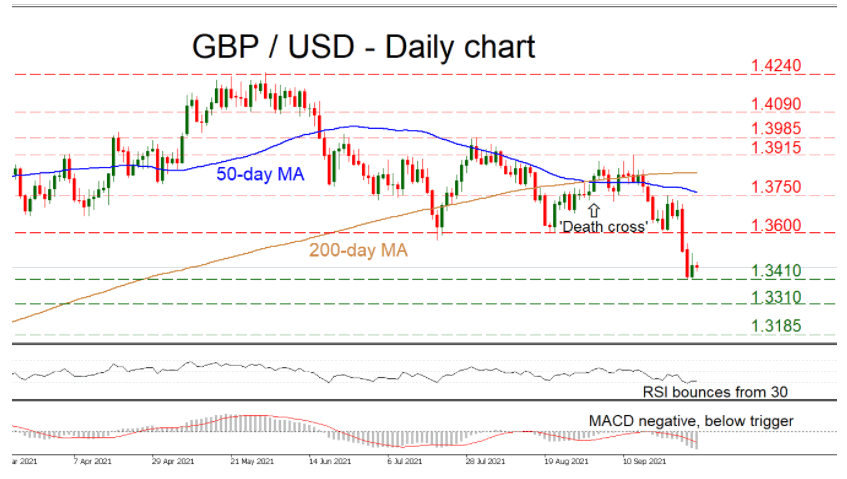
GBPUSD Falls Without A Parachute
GBPUSD sliced through some crucial support levels this week, erasing all its gains for the year. The pair rebounded off the 1.3410 support region, but there’s a series of lower highs and lower lows forming since early June. Indeed, the 50-day moving average (MA) has also crossed below the 200-day one, forming a ‘death cross’. All this points to a downtrend.
The short-term oscillators are mixed, with the RSI reflecting the latest rebound in the price action but the MACD staying firmly negative and below its red trigger line.
If sellers remain in control and manage to pierce below the 1.3410 barrier, their next target could be the 1.3310 zone, marked by the lows in late December. If that’s violated too, the focus would then turn towards the 1.3185 area.
Now in case buyers retake the reins, the first test to the upside would be the 1.3600 hurdle, which acted as support in recent months and may now provide resistance. A potential break above it could open the door for the 1.3750 neighborhood, which also encompasses the 50-day MA.
In short, the latest breaks have turned the picture bearish. A move below 1.3410 would reinforce the negative outlook.
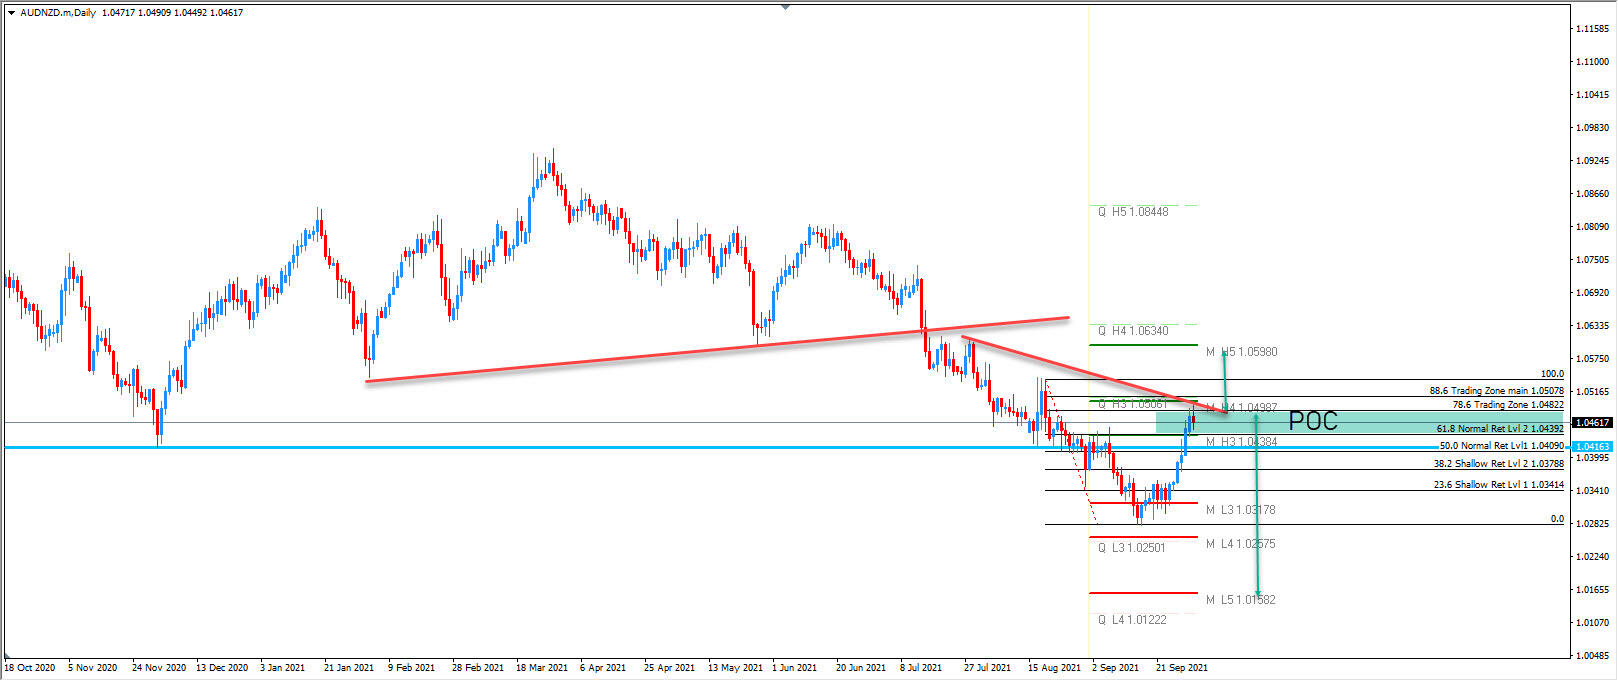
AUD/NZD Still In Downtrend But The Price Is Retracing
AUD/NZD is in downtrend and the price has retraced to the POC zone. We might see a mover soon.
1.0440-82 is the POC zone where the price could bounce up or down. If 1.0498 breaks to the upside we should see 1.05980. A move below 1.0440 should be targeting 1.0438 and 1.03178 at least. Below those levels we should see a new low of 1.0158.