Sample Category Title
Gold Shifts Northwards But Lacks Bullish Signals
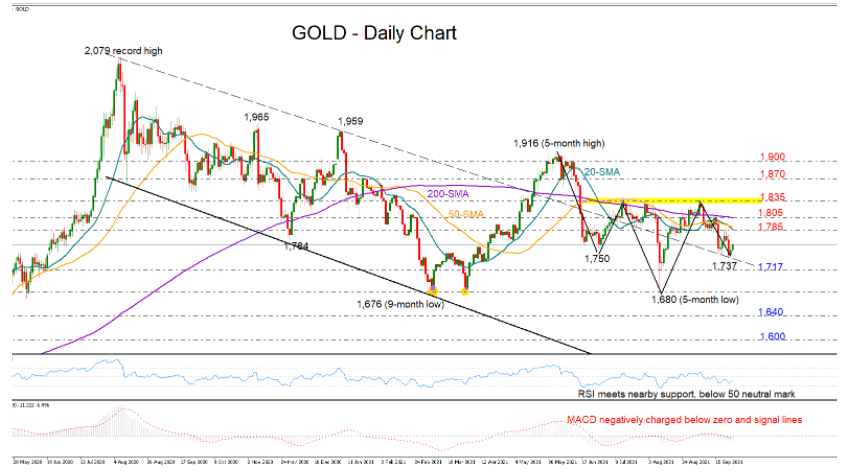
Gold kicked off Monday’s session with a soft positive momentum following last week’s consolidation around 1,740 and along the dashed restrictive line, which has been occasionally acting as support to downside corrections over the past two months.
Technically, there is no clear sign that the bulls will take the upper hand in the short term as the RSI is maintaining September’s downtrend below its 50 neutral mark despite the confluence with a former support region, while the MACD remains negatively charged below its zero and signal lines. Meanwhile, the simple moving average (SMA) lines have yet to choose direction, also providing little information about whether the horizontal trading in the short-term window could change soon.
The 1,835 ceiling remains the threshold for short-term traders to confidently resume buying interest, but prior to that, the price will need to overcome the nearby 1,785 – 1,800 resistance territory, where the SMAs happen to be at the moment. If the wall at 1,835 finally collapses, the price could advance to meet the 1,870 barrier, a break of which is required for a rally up to the key 1,900 – 1,916 zone. Any significant move above from here would question the long-term downtrend from the record high of 2,079.
Alternatively, a close below the 1,717 – 1,737 zone could see an extension towards the 1,680 base. Driving lower, the precious metal could chart a new lower low somewhere between 1,640 and 1,600, worsening the long-term bearish outlook.
In brief, gold is trying to recoup some lost ground, but downside risks are still elevated according to technical indicators. Unless the 1,835 bar gives way, an outlook deterioration in the short-term picture cannot be excluded.
EUR/GBP Daily Outlook
Daily Pivots: (S1) 0.8556; (P) 0.8567; (R1) 0.8583; More...
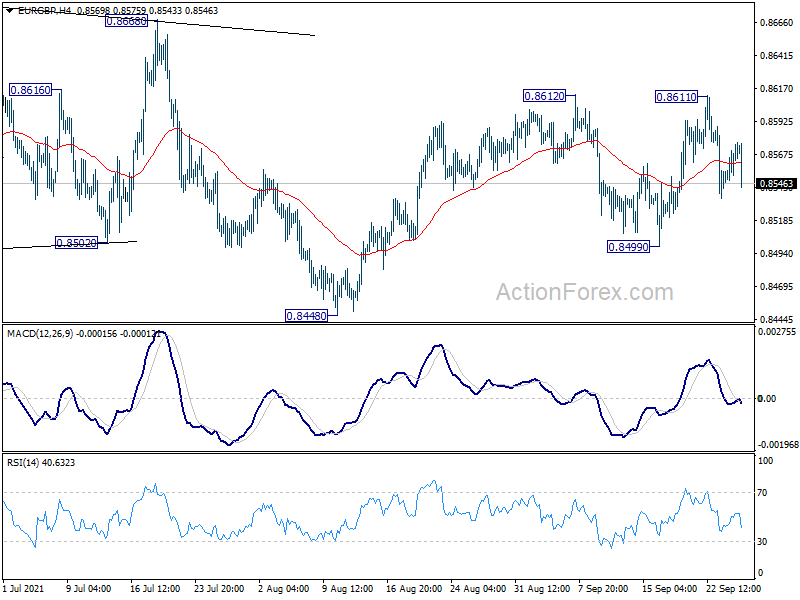
Intraday bias in EUR/GBP remains neutral for the moment. On the upside, break of 0.8612 will resume the whole rise from 0.8448 for 0.8668 key structural resistance. Sustained break there will be a strong sign of larger bullish reversal. On the downside, however, break of 0.8499 support will bring another fall towards 0.8448 low instead.
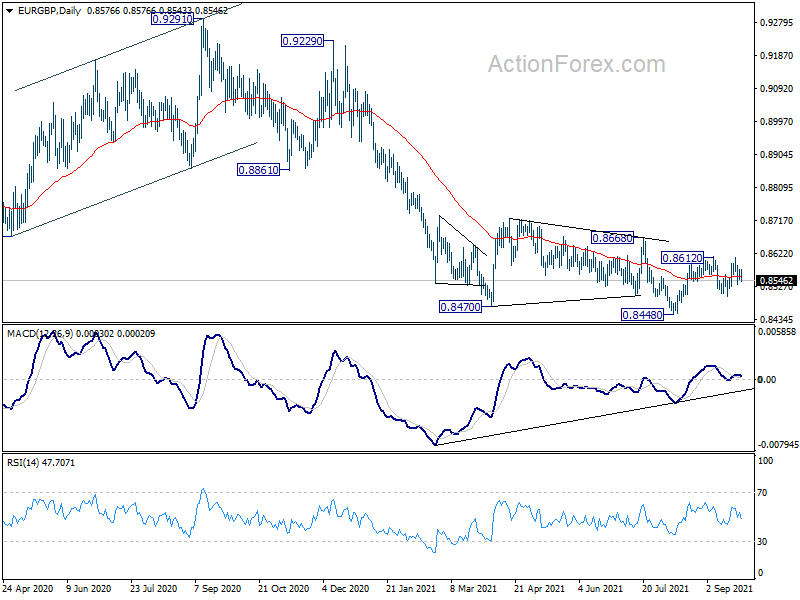
In the bigger picture, price actions from 0.9499 (2020 high) are still seen as developing into a corrective pattern. Deeper fall could be seen as long as 0.8668 resistance holds, towards long term support at 0.8276. However, firm break of 0.8668 resistance would argue that a medium term bottom was already formed. Stronger rise would be seen to 0.8861 support turned resistance to confirm completion of the corrective pattern.
EUR/AUD Daily Outlook
Daily Pivots: (S1) 1.6072; (P) 1.6124; (R1) 1.6194; More...
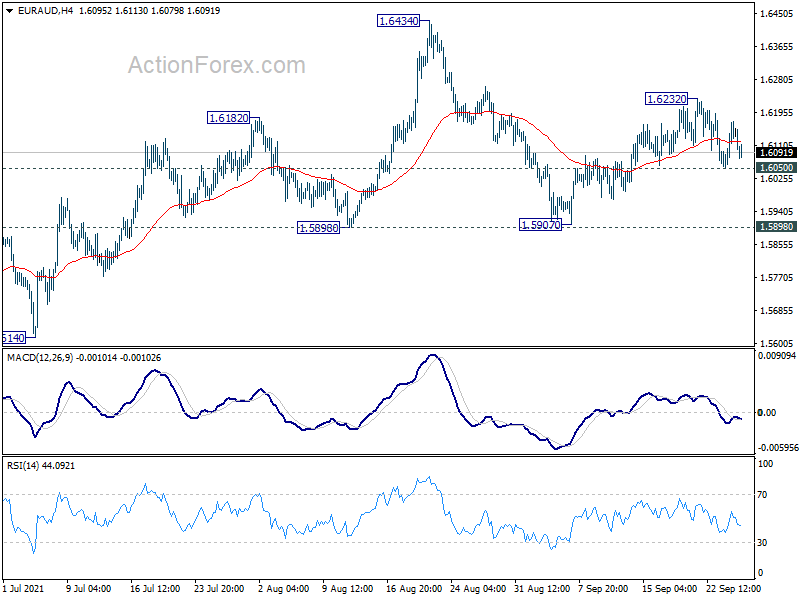
Intraday bias in EUR/AUD remains neutral for the moment. On the upside, break of 1.6232 will resume the rebound from 1.5907 to retest 1.6434 high. On the downside, below 1.6050 support will suggest that rebound from 1.5907 has completed. Intraday bias will be turned back to the downside for 1.5907. Overall, with 1.5898 support intact, larger rise from 1.5250 is still in progress, and break of 1.6434 will confirm resumption.
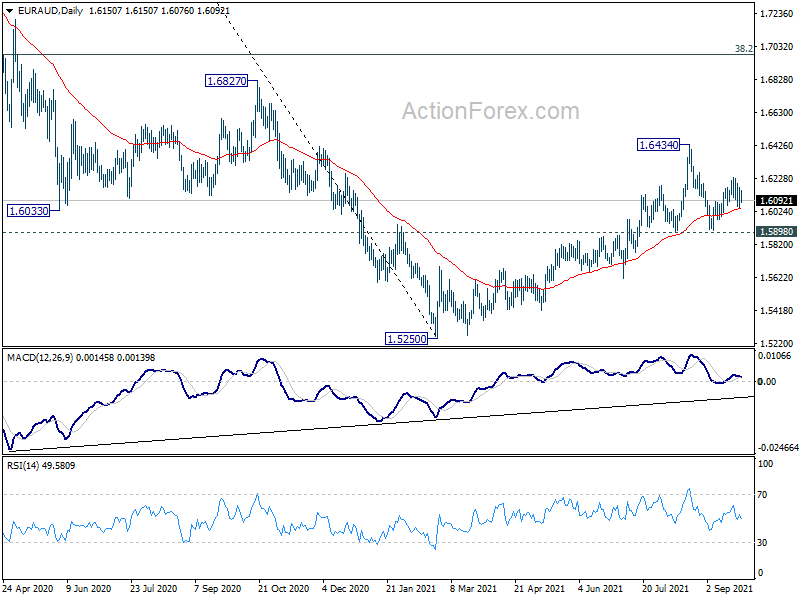
In the bigger picture, rise from 1.5250 medium term bottom is currently seen as a correction to the down trend from 1.9799 first. Stronger rise could be seen to 38.2% retracement of 1.9799 to 1.5250 at 1.6988 next. We'd tentatively expect strong resistance from there to limit upside, at least on first attempt. Meanwhile, break of 1.5898 support will indicate that the rebound has completed. Larger down trend from 1.9799 might be ready to resume through 1.5250 low.
EUR/CHF Daily Outlook
Daily Pivots: (S1) 1.0816; (P) 1.0841; (R1) 1.0860; More....
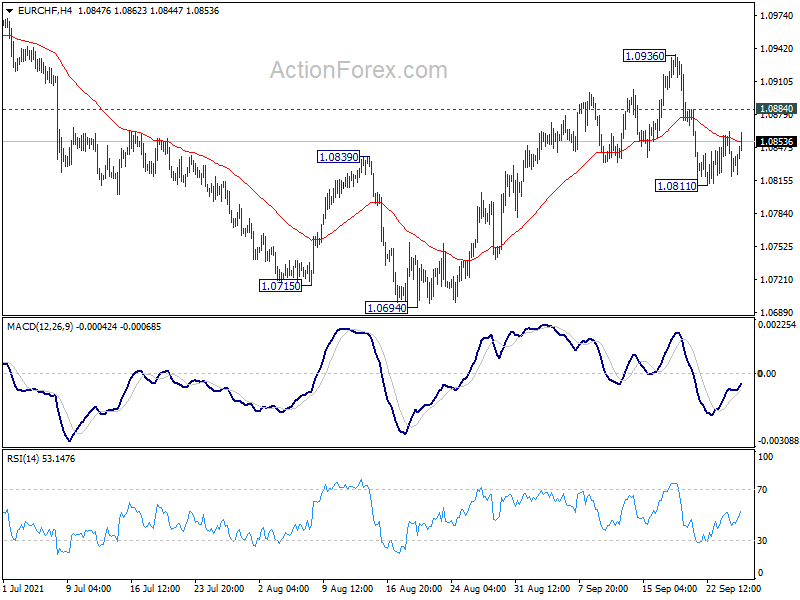
Intraday bias in EUR/CHF remains neutral at this point,. As noted before, rebound from 1.0694 has possibly completed at 1.0936 already. Break of 1.0811 will turn bias to the downside and resume the fall for retesting 1.0694 low. On the upside, however, above 1.0884 minor resistance will turn bias back to the upside for 1.0936 resistance again.
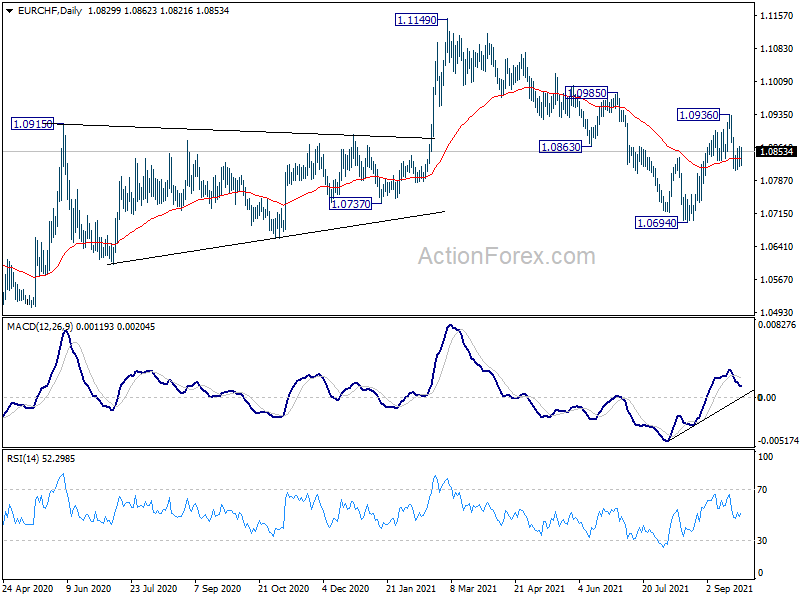
In the bigger picture, the stronger than expected rebound from 1.0694 and break of 55 week EMA (now at 1.0861) mixes up the medium term outlook. On the upside, break of 1.1149 will resume the whole rise from 1.0505 (2020 low). On the downside, break of 1.0694 will revive some medium term bearishness for 1.0505 and below.
Brent Crude Has Cleared Its Way For $100
The Gas Armageddon doesn't look likely to leave Europe anytime soon, with its effects trickling more and more clearly into related markets. Brent crude updated three-year highs on the spot market on Monday morning, and futures markets already took those highs on Friday. Investors expect energy costs to remain elevated in the coming months or even quarters, and the chances are high for continued gains.
The value of Brent has surpassed $78. The last time this grade traded higher was for less than a month from late September 2018 after a drone attack on Saudi Arabian refining capacity. Excluding this man-made force majeure, prices are now at their highest levels since 2014, when oversupply halved the price in less than six months.
Volatility remains a major hallmark of oil prices, so forecasts of a rise to $100-110 by the end of winter do not look unduly bullish. By comparison, gas prices in Europe remain near historic highs and have gained new momentum in recent days.
The cost of coal, the dirtiest fossil energy source, is at its highest since 2008, as companies are forced to go back to it due to shortages from other sources.
Europe has had very weak winds in the past 6 weeks, drastically reducing the flow from wind turbines. Some also point to a "Russian footprint," causing inadequate gas supplies by Gazprom, which has almost no booked extra capacity to supply gas via Ukraine above contract. Europe probably has missed chances to fully fill its gas storage capacity this winter because of the approaching cold season, although 100% filling is no more than an additional lay of insurance against force majeure.
Part of the energy storm has been triggered by Europe itself, where major companies (such as BP, Shell, Enel) are drastically reducing investments in traditional energy sources and laying off coal in their strategies, followed by oil and, even later, gas.
Praiseworthy long-term plans have triggered short-term secondary effects. In the long-term, energy price hikes will further encourage European policymakers' confidence in the need for broad diversification of energy sources and investment in alternative energy.
However, even a long-term decline in consumption does not mean that oil and gas prices will be low. For the price of oil and gas, the biggest risk is production volumes. A rise in oil prices above $80 and the subsequent move higher will strengthen the proponents' position of more active quota increases and reduce the discipline of the cartel agreements, as already happened in 2018 and 2014.
From a speculative point of view, oil has room to rise as the bulls recharged their guns during the July-August correction. The latest correction has taken about 38% of the rally from the area of lows near $40 in September-October 2020 to highs above $77 in early August 2021. A renewal of the recent highs' points to upside targets of 161% from the above-mentioned rally to levels near $100.
Daily Technical Analysis
EUR/USD
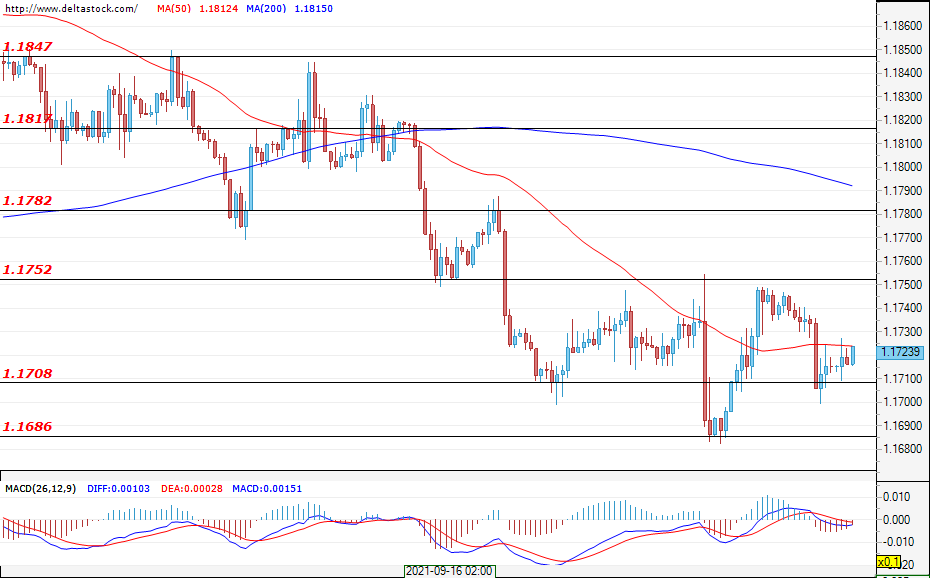
Current level - 1.1723
The initial attempt to breach the support at around 1.1708 was unsuccessful, and the bulls managed to rally the pair towards the resistance zone at around 1.1750. It is possible that the market will continue to trade in a range between 1.1700 and 1.1750 for a while. There is a violation of the downtrend and it is possible that the market will reverse its course around the current levels. A breach of the resistance at around 1.1750 would strengthen the bullish sentiment, and a potential target for the buyers could be the resistance at 1.1817 and even at 1.1900, if the participants from the higher time frames are to re-enter the market. In the event of bearish predominance and a breach of the support zone between 1.1685 and 1.1708, a decline towards 1.1614 can be expected. On the first trading day for the week, the significant events for the currency pair are the results of the elections in Germany, a speech by ECB President Christine Lagarde at 11:45 GMT, as well as the durable goods orders data for the United States expected at 12:30 GMT.
| Resistance | Support | ||
| intraday | intraweek | intraday | intraweek |
| 1.1752 | 1.1817 | 1.1708 | 1.1600 |
| 1.1782 | 1.1847 | 1.1686 | 1.1450 |
USD/JPY
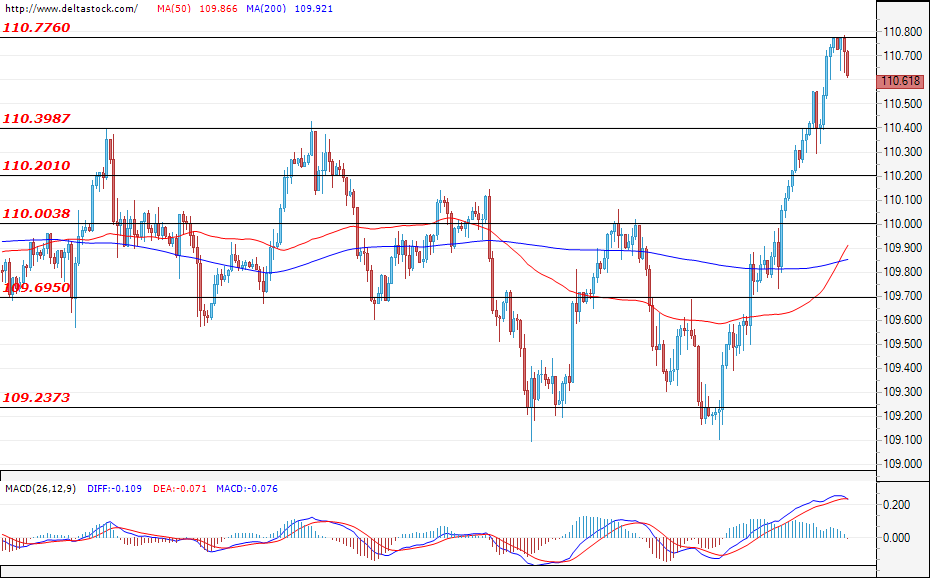
Current level - 110.61
The bulls managed to rally around the support at 109.20 and their push managed to overcome the formed resistances without too much difficulty. The movement paused around the levels of the peak from last month – 110.77. The market is likely to retrace some of its movements and test the support zone at around 110.00. If the buyers manage to maintain their momentum, it is possible that the annual maximum at around 111.50 could be attacked next. At the moment, the possibility for a pullback remains high, but the sentiment remains positive – for a new leg up.
| Resistance | Support | ||
| intraday | intraweek | intraday | intraweek |
| 110.77 | 111.50 | 110.40 | 109.70 |
| 111.00 | 111.50 | 110.20 | 109.23 |
GBP/USD
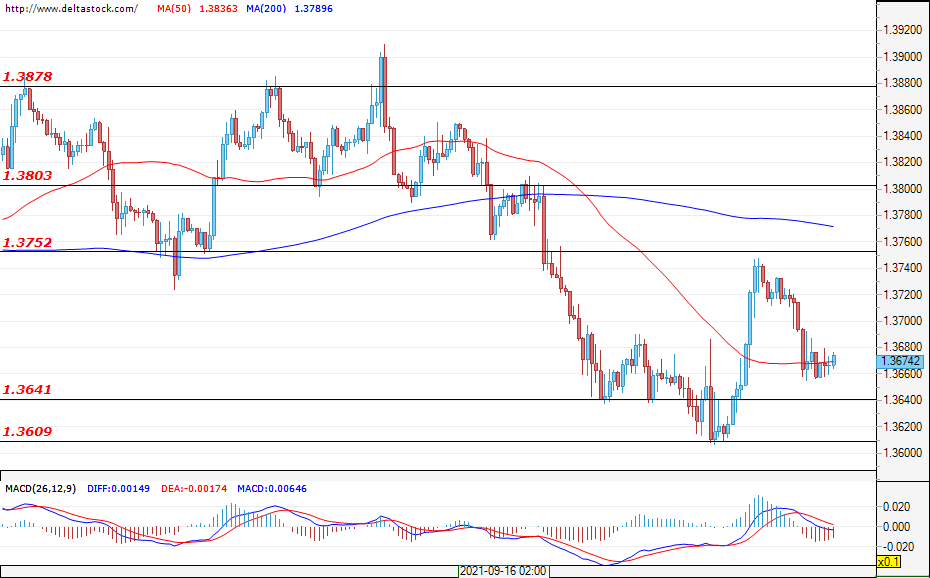
Current level - 1.3674
Despite the failed attempt to breach the 1.3609 support, the downtrend is still intact. The resistance at around 1.3750 was tested successfully, and it seems that the bears will try to breach 1.3609 again. The level comes from the higher time frames and it is possible for the market to enter a range before a possible breakout can be achieved. If the area is breached, a potential target for the bears could be found at around 1.3400.
| Resistance | Support | ||
| intraday | intraweek | intraday | intraweek |
| 1.3750 | 1.3878 | 1.3640 | 1.3500 |
| 1.3804 | 1.3960 | 1.3600 | 1.3450 |
USD/CAD Decline Likely To Continue
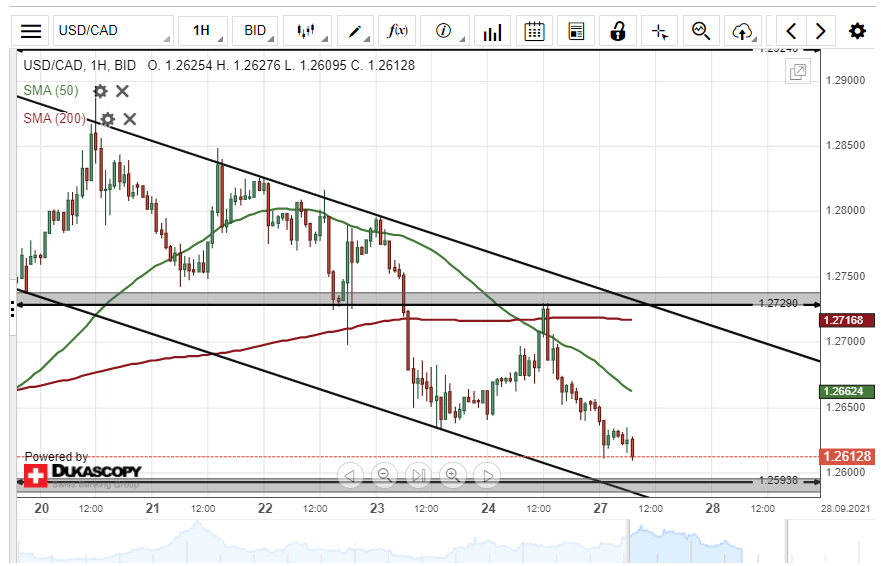
On Friday, the US Dollar declined by 86 pips or 0.68% against the Canadian Dollar. The 200– hour simple moving average pressured the currency pair lower during Friday's trading session.
Technical indicators suggest selling signals on the 4H time-frame chart. Most likely, sellers might continue to pressure the exchange rate lower during the following trading session.
However, the lower boundary of a descending channel pattern at 1.2600 could provide support for the currency exchange rate within this session.
GBP/JPY Could Edge Higher
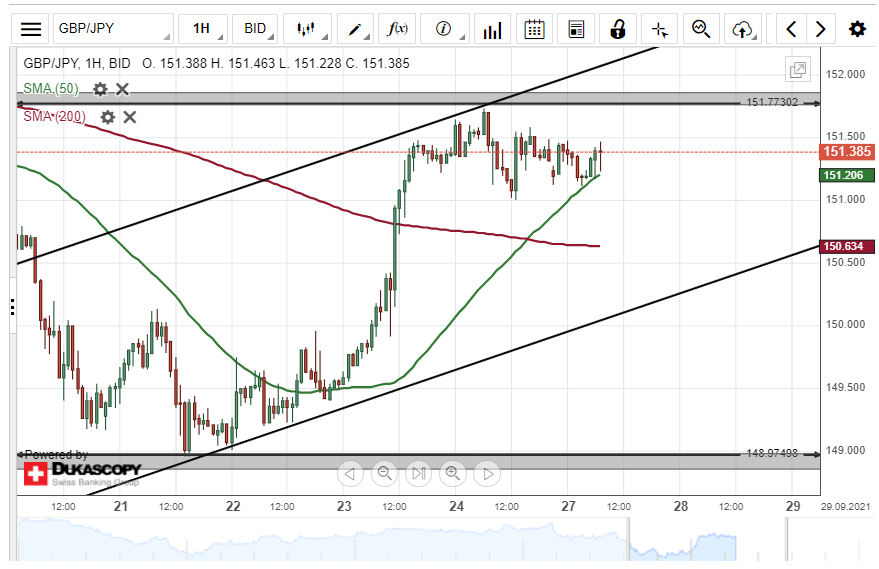
On Friday, the British Pound declined by 61 pips or 0.41% against the Japanese Yen. The currency pair tested the psychological support level at 151.00 during Friday's trading session.
Technical indicators suggest buying signals on the 4H time-frame chart. Most likely, the exchange rate could edge higher within this session. The potential target for buyers would be near the 152.50 level.
However, the GBP/JPY currency exchange rate may encounter resistance at 151.77 during the following trading session.
AUD/USD Two Scenarios Likely
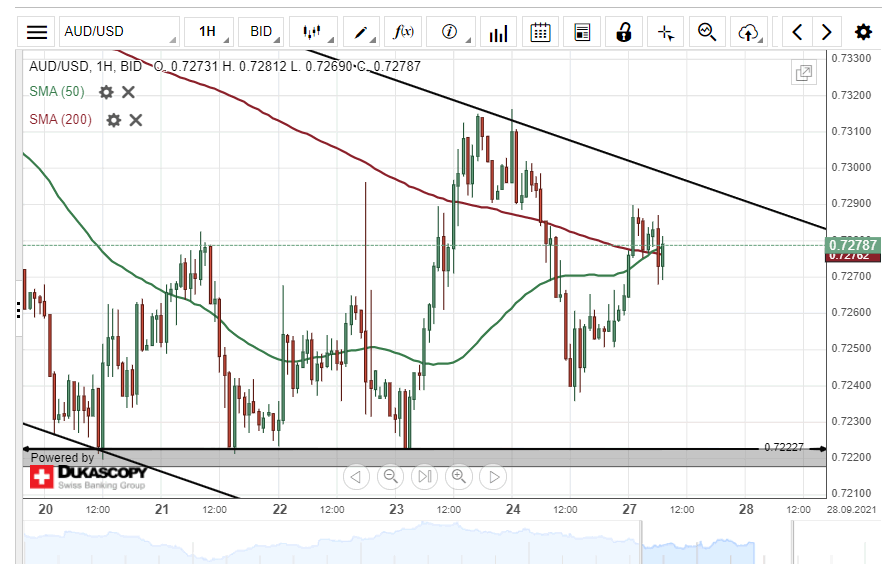
On Friday, the Australian Dollar declined by 71 pips or 0.97% against the US Dollar. The currency pair breached the 50– and 200– hour SMAs during Friday's trading session.
Currently, the exchange rate is trading near the upper boundary of a descending channel pattern and could be set for a breakout.
If the breakout occurs, a surge towards the resistance level at 0.7340 within Monday's trading session.
However, if the channel pattern holds, bearish traders could drive the currency exchange rate lower today.
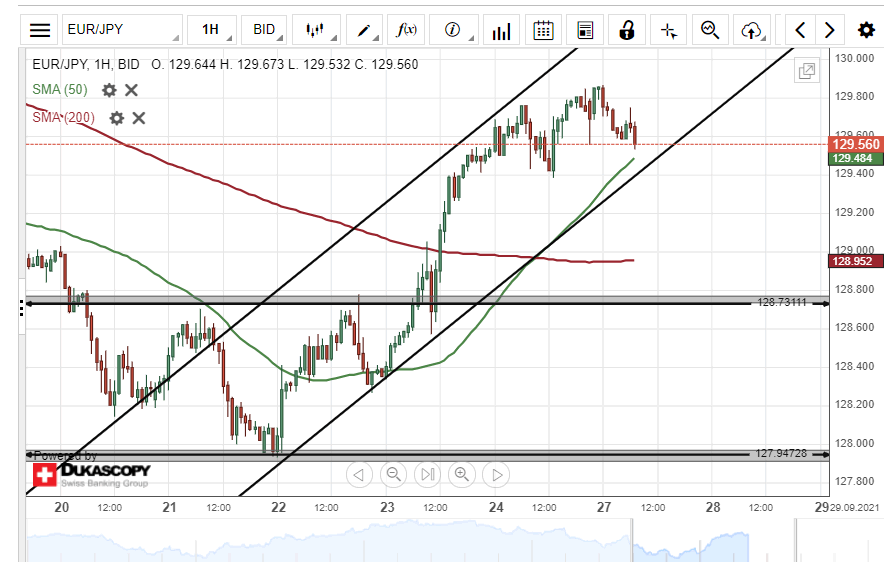
EUR/JPY Could Still Edge Higher
On Friday, the common European currency edged higher by 43 pips or 0.33% against the Japanese Yen. The currency pair tested the 129.80 level during Friday's trading session.
All things being equal, the exchange rate could continue to trend higher in an ascending channel pattern. The potential target for buyers would be near the 130.22 area.
However, the daily resistance level at 129.85 could provide resistance for the EUR/JPY currency exchange rate within this session.