Sample Category Title
Forex and Cryptocurrency Forecast
EUR/USD: Close Start of QE End
The Fed did not make any changes to its monetary policy at its meeting on September 21-22. However, the regulator made it clear in its commentary that it was possibly ready to start a gentle tapering of the monetary stimulus (QE) program as early as November.
More than half of the FOMC (Federal Open Market Committee) members believe that interest rate hikes will begin a few months after the end of QE, that is, even before the end of 2022. In total, in the period 2022-2024 the Fed plans to raise rates at least 6 times. (For comparison, the ECB will only start doing this in three years).
Such prospects were in favor of the dollar, the DXY index rose to 93.498, and the EUR/USD pair renewed its monthly minimum, falling to 1.1683.
There was a slim chance that the start of QE tapering would be announced now. But that hasn't happened, and the Fed will continue to print new dollars for now in a volume of at least $120bn a month. The amount of money on US household balance sheets increased to $16.5 trillion in Q2 and will continue to grow in the near future (it was $12.7 trillion at the end of 2019). But there is bound to come a time when the population starts spending that money supporting the American economy after QE winds down.
Such statistics have given investors confidence in a bright future and revived their risk appetites, pushing the S&P500, Nasdaq and Dow Jones stock indexes up again. By the end of the week, the stock market had virtually compensated for the losses suffered on Monday due to information about the possible bankruptcy of Evergrande, one of China's largest construction companies. Its debt of 2 trillion yuan ($309 billion) is the world largest and is nearly 80 times its net worth (about $3.9 billion). According to Bloomberg, Evergrande includes 200 offshore and 2,000 Chinese companies operating in many countries, so the bankruptcy of such a giant would deal a powerful blow to the global economy.
The recovery of investors' interests in risky assets and the outflow of money to the stock market reversed the trend of the EUR/USD pair to the north on Thursday. The weakening of the dollar accelerated after the publication of weak data from the US labor market.
Initial jobless claims rose to 351,000 in the week, against the forecast of 320,000. The number of repeated applications for state benefits increased to 2.8 million. This is certainly not a disaster, but a wake-up call for the Fed. And if the NFP and other indicators, which will be published on October 8, turn out to be disappointing as well, the regulator may consider delaying QE tapering for a more distant period.
Both of these factors helped EUR/USD bulls raise the pair to 1.1750 on September 23. As for the end of the working week, the pair struck a final chord at around 1.1715 after the speech of FRS Chairman Jerome Powell on Friday evening.
The fact that the US Central Bank can start winding down QE in 1-2 months and complete the process by mid-2022, after which it will proceed with an interest rate hike, allows forecast a stronger dollar in the medium term. Most experts (65%) expect a rise in the US currency and a further decline in the EUR/USD pair in the coming week. They are supported by 85% of oscillators and 100% of trend indicators on D1. The remaining 35% of analysts vote in favor of the pair's growth, and 15% of oscillators also indicate that it is oversold.
Support levels are 1.1705, 1.1685, 1.1600 and 1525. Resistance levels are 1.1750, 1.1800, 1.1845, 1.1908, 1.1975, 1.2025 and 1.2100.
Of the events to come, Germany's federal elections, which will be held on Sunday 26 September and after which Chancellor Angela Merkel will leave office, should be noted. US capital and durable goods orders will be released on Monday September 27. There will be statistics on the consumer markets of Germany and the Eurozone on the last day of the month, as well as data on the US GDP. And finally, the ISM Manufacturing PMI will be released on Friday October 01.
GBP/USD: Bank of England Hawks Win
The past week can be safely called the week of Central banks. Not only the US Federal Reserve, but also the Banks of England, Japan and Switzerland flourished it with their meetings. And while the latter two are not ready to sweep course just yet, the UK regulator has erupted with hawkish rhetoric all of a sudden.
The Bank of England has been extremely passive over the past few years, following in the wake of the ECB and the Fed. And it lasted until the middle of last week. But, apparently, leaving the EU made such behavior impossible. At its meeting on Thursday, September 23, the bank made decisions that made the market literally flinch, and the GBP/USD pair soar by 140 points, from 1.3608 to 1.3748. The regulator not only announced its plans to tighten monetary policy, but also outlined the timing of the refinancing rate increase. The first increase to 0.25% is due in May 2022 and it will rise to 0.50% in December.
In contrast to the Fed's vague timetable, the Bank of England's plan outlined fairly clear milestones, which, as already stated, the market received with enthusiasm. But the GBP/USD pair did not go above 1.3748, because despite the lack of concrete figures at the moment, the Fed's massive plan to end QE will be implemented, and in a short enough time frame. This cooled the fervor of the pound supporters, and as a result, the week-long bout of bulls and bears on the GBP/USD pair ended with a victory for the latter: starting the five-day run at 1.3730, it ended it at 1.3670.
Technical analysis is also on the bear side: both oscillators and trend indicators are red on D1. It is not only the trend of the last two weeks that affects, but also the dynamics of the three months of the past summer. But as for the experts who forecast the week ahead, the vote is 50 to 50.
Resistances are at levels 1.3690, 1.3765, 1.3810, 1.3910, then 1.3960, 1.4000 and 1.4100. The bulls aim to refresh the June 01 high at 1.4250. Supports are in zones 1.3640, 1.3600, 1.3570 and 1.3520.
In terms of macro statistics, the UK GDP for Q2 2021 will be released on Thursday 30 September. And, while the previous value was positive (+4.8%), it is now forecast to go negative, minus 1.5%.
USD/JPY: Japanese Doves Lose
The USD/JPY pair has been moving along the 110.00 horizon since last March, making rare attempts to get out of the 108.30-111.00 trading channel. This time too, having started the five-day period at 109.95, it reached a height of 110.78 by the end of the week, and ended the trading session at 110.75.
Unlike other central banks in advanced economies, the Bank of Japan remains committed to ultra-soft monetary policy and negative interest rates. That is why the yen is still of interest not as a tool for making money, but as a safe haven currency.
The start of the week was good for it: the risk aversion triggered by the possible bankruptcy of Evergrande pushed the pair USD/JPY down to the horizon of 109.10. However, things went wrong later. Investors wanted profit again, turning to risky assets. After the Fed meeting, the 10-year US treasuries yield soared above 1.44%. In fact, the yield spread on Japan's 10-year bonds and similar US bonds has gone beyond the recent consolidation in favor of US bonds. And such a balance of strength played into the hands of USD/JPY bulls, weakening the yen's position.
If the Bank of Japan continues to maintain dovish policy and the US Fed actively winds down its fiscal stimulus program, the yen will not feel good. And the USD/JPY pair will still take the 112.00 high by storm. The Japanese currency can be saved by either another drop in demand for risk assets or simply market reluctance to move the pair above the established medium-term corridor.
At the moment, 60% of experts believe that the USD/JPY pair can get close to 112.00. But only half of the analysts vote for it to move above that level. The second half believes that the pair will return to the above-mentioned corridor again.
As for the indicators on D1, 65% of the oscillators look north, the rest are either colored neutral gray or signal the pair is overbought. But the trend indicators unanimously vote for the continuation of the hike to the north.
Support levels are unchanged: 110.15, 109.60, 109.10, 108.70 and 108.30. The dream of the bears (it seems to be already impossible) is to retest the April low of 107.45. The nearest resistance levels are 110.80, 111.00 and 111.65. The ultimate goal of the bulls is still the same: to reach the cherished height of 112.00. And maybe even overcome it.
As for the events that will take place in Japan in the coming week, we note the meeting of the Monetary Policy Committee of the Bank of Japan on Tuesday September 28 and the publication of the Tankan Index of Large Producers of the country for the Q3 on Friday October 01. But will they be able to seriously affect the USD/JPY quotes? In our view, not likely.
CRYPTOCURRENCIES: Whales prepare for Bear Attack

This week's BTC/USD and ETH/USD charts are very similar to those of the S&P500 and Dow Jones stock indices. The reason is fluctuating investor sentiment.
The risk of default on obligations of one of the largest construction companies in China, Evergrande, which has accumulated debt in the amount of 2 trillion yuan ($ 309 billion), provoked panic in the financial markets on September 20. Investors began to get rid of risky assets, crashing stock markets. The cryptocurrency market did not escape the sell-off either. If bitcoin was at $52,870 on Monday, it fell to $39,666 for a short time on Tuesday, losing up to 25% of its value.
The panic caused by Evergrande subsided on September 22, followed by a correction, and moderate risk appetite returned to investors after the Fed meeting, and the charts crept further north. However, it was too early to think that the sell-off was over. After rising to $45,150, bitcoin flew down again on Friday, September 24, then fought back and is trading at $43,000 at the time of writing.
The reason for another fall was China again, with the People's Bank of China declaring all cryptocurrency related activities illegal, promising to take tough action against violators. The ban includes the services of foreign crypto exchanges provided in the country, among other things.
In addition to pressure from regulators, whale behavior is another warning sign. On the one hand, the number of coins they own is growing. If in February there were an average of 3236 BTC per whale, this figure increased to 3722 BTC in September. But the number of whales themselves has decreased by 15% and now stands at 2,125. This is thelowest for the last 15 months. In addition, significant amounts of their coins have flowed from their wallets to exchange accounts. This suggests that the whales are preparing for a possible continuation of the bear market.
Of course, whales are not a single entity. And despite the general desire to make a profit, they can be divided into short-term and long-term investors. The former are prone to speculation and quick fixation of small profits. The second, such as MicroStrategy, prefer to restock on price downturns. And it is thanks to them that the market is kept from a complete collapse.
As for investor sentiment, the data provided by Glassnode in the latest report is interesting. Since late July, while the price of bitcoin has been climbing from $31,000 to $52,000, long-term holders have sold coins they purchased between the $18,000 and $31,000 levels. According to analysts, this suggests that some of the passive investors have moved into the category of active traders selling coins that were purchased at close to current prices.
The total crypto market capitalization has again dropped below the psychologically important threshold of $2.0 trillion and is at $1.84 trillion. The Crypto Fear & Greed Index has moved from the neutral zone (48 points) to the Fear zone. It was 27 on Thursday, September 23, at the low of the week, and it grew slightly on Friday September 24 - up to 33 points.
In general, the crypto market is now in a state of uncertainty, some influencers predict unprecedented growth for it, while others, like the president of Euro Pacific Capital, Peter Schiff, believe that this "bubble" will burst soon. Of course, this discord applies not only to bitcoin, but also to ethereum.
The ETH price dropped 40%, from $4,020 to $2,650 in just three days last week, from September 20 to September 22. At the same time, JPMorgan bank strategist Nikolaos Panigirtzoglou believes that it should be even lower. In his opinion, the fair price for this altcoin is $1,500, based on the metrics of network activity.
The opposite view is taken by cryptocurrency trader and analyst Lark Davis, who said that ETH will reach $10,000 in the coming weeks. He noted that large investors, banks and corporations continue to invest in the ethereum ecosystem. Davis cited its limited supply in the market as another factor in favor of altcoin growth. 87% of Ethereum coins have not moved for more than three months, indicating investor reluctance to sell their savings. In addition, a significant shortage is created by burning of underlying transaction fees as well as by an increase in ethereum 2.0 staking deposits.
And in conclusion, one discovery that could be called a sensation. It turns out that exactly 100 years ago, the famous auto industrialist Henry Ford was already putting forward the idea of replacing gold with a so-called "energy currency." The issue was raised by him in the New York Tribune as early as 1921. It is striking that Ford's proposed project to launch a new currency is strikingly similar to the description of BTC, which was presented in 2008 by Satoshi Nakamoto.
The front page of the newspaper featured an article detailing the "energy currency" that Ford believed could replace gold and become the backbone of a new era's monetary system. This currency would be fully functioning on the basis of "units of force", and it was proposed to build a huge hydroelectric power station to issue it. Thus, it could become the most stable and secured monetary unit and would prevent the growth of the rich who profit from speculating in gold.
Summary 9/27 – 10/1
Monday, Sep 27, 2021
[php_everywhere instance="1"]
Tuesday, Sep 28, 2021
[php_everywhere instance="2"]
Wednesday, Sep 29, 2021
[php_everywhere instance="3"]
Thursday, Sep 30, 2021
[php_everywhere instance="4"]
Friday, Oct 1, 2021
[php_everywhere instance="5"]
Yen Dropped Broadly as Treasury Yields Jumped on Hawkish Fed
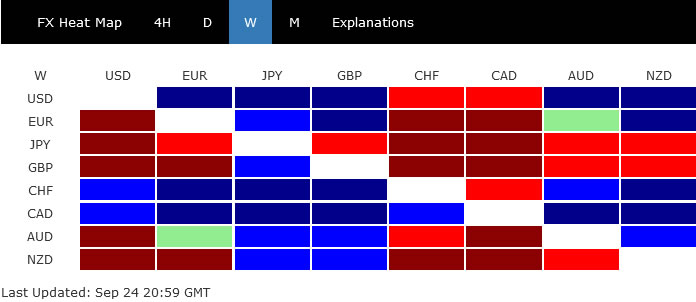
Yen's fortune reversed last week as US treasury yields accelerate up after hawkish FOMC meeting and projections. US stocks also display strong resilience and closed generally higher, reversing prior losses. Sterling, on the other hand, shrugged off hawkish BoE voting and ended as second weakest. Aussie and Kiwi were not too far away with concerns over China's Evergrande in Asian markets.
On the other hand, Canadian Dollar ended as the best performer, with help from extended rebound in oil price. Swiss Franc and Dollar followed as next strongest. However, it's noted that Dollar's upside momentum hasn't been too convincing. It's a big question on whether the greenback could ride on hawkish Fed to pick up more buying.
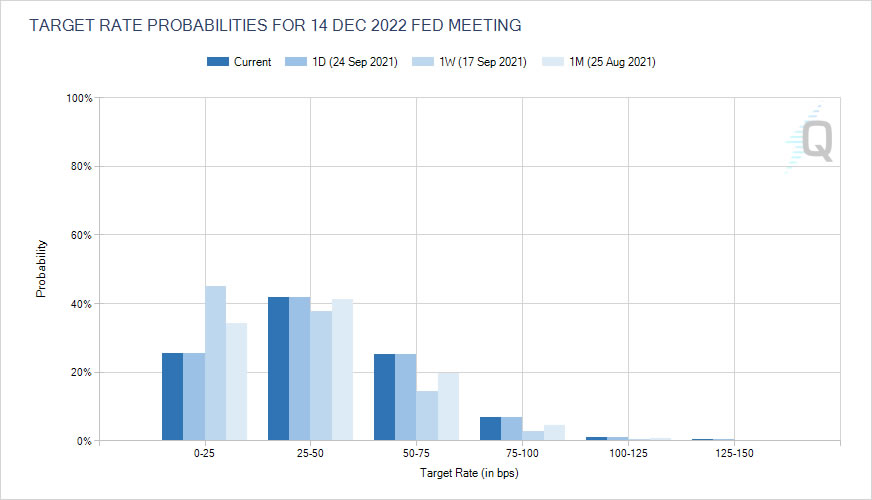
Market pricing in 75% chance of Fed hike by 2022 end
FOMC announce last week somehow met expectations of a hawkish twist. The statement clearly indicated that "a moderation in the pace of asset purchases may soon be warranted", if the "progress continues broadly as expected". That set up expectation that an announcement at the November meeting.
Additionally, Members have also pushed forward the timing of the first rate hike. The median dot plots showed that 9 out of 18 members projected it to happen in 2022. Indeed, the staff projection also showed that the policy rate would increase to 0.3% next year.
Latest fed funds futures are now pricing in only 25.43% chance of federal funds rate staying at 0-0.25% in December 2022. . That's a huge decline from 44.87% just a week ago. In other words, markets are now pricing in nearly 75% chance of at least one rate hike by the end of 2022.
5-year yield ready for upside breakout, 10-year yield broke 1.4 handle
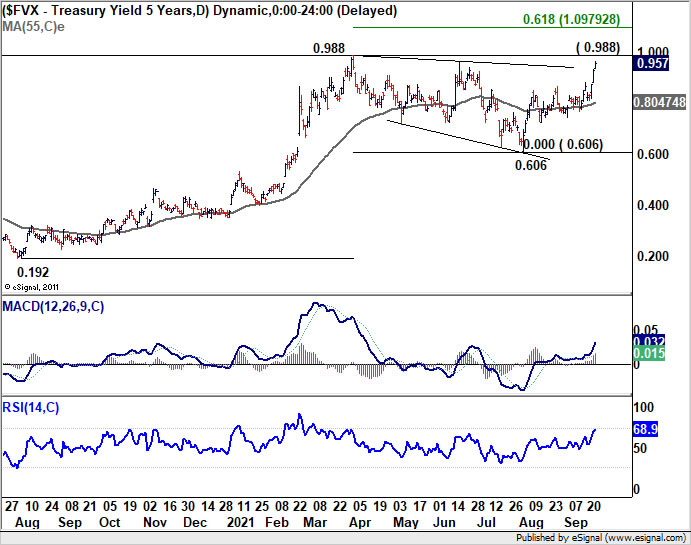
US treasury yield jumped notably last week and accelerated higher after FOMC. Closing at 0.957, 5-year yield is now in proximity to 0.988 high. Consolidation from there should have completed at 0.606 already and the up trend from 0.192 should be ready to resume. Based on current upside momentum, break of 0.988 would happen soon and FVX would target 61.8% projection of 0.192 to 0.988 from 0.606 at 1.098 next.
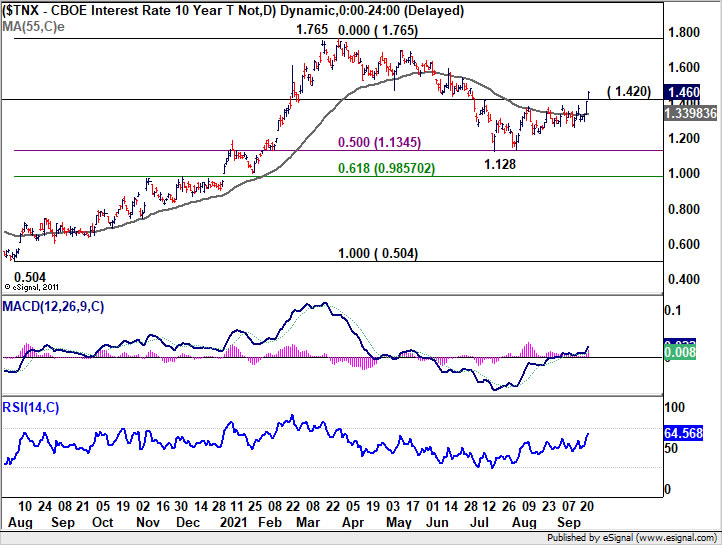
The benchmark 10-year yield also made substantial progress by breaking through 1.420 near term resistance. Overall, the development affirms that case that correction from 1.765 has completed at 1.128, after hitting 50% retracement of 0.504 to 1.765 at 1.134. Further rise is now in favor to retest 1.765 high next. The question is more on the strength of the momentum of the next rally.
S&P 500 displayed strong resilience, could have completed brief pull back
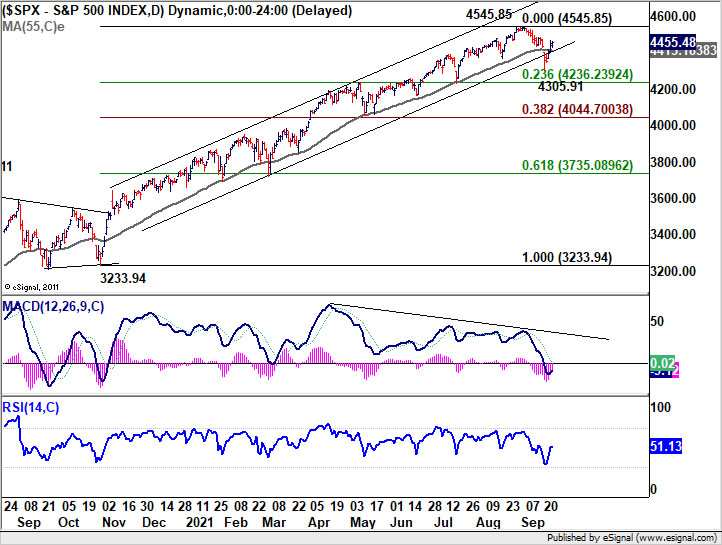
Stocks were surprisingly resilient last week, even in response to the hawkish FOMC announcement. S&P500's pull back looks completed at 4305.91 and near term bullishness was revived by a strong close above 55 day EMA. Consolidation from 4545.85 could turn out to be a relatively brief and shallow one. Even in case of another falling leg, downside would likely be contained by 23.6% retracement of 3233.94 to 4545.85 at 4235.23.
Dollar range bound despite hawkish Fed, more upside still in favor
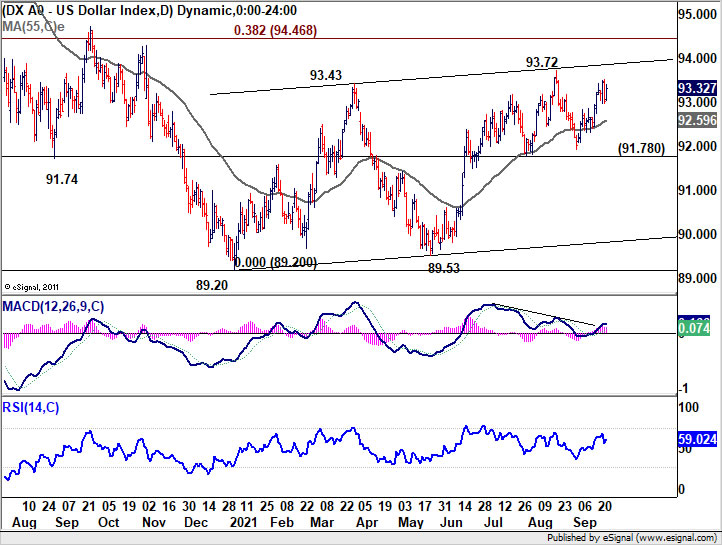
Dollar's reaction to Fed was pretty muted while Dollar index was bounded in tight range last week. Major reaction was actually found in Yen's selloff. Anyways, with 9.178 support intact, DXY's rise from 89.53 is in favor to continue through 93.72. That would also resume the whole pattern from 89.20. 38.2% retracement of 102.99 to 89.20 at 94.46 remains the major hurdle for DXY to overcome, if it's turning medium term outlook bullish.
CHF/JPY drew support from important zone and rebounded
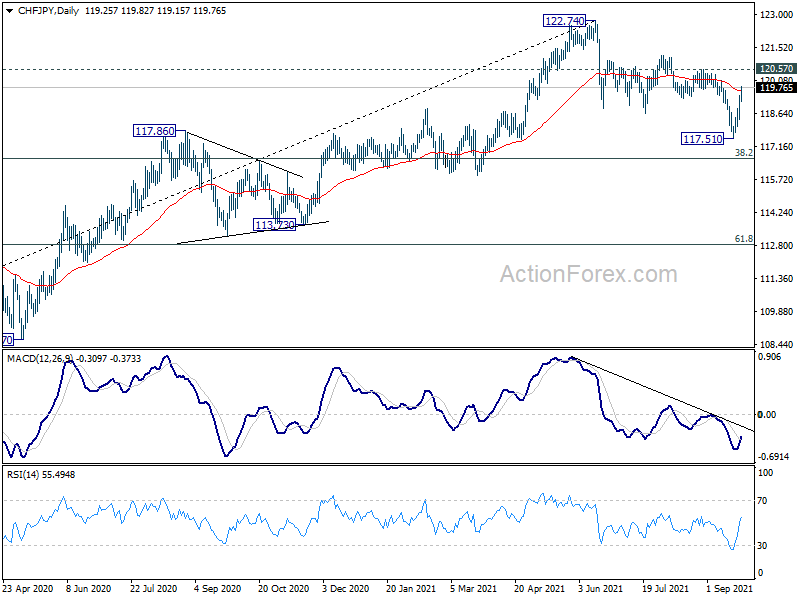
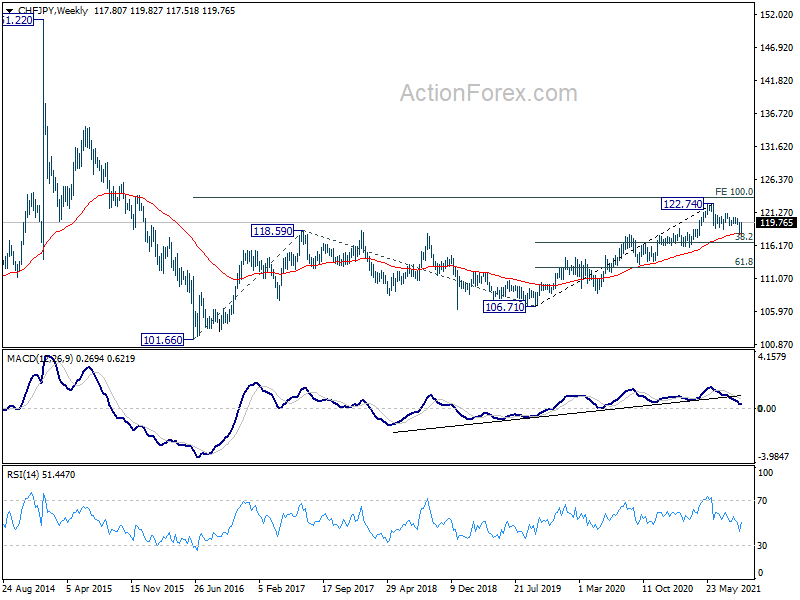
Talking about Yen's selloff, it's particular apparent in CHF/JPY which staged a sharp reversal and ended the week as the biggest mover. CHF/JPY has indeed drew strong support from key zone of between 38.2% retracement of 106.71 to 122.74 at 116.61 and 55 week EMA (now at 118.05). Near term focus is now back on 120.57 resistance. Firm break there should full retain medium term bullishness, and could send the cross through 122.74 high to resume larger long term up trend. In such case, Yen's selloff could accelerate further elsewhere.
USD/JPY Weekly Outlook
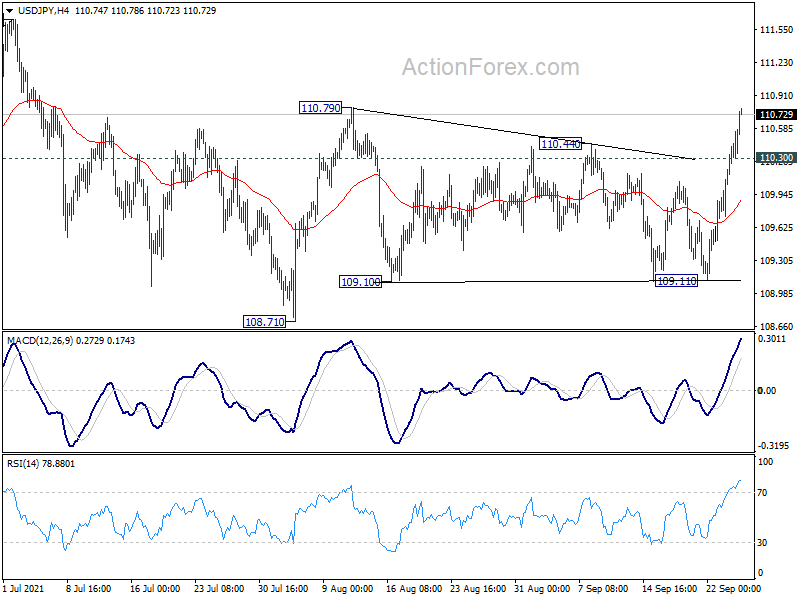
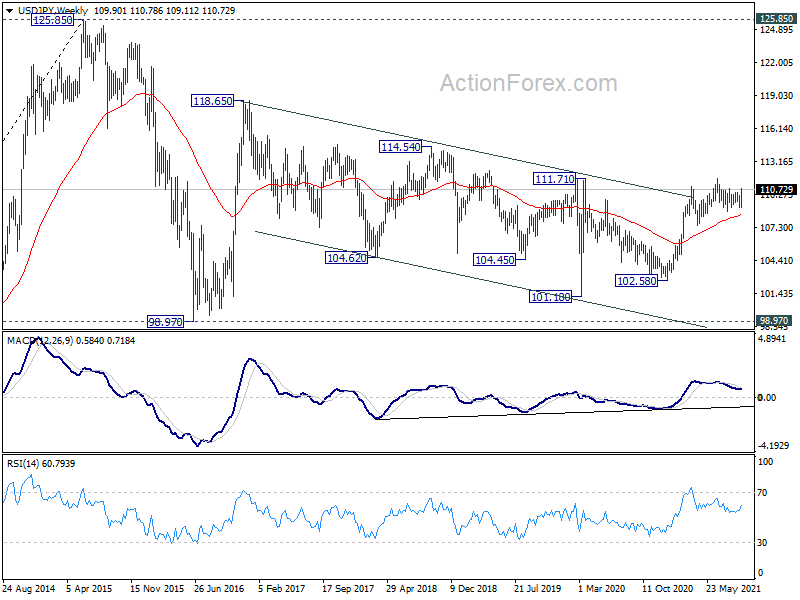
USD/JPY surged sharply higher to 110.78 last week. The break of 110.44 resistance suggests that consolidation pattern from 111.65 has completed already. Initial bias is now on the upside this week. Firm break of 110.79 resistance will target a test on 111.65 high. On the downside, below 110.30 minor support will mix up the near term outlook and turn bias neutral again.
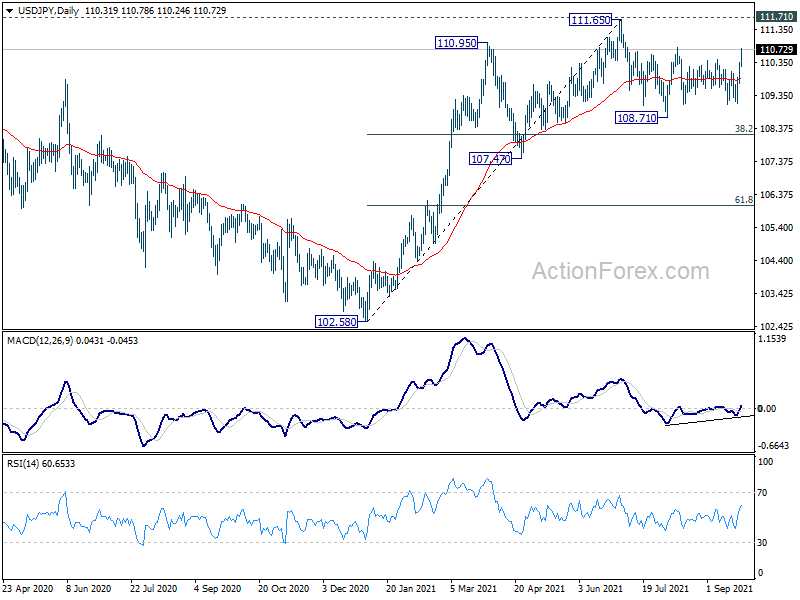
In the bigger picture, medium term outlook is staying neutral with 111.71 resistance intact. The pattern from 101.18 could still extend with another falling leg. Sustained trading below 55 day EMA will bring deeper fall to 107.47 support and below. Nevertheless, strong break of 111.71 resistance will confirm completion of the corrective decline from 118.65 (2016 high). Further rise should then be seen to 114.54 and then 118.65 resistance.
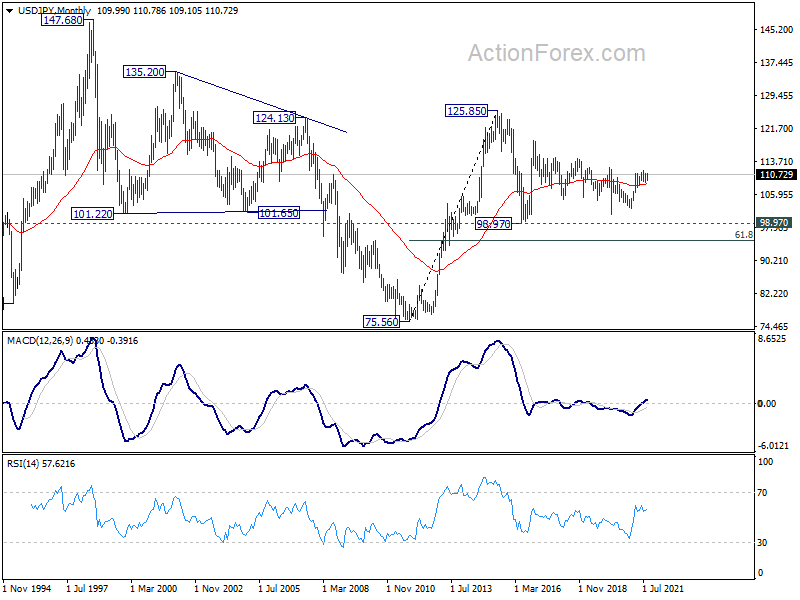
In the long term picture, the rise from 75.56 (2011 low) long term bottom to 125.85 (2015 high) is viewed as an impulsive move, no change in this view. Price actions from 125.85 are seen as a corrective pattern which could still extend. In case of deeper fall, downside should be contained by 61.8% retracement of 75.56 to 125.85 at 94.77. Up trend from 75.56 is expected to resume at a later stage for above 135.20/147.68 resistance zone.
CFTC Commitments of Traders – Natural Gas Prices Soared on Shortage. Demand is Prone to Increase Further as Cold...
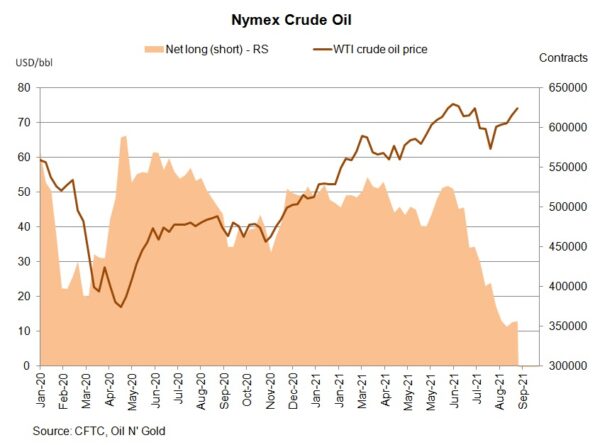
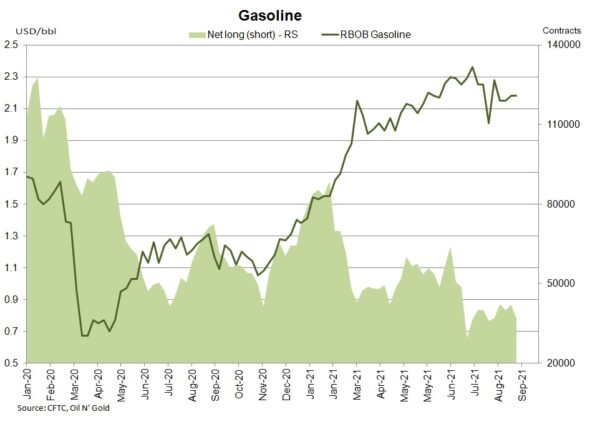
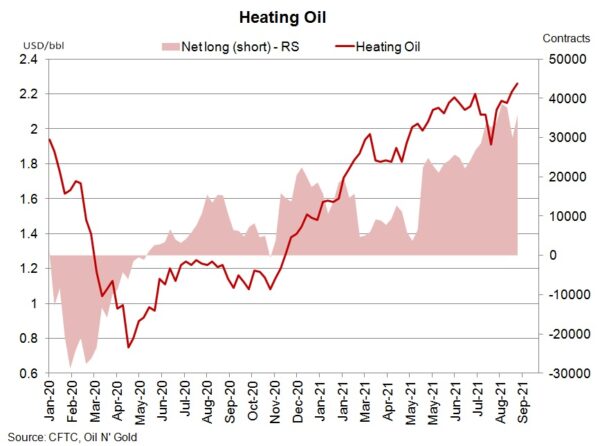
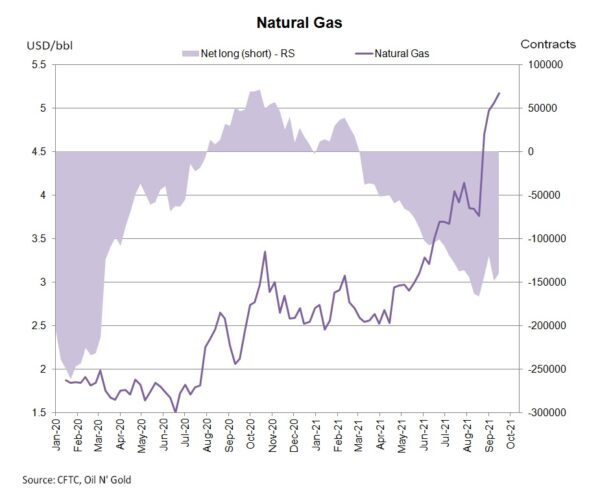
According to the CFTC Commitments of Traders report for the week ended September 21, NET LENGTH of crude oil futures added +914 contracts to 355 978. Bets on both sides fell with speculative longs and shorts down -6 263 contracts and -7 177 contracts, respectively. For refined oil products, NET LENGTH for heating oil rose +5 899 contracts to 35 890, while that for gasoline fell -5 299 contracts to 36 673. NET SHORT of natural gas futures plunged -8 359 contracts to 140 220 during the week. Bets were lowered on both sides but shorts declined sharply amidst a sharp rally in natural gas price. Demand for gas should increase as cold weather approaches, leading to a more optimistic outlook on gas prices and further decline in NET SHORT in coming months.
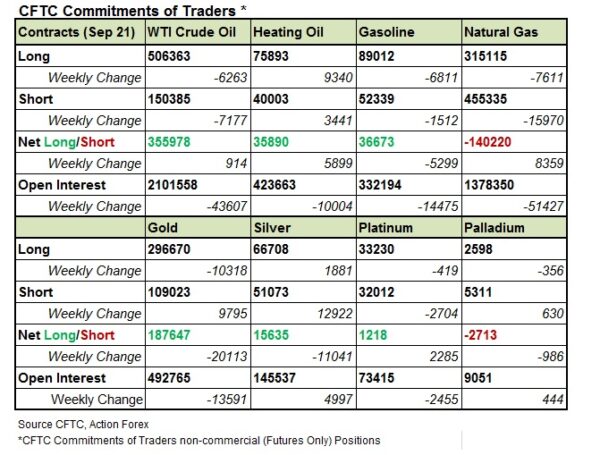
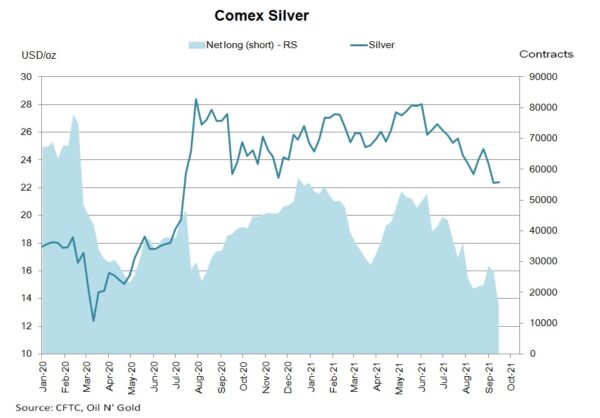
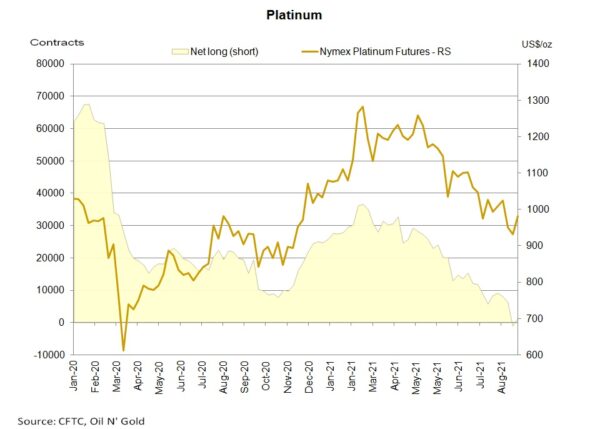
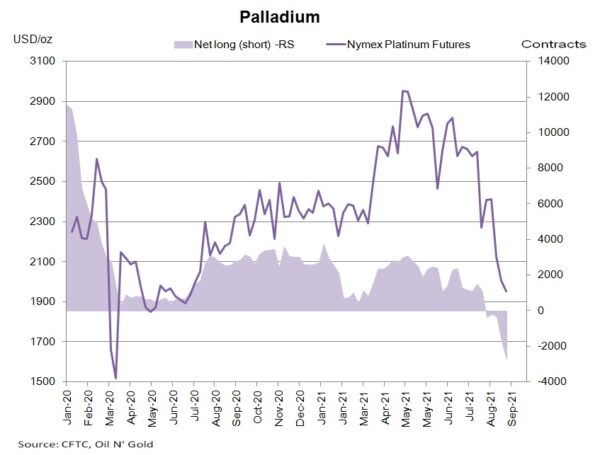
 Gold futures’ NET LENGTH slumped -20 113 contracts to 187 647. Silver futures’ NET LENGTH plunged -11 041 contracts to 15 635. For PGMs, Nymex platinum futures returned to NET LENGTH of 1 218 contracts, while NET SHORT for palladium futures added +986 contracts to 2 713.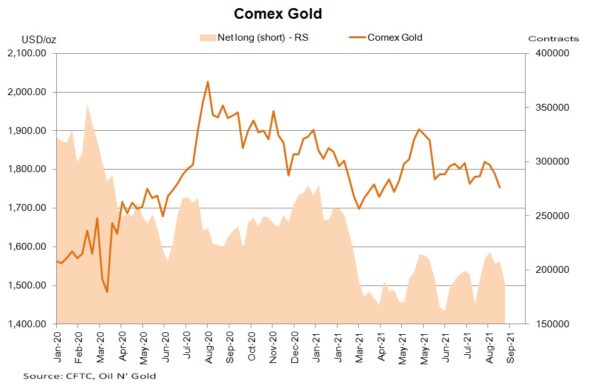
CFTC Commitments of Traders – USD Supported by Tapering Hopes
As suggested in the CFTC Commitments of Traders report in the week ended September 21, NET LENGTH of USD index futures ADDED +827 contracts to 25 100. The Fed signaled that QE tapering would coon "soon" while half of the committee members projected that rate hike would come as soon as next year. Concerning European currencies, NET LENGTH in EUR futures sank -15 710 contracts to 12 095. GBP futures drifted back to NET SHORT of -218 contracts. British pound got dumped until the BOE meeting delivered a slightly more hawkish bias.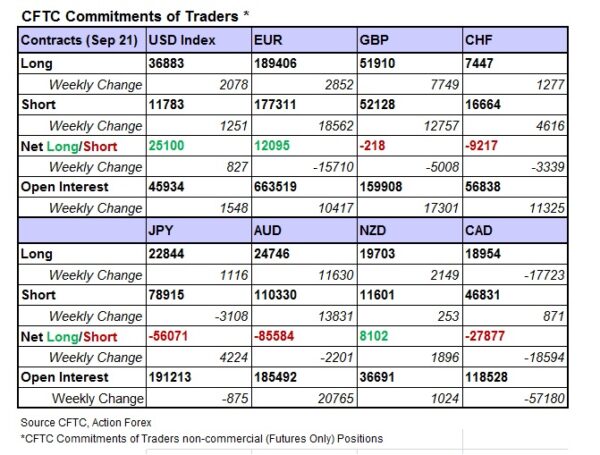
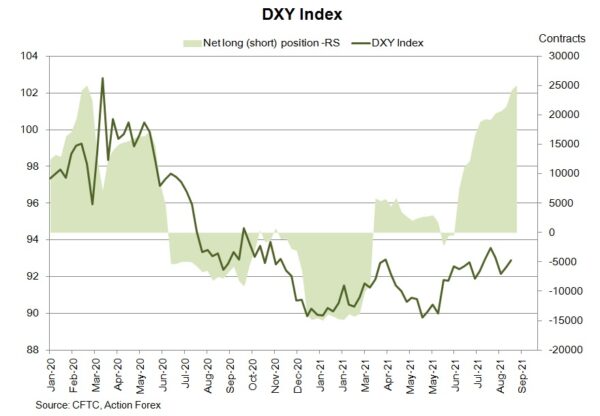
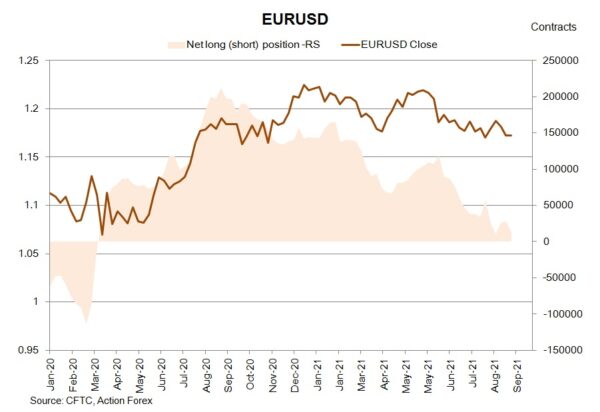
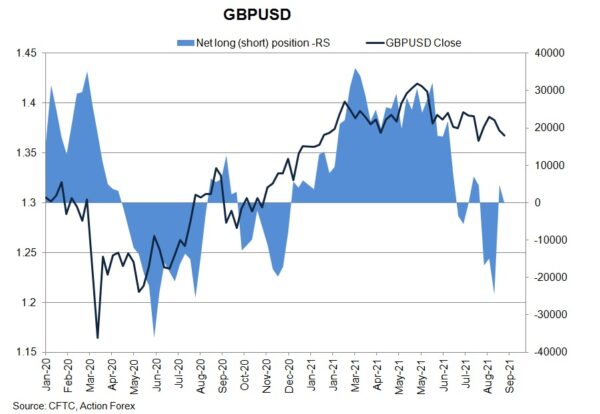
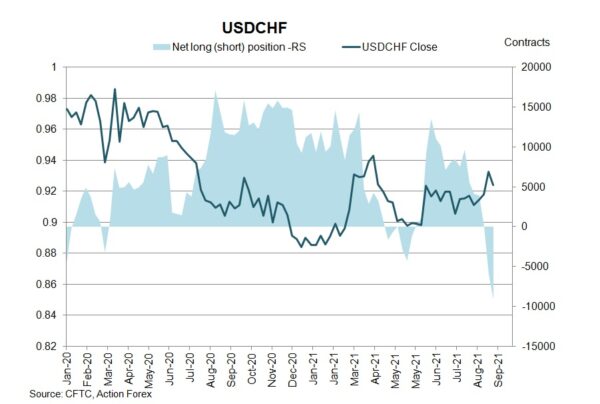
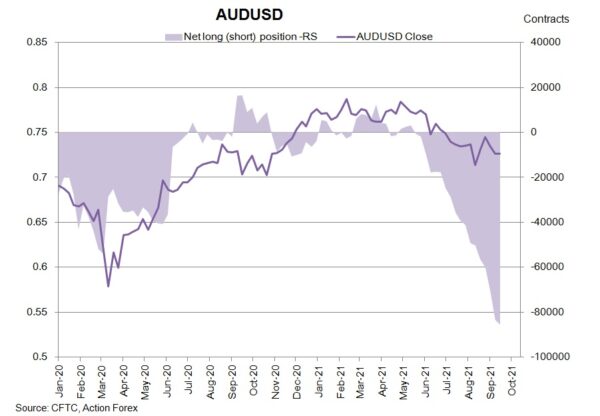
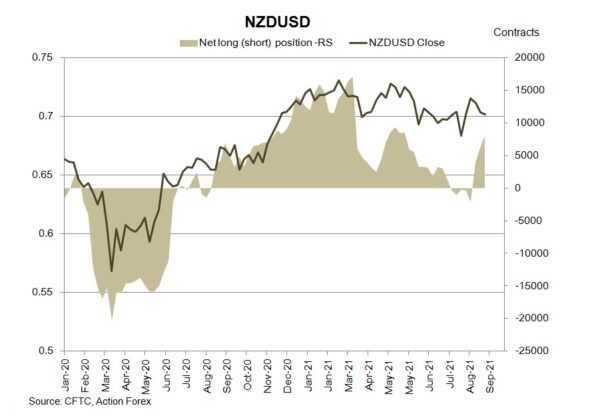
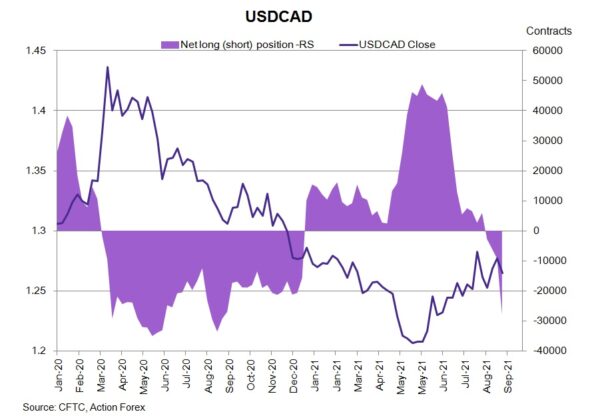
On safe-haven currencies, NET SHORT of CHF future soared +3 339 contracts to 9 217 while that of JPY futures declined -4 224 contracts to 56 071. Concerning commodity currencies, NET SHORT of AUD futures increased further (but at a slower pace), by +2 201 contracts to 85 584. NET LENGTH for NZD futures added +1 896 contracts to 8 102 during the week. CAD futures' NET SHORT jumped +18 594 contracts to 27 8877.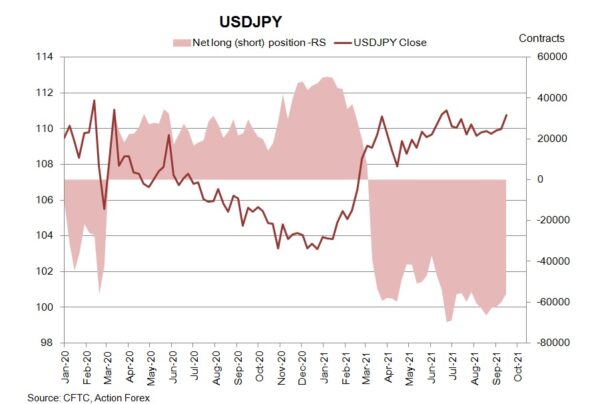
EUR/USD Weekly Outlook
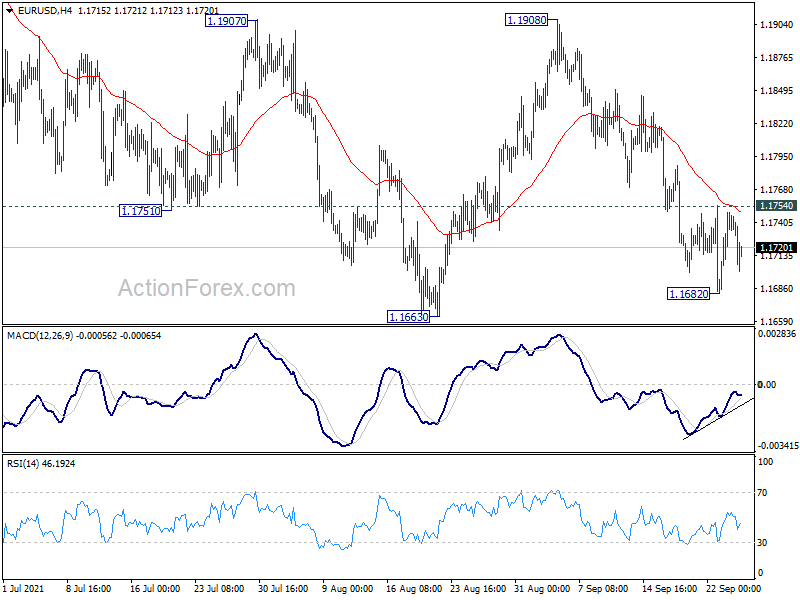
EUR/USD's fall from 1.1908 continues last week but lost momentum ahead of 1.1663 low. Initial bias remains neutral this week first. On the downside, , sustained break of 1.1663 support will resume the fall from 1.2265, and the pattern from 1.2348, to 1.1602 key support next. On the upside, however, above 1.1754 minor resistance will turn bias back to the upside for 1.1908 again.
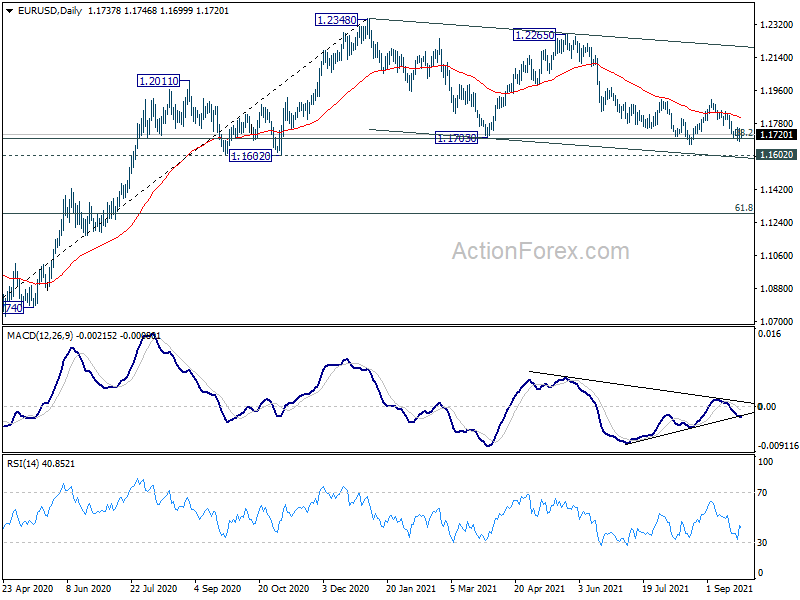
In the bigger picture, rise from 1.0635 is seen as the third leg of the pattern from 1.0339 (2017 low). Further rally remains in favors long as 1.1602 support holds, to cluster resistance at 1.2555 next, (38.2% retracement of 1.6039 to 1.0339 at 1.2516). However sustained break of 1.1602 will argue that the rise from 1.0635 is over, and turn medium term outlook bearish again. Deeper fall would be seen to 61.8% retracement of 1.0635 to 1.2348 at 1.1289 and below.
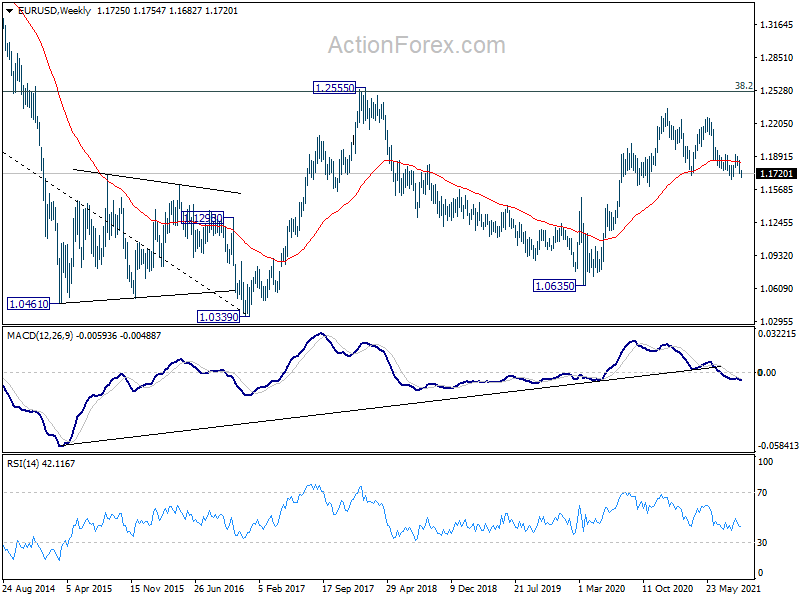
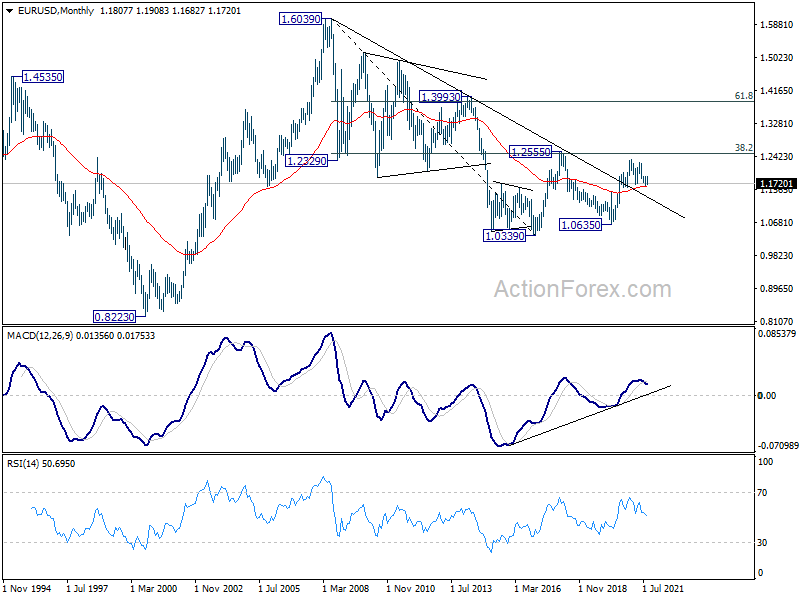
In the long term picture, focus remains on 1.2555 cluster resistance (38.2% retracement of 1.6039 to 1.0339 at 1.2516). Sustained break there should confirm long term bullish reversal and target 61.8% retracement at 1.3862 and above. However, rejection by 1.2555 will keep long term outlook neutral first, and raise the prospect of down trend resumption at a later stage.
USD/JPY Weekly Outlook
USD/JPY surged sharply higher to 110.78 last week. The break of 110.44 resistance suggests that consolidation pattern from 111.65 has completed already. Initial bias is now on the upside this week. Firm break of 110.79 resistance will target a test on 111.65 high. On the downside, below 110.30 minor support will mix up the near term outlook and turn bias neutral again.
In the bigger picture, medium term outlook is staying neutral with 111.71 resistance intact. The pattern from 101.18 could still extend with another falling leg. Sustained trading below 55 day EMA will bring deeper fall to 107.47 support and below. Nevertheless, strong break of 111.71 resistance will confirm completion of the corrective decline from 118.65 (2016 high). Further rise should then be seen to 114.54 and then 118.65 resistance.
In the long term picture, the rise from 75.56 (2011 low) long term bottom to 125.85 (2015 high) is viewed as an impulsive move, no change in this view. Price actions from 125.85 are seen as a corrective pattern which could still extend. In case of deeper fall, downside should be contained by 61.8% retracement of 75.56 to 125.85 at 94.77. Up trend from 75.56 is expected to resume at a later stage for above 135.20/147.68 resistance zone.
GBP/USD Weekly Outlook
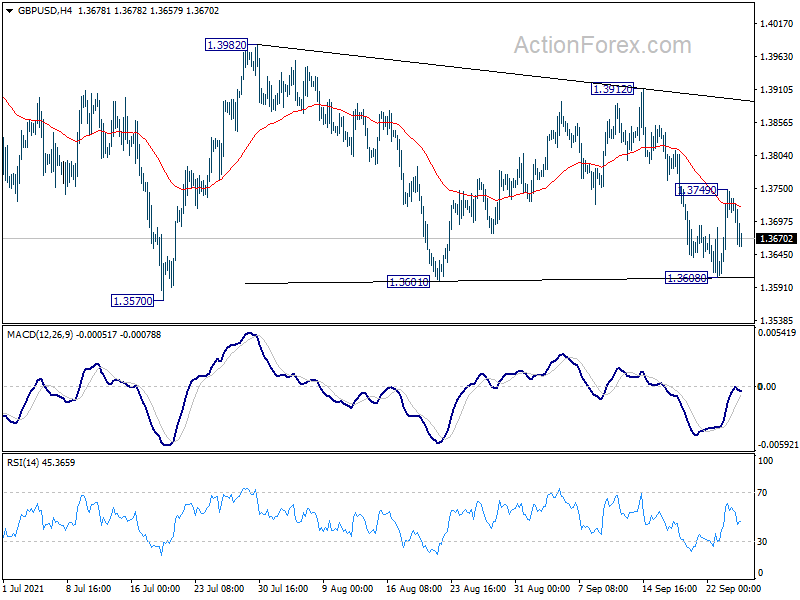
GBP/USD dropped to 1.3608 last week but defended 1.3601 support and recovered. Yet, it failed to sustain above 4 hour 55 EMA and retreated. Initial bias is turned neutral this week first. On the upside, above 1.3749 will target a test on 1.3912 resistance. Firm break there will argue that consolidation pattern from 1.4248 has completed and stronger rally to retest this high. On the downside, however, break of 1.3570 support will target 1.3482 key support level. Sustained break there will carry larger bearish implication and target 1.3163 fibonacci level.
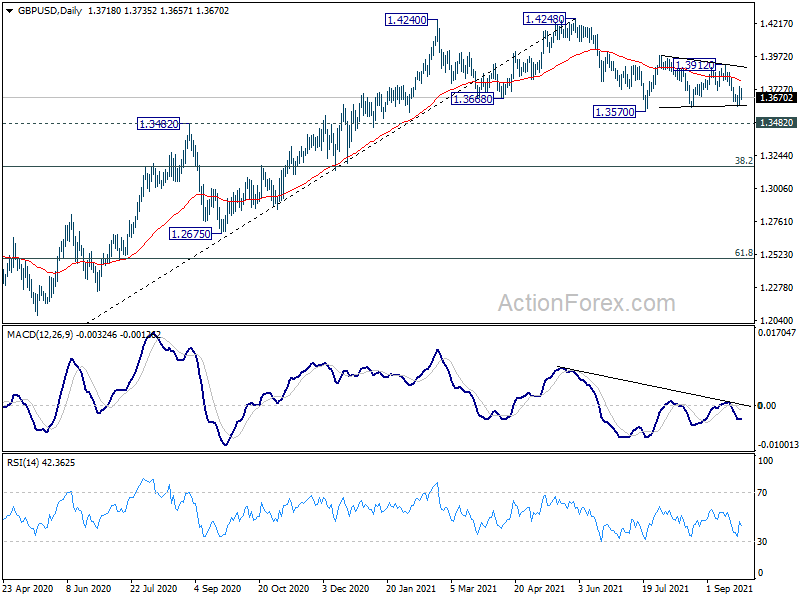
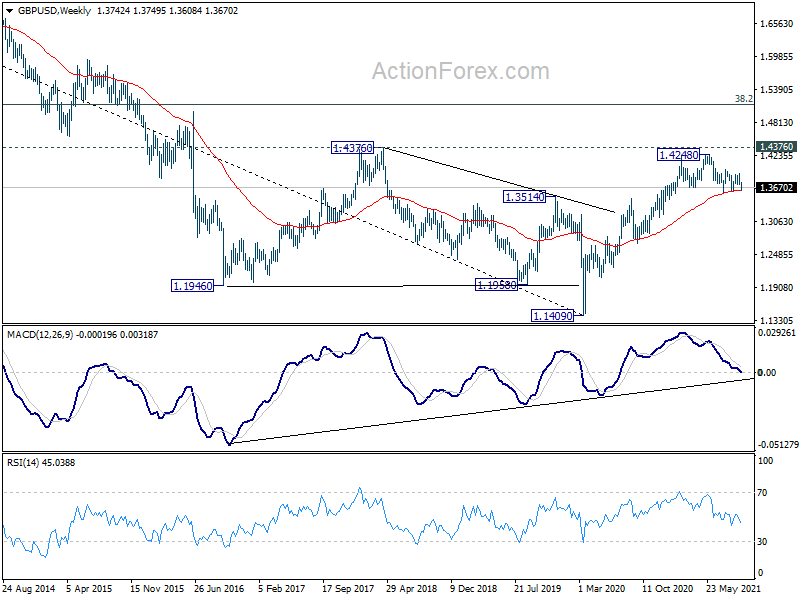
In the bigger picture, as long as 1.3482 resistance turned support holds, we'd still treat price actions from 1.4248 as a corrective move. That is, up trend from 1.1409 (2020 low) is in favor to resume. Decisive break of 1.4376 key resistance (2018 high) would indeed carry long term bullish implications. However, sustained break of 1.3482 will at least bring deeper fall to 38.2% retracement of 1.1409 to 1.4248 at 1.3164, or even further to 61.8% retracement at 1.2493.
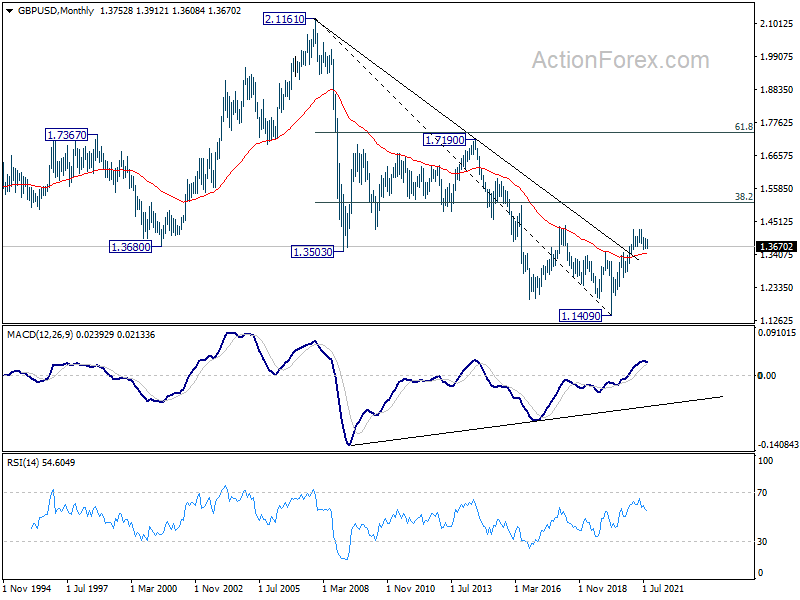
In the longer term picture, a long term bottom should be in place at 1.1409, on bullish convergence condition in monthly MACD. Rise from there would target 38.2% retracement of 2.1161 to 1.1409 at 1.5134. Reaction from there would reveal whether rise from 1.1409 is just a correction, or developing into a long term up trend.
USD/CHF Weekly Outlook
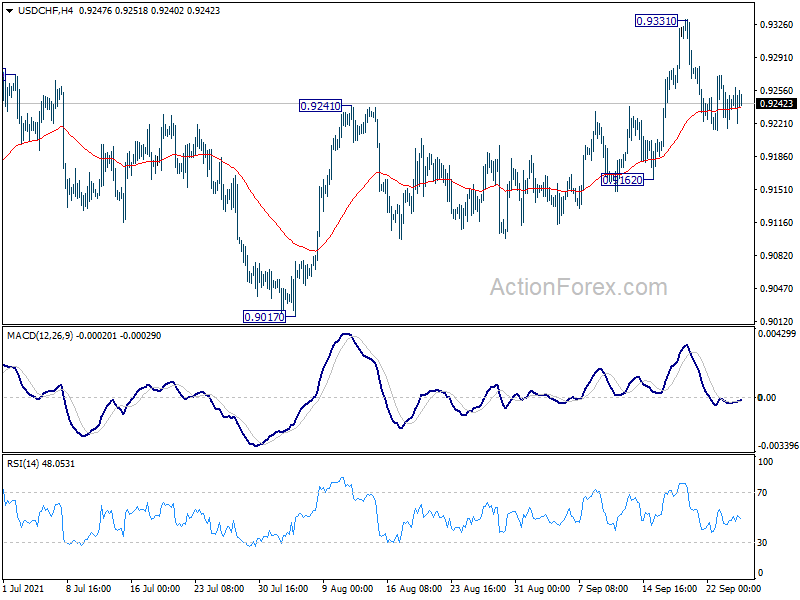
USD/CHF stays in consolidation below 0.9331 last week and outlook is unchanged. Initial bias remains neutral this week first. Overall, further rally is expected as long a s0.9162 support holds. On the upside, break of 0.9331 will target 0.9471 key resistance. Sustained break there will carry larger bullish implications. However, break of 0.9162 will turn bias back to the downside for 0.9017 support instead.
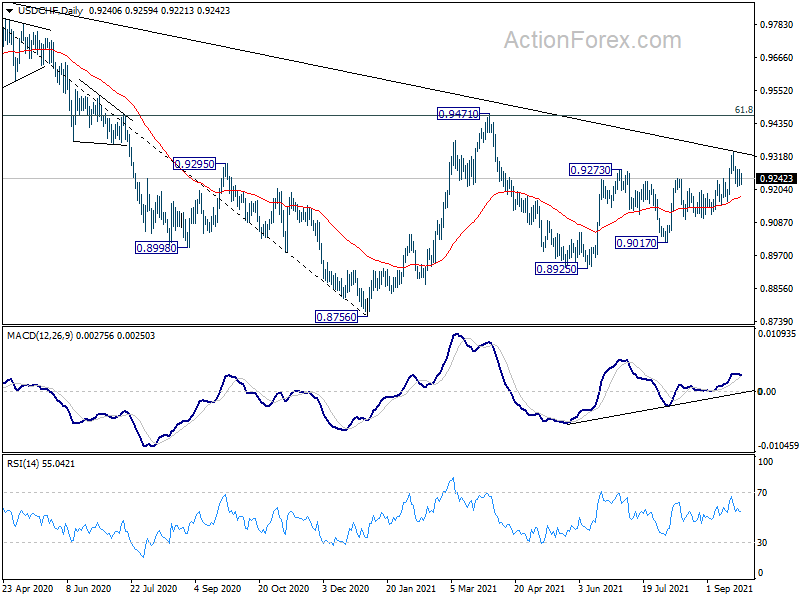
In the bigger picture, the strong rally above 55 week EMA (now at 0.9175) now tilts favor to the case of bullish trend reversal. That is, decline from 1.3042 (2016 high) is probably completed at 0.8756 already. Sustained break of 0.9471 resistance should confirm this case and pave the way to retest 1.0342 ahead. However, rejection by 0.9471 will mix up the outlook again and retain some medium term bearishness.
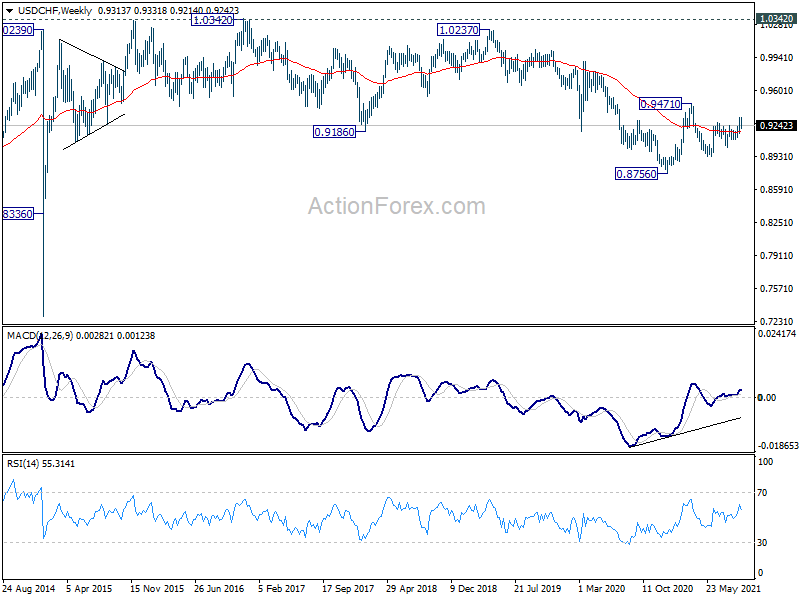
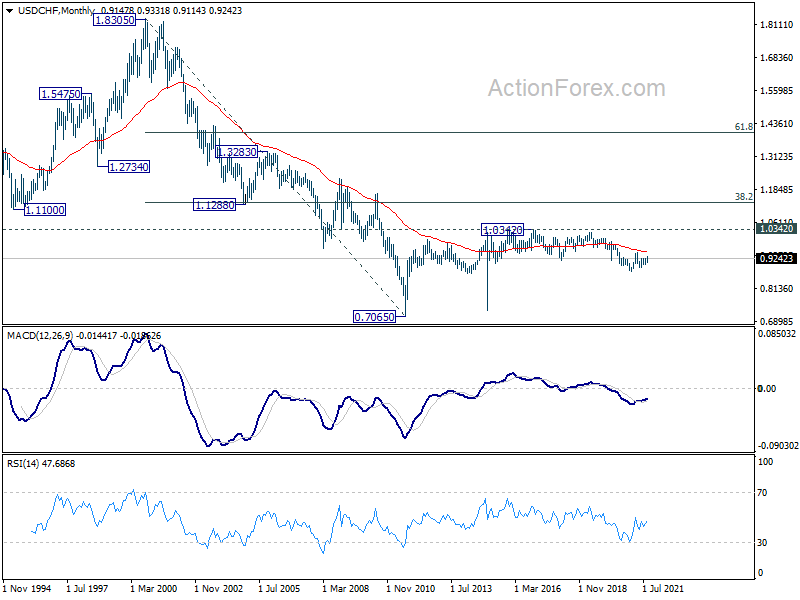
In the long term picture, price actions from 0.7065 (2011 low) are currently seen as developing into a long term corrective pattern, at least until a firm break of 1.0342 resistance.
AUD/USD Weekly Outlook
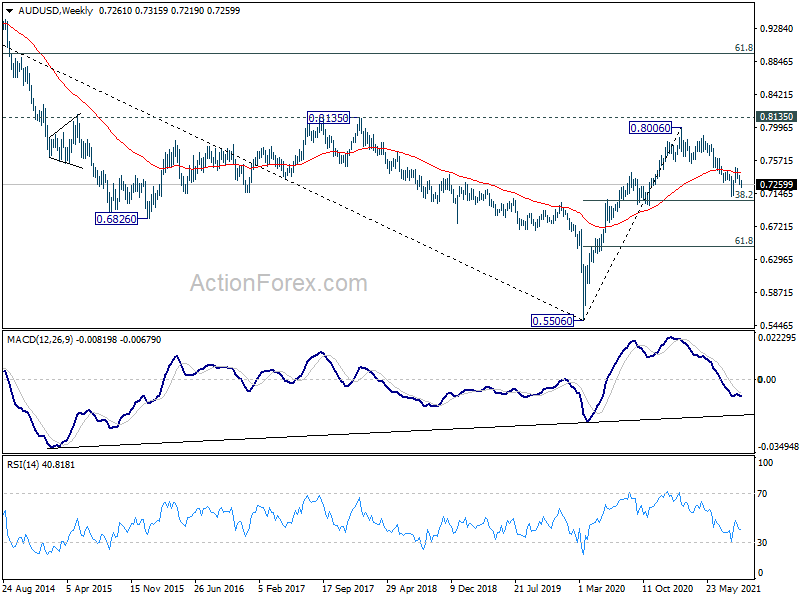
AUD/USD formed a temporary low at 0.7219 last week and turned sideway. Initial bias remains neutral this week first. On the downside, below 0.7219 will resume the fall from 0.7477 to retest 0.7105 low. Firm break there will resume whole decline from 0.8006 for 0.6991 support next. On the upside, above 0.7320 minor resistance will turn bias back to the upside for 0.7477 resistance instead.
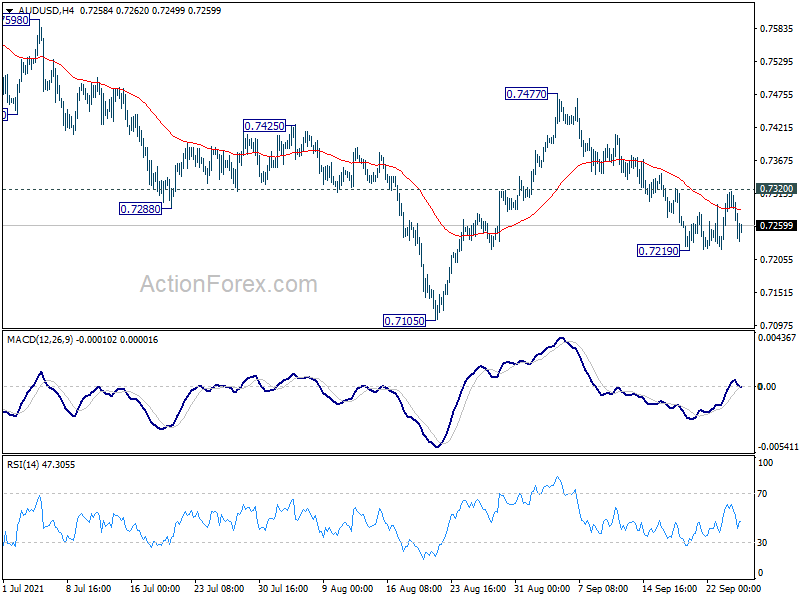
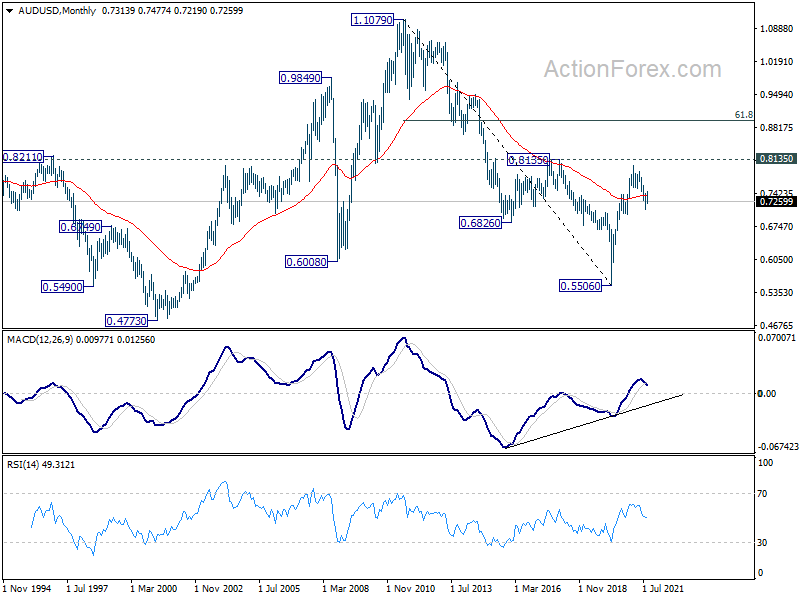
In the bigger picture, with 0.6991 cluster support (38.2% retracement of 0.5506 to 0.8006 at 0.7051) intact, we're seeing price action from 0.8006 as a correction only. That is, up trend from 0.5506 low would resume after the correction completes. In that case, main focus will be 0.8135 key resistance (2018 high). Sustained break there will carry larger bullish implications. However, sustained break of 0.6991 will argue that the whole medium term trend has indeed reversed.
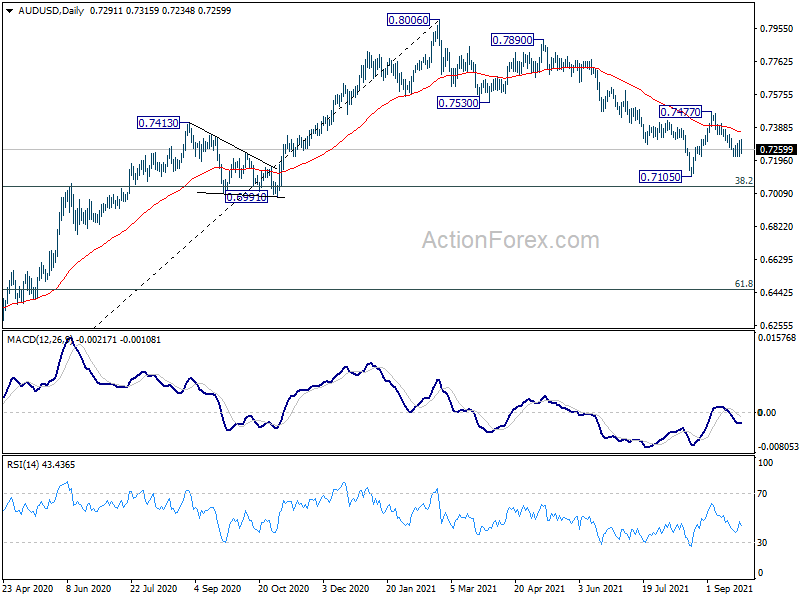
In the longer term picture, focus remains on 0.8135 structural resistance. Decisive break there will argue that rise from 0.5506 is developing into a long term up trend that reverses whole down trend from 1.1079 (2011 high). In that case, further rally would be seen to 61.8% retracement of 1.1079 to 0.5506 at 0.8950 and possibly above. Rejection by 0.8135 will keep long term outlook neutral at best.