

Sample Category Title
EUR/JPY Mid-Day Outlook
Daily Pivots: (S1) 128.69; (P) 129.18; (R1) 129.45; More....
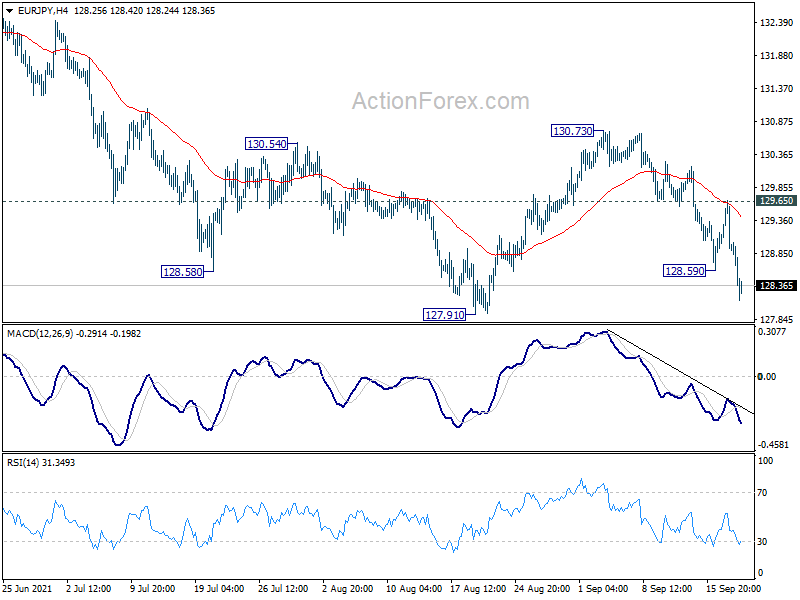
EUR/JPY's fall resume by breaking 128.59 and intraday bias is back on the downside for 127.91 support. Firm break there will resume whole fall from 134.11 and target 127.07 resistance turned support. Sustained break there will carry larger bearish implication and pave the way to 121.91 fibonacci level. On the upside, however, break of 129.65 will turn bias back to the upside for 130.73 resistance.
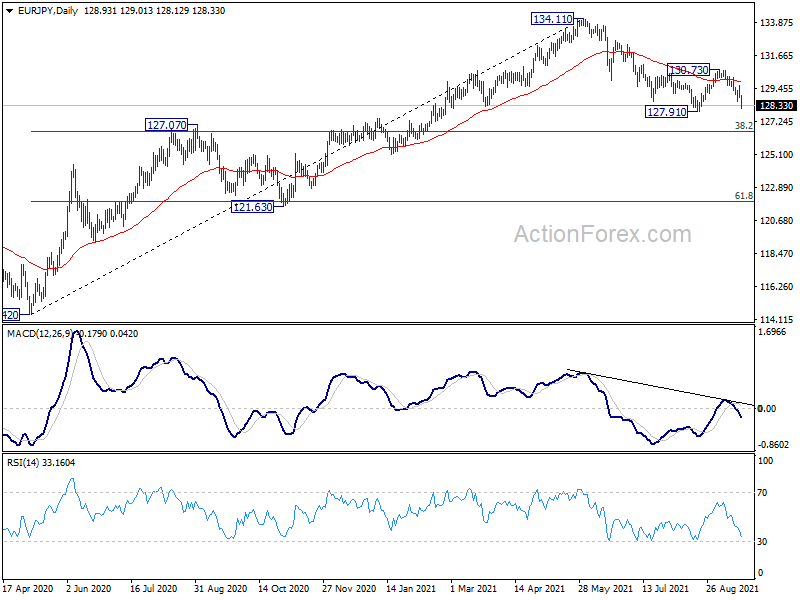
In the bigger picture, rise from 114.42 is seen as a medium term rising leg inside a long term sideway pattern. As long as 127.07 resistance turned support holds, further rise is still expected to retest 137.49 (2018 high). However, firm break of 127.07 will argue that the medium term trend has reversed, deeper fall would be seen to 61.8% retracement of 114.42 to 134.11 at 121.94.
GBP/JPY Mid-Day Outlook
Daily Pivots: (S1) 150.65; (P) 151.29; (R1) 151.61; More...
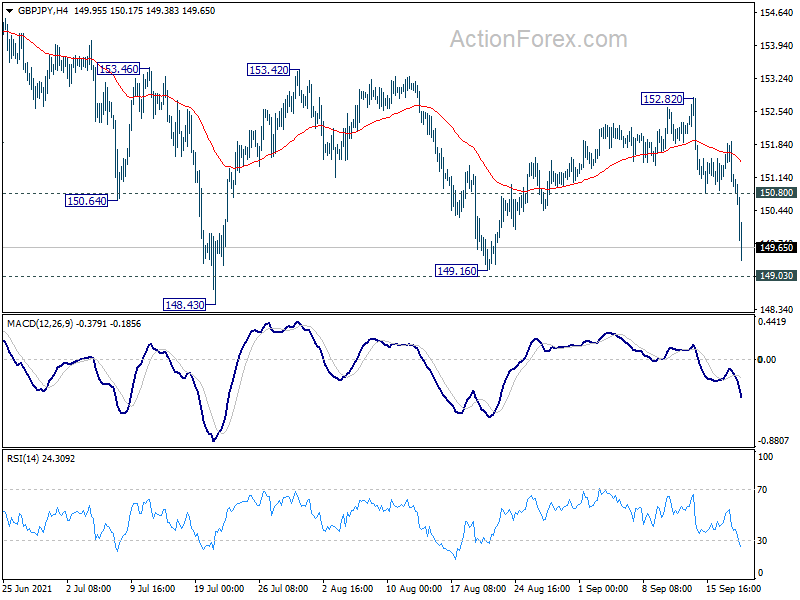
GBP/JPY's decline accelerates today and intraday bias stays on the downside for 148.43/149.16 key support zone. Decisive break there will resume whole fall from 156.05 to 143.78 fibonacci level. On the upside, above 150.80 minor resistance will turn intraday bias neutral first.
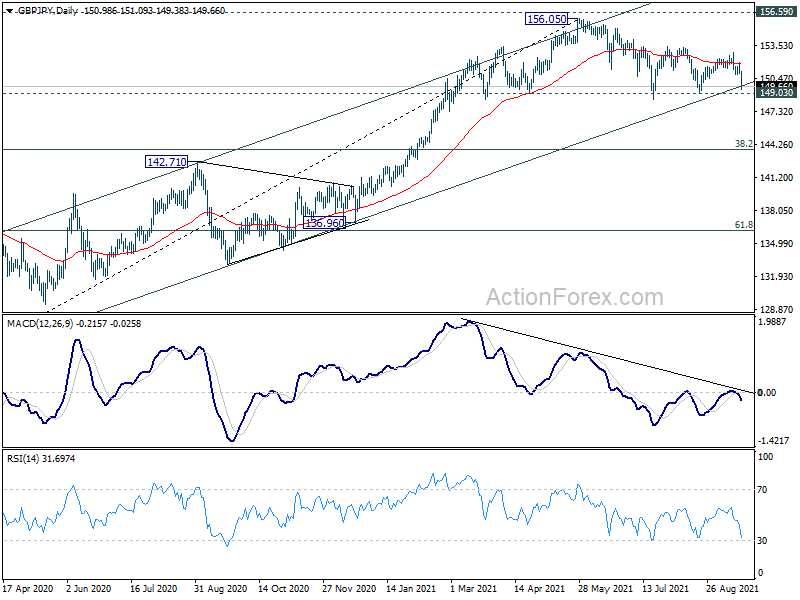
In the bigger picture, rise from 123.94 is seen as the third leg of the pattern from 122.75 (2016 low). As long as 149.03 support holds, such rise would still resume at a later stage. However, sustained break of 149.03 support will indicate rejection by 156.59. Fall from 156.05 would be at least correcting the whole rise from 123.94. Deeper fall would be seen back 38.2% retracement of 123.94 to 156.05 at 143.78 first.
Yen Accelerates Further as China Fear Spreads, Dow to Press Key Support
Markets are generally in deep risk-off mode today, as China property fears spread from Hong Kong stocks to European to US. Yen remains the strongest one as rally extends, which Swiss Franc is trying to catch up. Dollar is is losing some ground but stays much better than others. Canadian Dollar is currently the worst performing, as WTI oil is back pressing 70 handle. Aussie is the second worst while Sterling is the third.
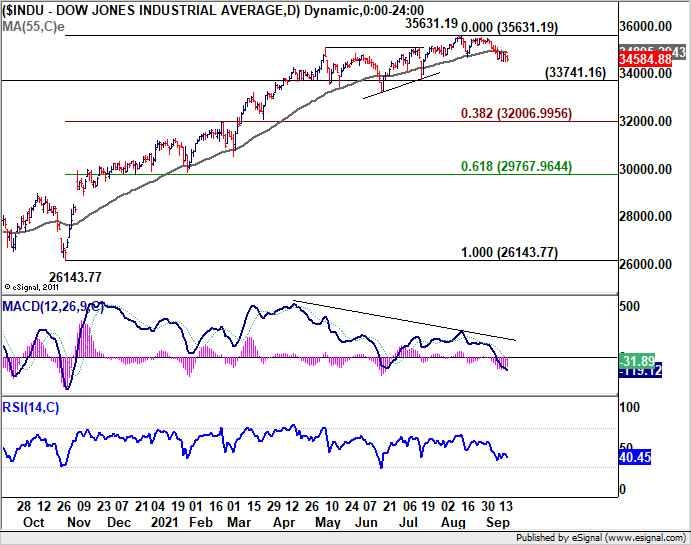
Technically, DOW is ready to gap down today and could have a first test on 33741.16 structural support. We'd see DOW would dive through this support level within a few day. If that happens, the stage would be set for a deeper correction, to up trend from 26143.77 to 35631.19, towards 38.2% retracement at 32006.99 at a later stage. And, such development would likely be accompanied by downside breakouts in Yen crosses.
In Europe, at the time of writing, FTSE is down -1.89%. DAX is down -2.92%. CAC is down -2.73%. Germany 10-year yield is down -0.0464 at -0.323. Earlier in Asia, Japan and China were on holiday. Hong Kong HSI dropped -3.30%. Singapore Strait Times dropped -0.96%.
ECB Schnabel: Asset purchases will remain crucial in the time to come
ECB Executive Board member Isabel Schnabel said in a speech, "asset purchases were an "indispensable monetary policy instrument during times of market stress and economic downturns". It also helped to "bolster confidence and shore up the economy and the inflation outlook" after calming the markets.
"As economic conditions begin to normalise and the inflation outlook improves," she said, "there is a gradual shift in the way asset purchases benefit the economy as the portfolio rebalancing channel makes way for the signalling channel."
"Asset purchases can increasingly serve as a powerful commitment device, reinforcing forward guidance and reducing uncertainty around the future course of monetary policy."
She concluded, "given the remaining uncertainty regarding the pandemic and the economic and inflation outlook, our asset purchases – both under the PEPP and the APP – will remain crucial in the time to come, paving the way out of the pandemic and towards reaching our inflation target."
CAD/JPY to retest key support zone at 88.5/6 with downside acceleration
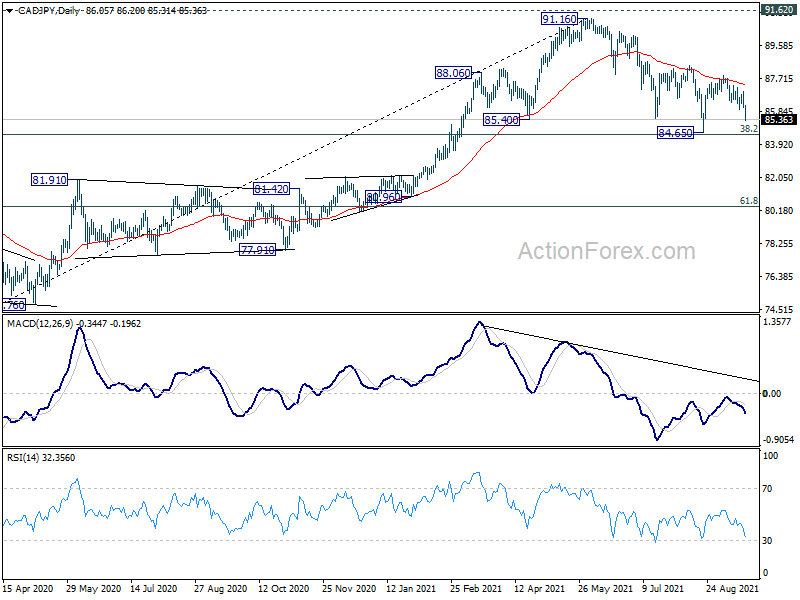
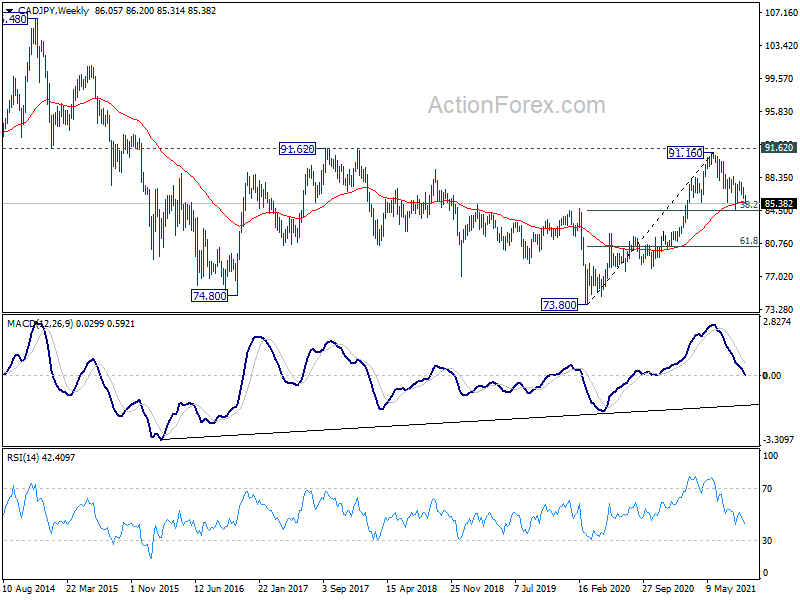
CAD/JPY follows other Yen crosses lower today, with downside acceleration. Near term outlook is kept bearish by prior rejection from 55 day EMA. The fall from 91.16 is probably ready to resume through an important support zone.
The cluster support level include 84.65, 55 day EMA (now at 85.46) and 38.2% retracement of 7380 to 91.16 at 84.52. Sustained break of this level will confirm both the completion of rise from 73.80 and rejection by 91.62 key resistance. In this case, deeper fall would be seen to 61.8% retracement at 80.43.
GBP/JPY Mid-Day Outlook
Daily Pivots: (S1) 150.65; (P) 151.29; (R1) 151.61; More...
GBP/JPY's decline accelerates today and intraday bias stays on the downside for 148.43/149.16 key support zone. Decisive break there will resume whole fall from 156.05 to 143.78 fibonacci level. On the upside, above 150.80 minor resistance will turn intraday bias neutral first.
In the bigger picture, rise from 123.94 is seen as the third leg of the pattern from 122.75 (2016 low). As long as 149.03 support holds, such rise would still resume at a later stage. However, sustained break of 149.03 support will indicate rejection by 156.59. Fall from 156.05 would be at least correcting the whole rise from 123.94. Deeper fall would be seen back 38.2% retracement of 123.94 to 156.05 at 143.78 first.
Economic Indicators Update
| GMT | Ccy | Events | Actual | Forecast | Previous | Revised |
|---|---|---|---|---|---|---|
| 23:01 | GBP | Rightmove House Price Index M/M Sep | 0.30% | -0.30% | ||
| 06:00 | EUR | Germany PPI M/M Aug | 1.50% | 0.80% | 1.90% | |
| 06:00 | EUR | Germany PPI Y/Y Aug | 12.00% | 9.20% | 10.40% | |
| 14:00 | USD | NAHB Housing Market Index Sep | 75 | 75 |
USD/CHF Elliott Wave Analysis – Seems Bullish above 0.9240
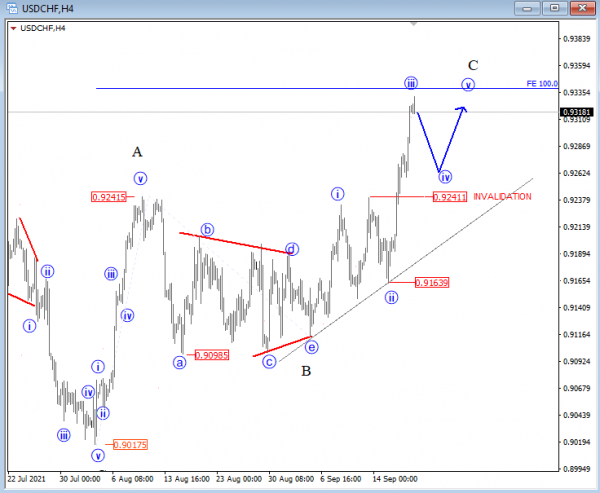
USDCHF is breaking sharply higher after it found a support at 0.9163, the second higher swing low that makes a rising trendline connected from end of wave B.
As such, we are observing now motive structure for wave C which can be in play for even higher prices as wave C should be made by five subwaves, so be aware of more upside after set-back, while pair is above 0.9240.
USD/CHF 4h Elliott Wave analysis chart
Oil Was Put On Hold
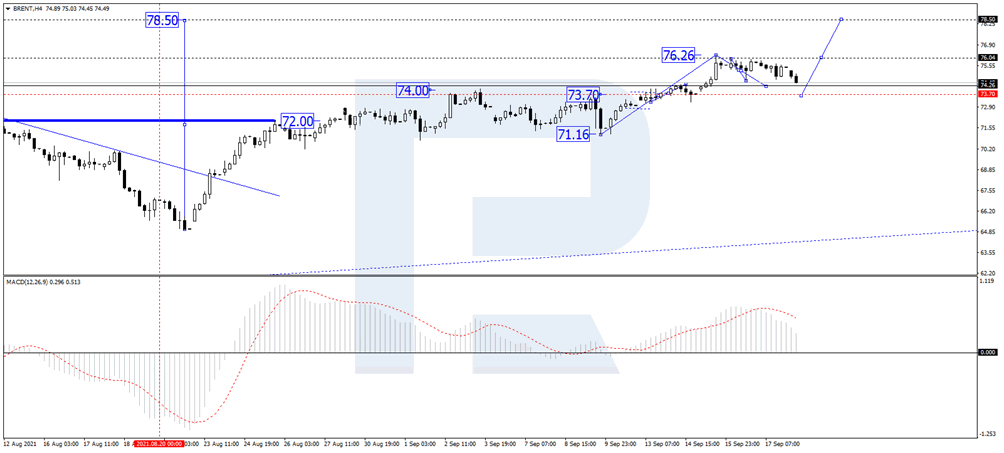
The oil price is falling after rallying before. Early in another September week, Brent is trading at $74.50 and has a lot of room to correct.
The strong “greenback” prevents investors from buying, although the asset is looking too expensive even without this driver.
On top of that, the Oil Rig Count in the USA continues growing: it added 10 units over the week and now equals 411. After the Ida storm that raged in the Gulf of Mexico early in September, the majority of rigs are back to normal operation.
In the H4 chart, after forming another consolidation range around 74.00 and breaking it to the upside, Brent has reached the next upside target at 76.20; right now, it is correcting towards 74.30. Later, the market may form one more ascending structure to break 76.00 and then continue growing with the short-term target at 77.70. On the other hand, if the price rebounds from 76.00 and falls to break 73.30, the instrument may continue the correction towards 72.00. After that, the asset may resume trading upwards to reach the above-mentioned target. From the technical point of view, this scenario is confirmed by MACD
Oscillator: its signal line is falling towards 0. Possibly, the line may rebound to the upside and resume moving upwards to reach new highs.
 As we can see in the H1 chart, after completing the ascending wave at 76.09, Brent is correcting in the form of a Flag pattern towards 74.33. Possibly, the asset may break this correctional channel to the upside to reach 76.00 and then consolidate around this level. If later the price breaks this range to the downside, the market may continue the correction towards 73.30; if to the upside – resume trading within the uptrend with the target at 77.70. From the technical point of view, this idea is confirmed by the Stochastic Oscillator: After rebounding from 20, its signal line is moving to break 50 and continue growing to reach 80.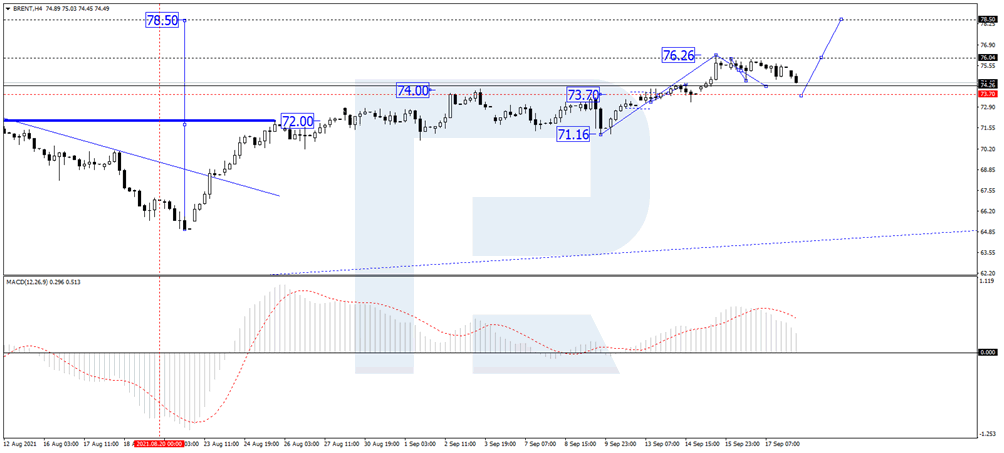
ECB Schnabel: Asset purchases will remain crucial in the time to come
ECB Executive Board member Isabel Schnabel said in a speech, "asset purchases were an "indispensable monetary policy instrument during times of market stress and economic downturns". It also helped to "bolster confidence and shore up the economy and the inflation outlook" after calming the markets.
"As economic conditions begin to normalise and the inflation outlook improves," she said, "there is a gradual shift in the way asset purchases benefit the economy as the portfolio rebalancing channel makes way for the signalling channel."
"Asset purchases can increasingly serve as a powerful commitment device, reinforcing forward guidance and reducing uncertainty around the future course of monetary policy."
She concluded, "given the remaining uncertainty regarding the pandemic and the economic and inflation outlook, our asset purchases – both under the PEPP and the APP – will remain crucial in the time to come, paving the way out of the pandemic and towards reaching our inflation target."
GBP/USD Outlook: Risk Aversion Keeps Pound Under Pressure But Bears Face Headwinds
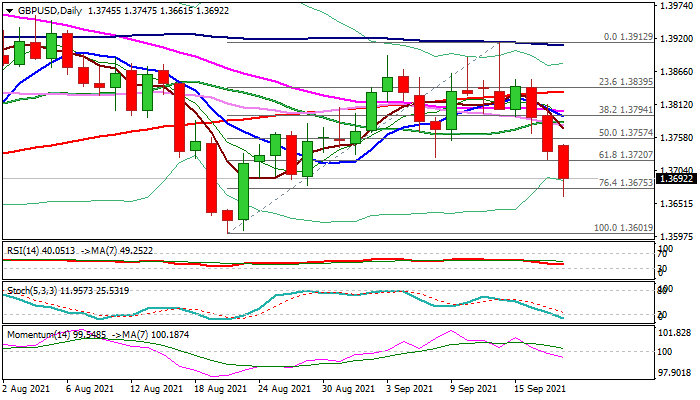
Cable extends a steep fall into third straight day and hit a four-week low (1.3661) on Monday. Strong risk aversion in the market lifts the dollar and depresses stocks, keeping the pound under increased pressure.
Bears extended below 1.3700 handle but faced headwinds on approach to pivotal Fibo support at 1.3647 (38.2% of 1.2675/1.4249 ascend) and also from rising thick weekly cloud (cloud top lays at 1.3698).
Daily techs in full bearish configuration support the action but oversold stochastic suggests that bears may take a breather before firmly breaking through 1.3698/1.3647 pivots.
Broken daily Kijun-sen (1.3757) marks solid resistance which should limit upticks and keep bears in play for attack at 1.3601 (Aug 20 low) and 1.3571 (July 20 low).
Res: 1.3723, 1.3747, 1.3757, 1.3787.
Sup: 1.3661, 1.3647, 1.3601, 1.3571.
CAD/JPY to retest key support zone at 88.5/6 with downside acceleration
CAD/JPY follows other Yen crosses lower today, with downside acceleration. Near term outlook is kept bearish by prior rejection from 55 day EMA. The fall from 91.16 is probably ready to resume through an important support zone.
The cluster support level include 84.65, 55 day EMA (now at 85.46) and 38.2% retracement of 7380 to 91.16 at 84.52. Sustained break of this level will confirm both the completion of rise from 73.80 and rejection by 91.62 key resistance. In this case, deeper fall would be seen to 61.8% retracement at 80.43.
Aussie Dips On Commodities, Evergrande
The Australian dollar has continued its downward swing as we start the new trading week. Currently, AUD/USD is trading at 0.7234, down 0.39% on the day. The currency has now fallen over 1% in each of the past two weeks, and the negative trend could well continue this week.
Risk aversion sends Aussie lower
The Aussie is marked by a high correlation with risk sentiment and commodity prices, and both factors are weighing on the currency in the Monday session. Commodities such as copper and platinum are down significantly after Chinese Prime Minister Li said that China would implement “market tools” in order to keep commodity prices stable. Ordinarily, such a statement would not have such a strong impact on commodities, but thin liquidity due to a China holiday has resulted in a distorted move.
The financial markets are also alarmed over the crisis surrounding Evergrande, as there are fears that the Chinese property giant could default, which has led to the company’s shares falling to an 11-year low. This has led to a loss in risk appetite which is weighing on the Australian dollar.
Aside from these developments, the US dollar is gaining ground ahead of the FOMC meeting on Wednesday. The markets are once again primed for a signal from the Fed on tapering. We’re unlikely to see the Fed announce a taper, but if the policy makers hint that the November meeting will be live. The dot-plot will also be closely monitored – if the Fed brings forward rate hike expections, the US dollar could bulldoze upwards.
With the US releasing only minor indicators ahead of the Wednesday FOMC meeting, the US dollar could have a quiet start to the week, unless there are some headline-grabbing statements from Fed members about tapering which shake up the markets.
AUD/USD Technical
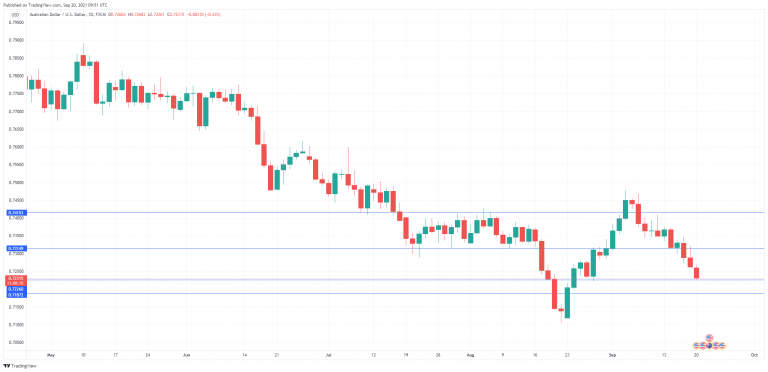
- There is resistance at 0.7433, followed by 0.7512
- On the downside, the pair is testing support at 0.7226 is fluid. Below, there is support at 0.7187
Gold Price Attempting A Recovery From The $1,742 Low
Gold price started a fresh decline from well above the $1,800 zone against the US Dollar. The price broke the $1,780 support level to move into a bearish zone.
The bears were able to push the price below the $1,750 level and the 50 hourly simple moving average. A low is formed near $1,742 and the price is now attempting a recovery.
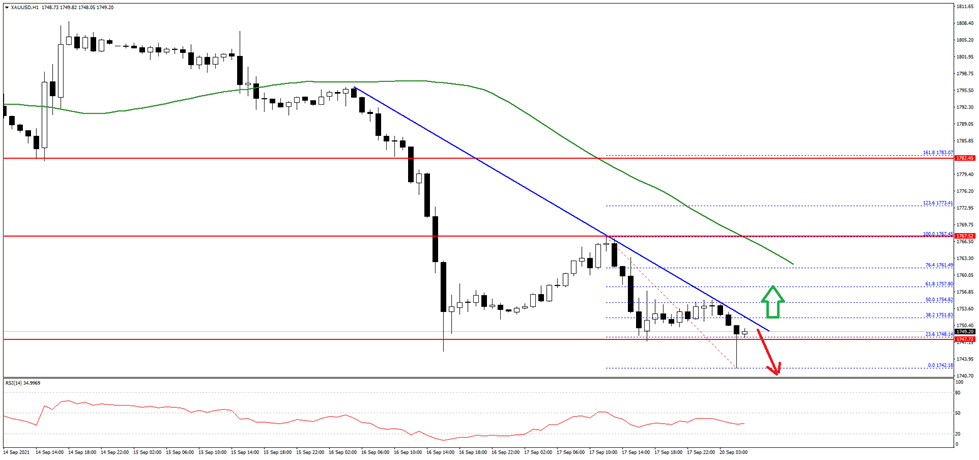
On the upside, an immediate resistance is near the $1,750 level. There is also a bearish trend line forming with resistance near $1,750 on the hourly chart. A clear break above the $1,750 resistance could push the price further higher. The next main resistance could be $1,775 on FXOpen.
On the downside, there is a decent support forming near the $1,742 level. The main support could be $1,740, below which the price could revisit $1,730. Any more losses could lead the price to $1,720.