Sample Category Title
Elliott Wave View: EURJPY Rally Expected To Fail
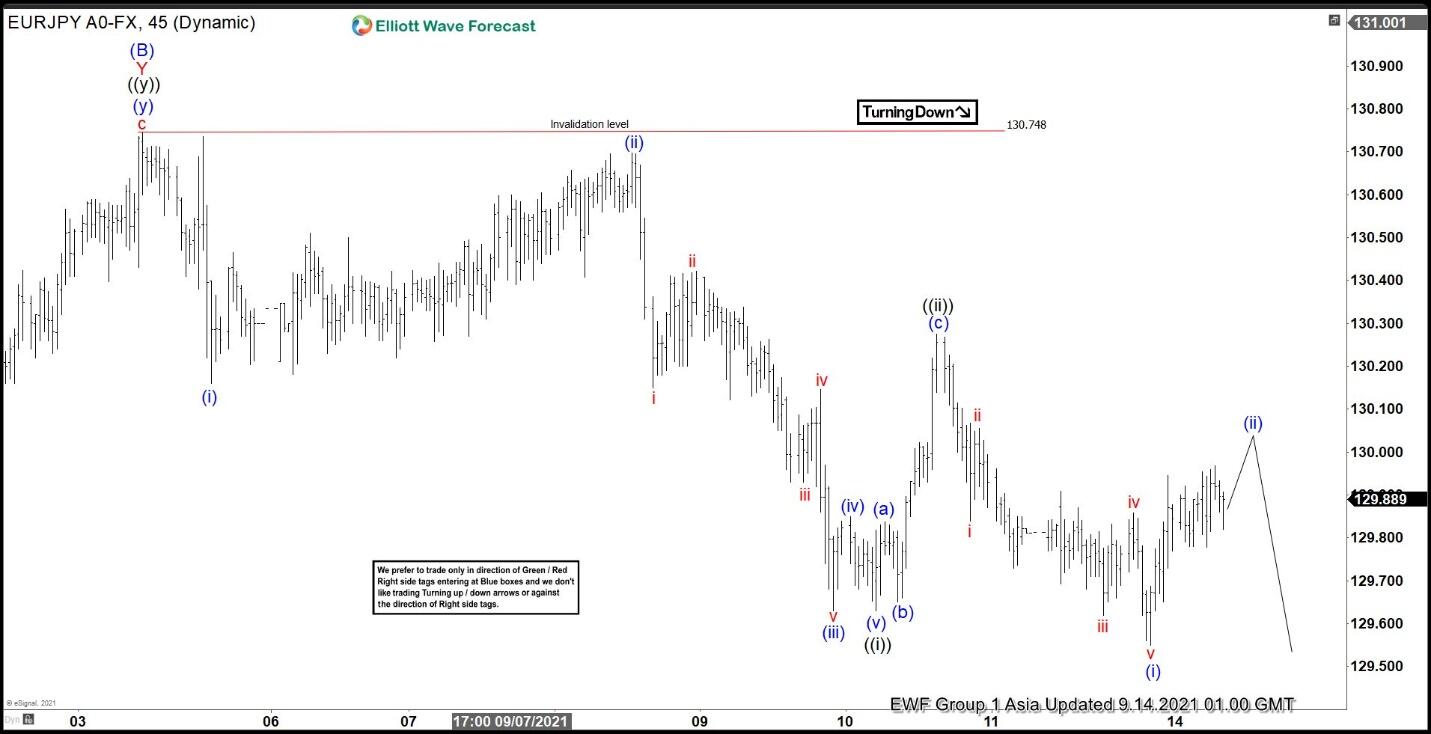
Short-term Elliott wave view in EURJPY suggests rally to 130.75 ended wave (B). Pair has turned lower in wave (C) but it still needs to break the previous wave (A) low at 127.9 on August 19 to rule out a double correction. Down from wave (B), decline is in progress as a 5 waves impulsive structure. First leg wave (i) ended at 130.16, and rally in wave (ii) ended at 130.698.
Pair resumes lower in wave (iii) towards 129.63, rally in wave (iv) ended at 129.85, and final leg lower wave (v) ended at 129.63. This completed wave ((i)) in higher degree. Correction in wave ((ii)) then ended at 130.27 as a zigzag structure. Pair has resumed lower in wave ((iii)). Down from wave ((ii)), wave (i) ended at 129.55 and wave (ii) correction is in progress. While rally fails below wave ((ii)) high at 130.27, and more importantly below 130.75, expect pair to extend lower. Another possible alternate is that pair ended wave ((i)) at the recent 129.55 low. In the alternate scenario, current rally is in wave ((ii)) which could see larger 3 waves but still expected to fail below 130.75 for more downside. Near term, as far as pivot at 130.75 high stays intact, expect rally to fail in 3, 7, or 11 swing for further downside.
EURJPY 45 Minutes Elliott Wave Chart
Market Morning Briefing: Aussie Holds Well Below 0.74
STOCKS
Most equity indices are recovering after a sharp fall seen over the last few sessions. Dow and Dax have come up and can rise further towards 35000-35500 and 15800 respectively while Nikkei and Shangai are headed towards 30500 and 3800. Nifty and Sensex closed in the red yesterday but may rise today in line with strength seen in other equity indices globally.
Dow (34869.63, +261.91, +0.76%) broke below 34750 to test 34665 before bouncing back sharply from there. If the bounce sustains, we may again expect a break above 35000 and an eventual rise towards 35500 or even higher.
DAX (15701.42, +91.61, +0.59%) has held above support near 15600 and a rise to 15800 again looks possible.
Nikkei (30562.42, 115.05, +0.38%) has surged sharply and while above 30500, a rise to 30700 looks possible before a corrective fall towards 29500-29000 is seen.
Shanghai (3719.45, +4.08, +0.11%) has broken above 3700 finally and looks bullish for a rise towards 3800 soon.
Nifty (17355.30, -13.95, -0.08%) has been consolidating between 17250-17500 for some days now and can continue so for some more time before we see a break on either side to decode on further direction from here.
Sensex (58177.76, -127.31, -0.22%) has also been consolidating between 58000-59000. Within the range, sensex has come down to test the lower end of the mentioned range. A bounce back from here towards 59000 levels is possible..
COMMODITIES
Brent and WTI have risen and can test the level of $74/75 and $72/73 in the coming sessions. Gold and Silver are sustaining above the supports at 1780 and 23.50 respectively which can take them further towards 1800/1820 and 24/24.50.Resistance at 4.40 in Copper has held well and copper can now come down to test the level of 4.20 in the coming sessions.
Brent (73.82) continues to hold above immediate trend support at 71-73 mentioned yesterday and while that holds, price is bullish for a test of 74-75 or even 76-78 on the upside before a fall from there is seen.
WTI (70.79) has risen too and could target 72 before falling off from there. Support is seen near 68 for the near term.
Gold (1792.40) is holding above the support at 1780.While above 1780, a bounce back to 1800 and 1820 eventually is possible in the coming sessions. A strong break below 1870 on the flipside can take Gold down towards 1765/40.Watch price action near current levels.
Silver (23.71) is broadly consolidating between the range of 23.50-25.Within the range a bounce towards 24 and eventually 25 is possible.
Copper (4.3770) has room to come down towards 4.20.The resistance at 4.40 has held very well and can send the price down.
FOREX
Most currency pairs are fluctuating within narrow ranges and unable to find a clear trend just now as most pairs seem to be trading within a sideways range. Dollar Index trades within 92.30-92.85 while Euro needs to sustain above 1.1770 to slowly head higher but unless a break above 1.1850-1.19 is seen, it is difficult to turn bullish. Aussie and pound are stable and ranged for now. EURJPY is rising but needs to break above 130.50 to rise further. USDCNY faces pressure from 6.48/47/4650 and while that holds, the pair may fall. USDINR can have scope for a rise above 73.80 to test 74 before coming off from there else a range of 73.40/50-73.80 may hold for the next few sessions.
Dollar Index (92.577) fell from 92.85 indicating a very near term range of 92.30-92.85 which needs to break on either side to give more clarity on further directions.
Euro (1.1818) tested 1.1770 yesterday as expected butt bounced back sharply to above 1.18. A sustained rise above 1.1850 is needed for Euro to turn bullish for the near term.
EURJPY (130.05) is bouncing well from levels above 129.50 and while that holds, we expect a rise to 130.50-130.75 in the next few sessions. Thereafter if the pair breaks to the upside to test 131-132 is to be watched closely.
Dollar-Yen (110.05) is holding above 109.60 and could continue to trade within 110.4-109.60 before a bounce to the upside is seen in the medium term.
Aussie (0.7370) holds well below 0.74 and is likely to trade within 0.7450-0.7350 in the very near term. A break below 0.7350, if seen can take the price lower towards 0.73 or even 0.7250-0.72in the medium term before a sharp bounce is seen. Watch price action near 0.7350 for now.
Pound (1.3847) is holding below 1.39 and while that holds, a fall to 1.3750-1.37 is possible. Overall broad range of 1.39-1.37 may hold for the next 1-2 weeks.
USDCNY (6.4485) tested 6.4571 before coming off from there. Resistance near 6.4650/47 seems to be putting downward pressure on the pair as the pair falls off from the mentioned levels. A range of 6.47/4650-6.43.00 may hold for the near term.
USDINR (73.6750) fell yesterday after testing 73.7325. There is scope for a test of 73.80 which if breaks can take the pair towards 74 before a fresh fall from there is seen. Else a range of 73.40/50-73.80 may hold for the near term.
INTEREST RATES
The US Treasury yields continue to trade stable. We retain our view of seeing a rise in the coming days while the yields remain above their near-term supports. The US CPI data release today will need a close watch to see if it can push the yields higher from here. The Treasury yields will have to fall decisively below their supports to come under pressure for a fresh fall. The German yields sustain higher and have room to move up further from here before reversing lower again. The 10Yr and 5Yr GoI have risen back yesterday. However, key resistances are ahead which will have to be broken in order to negate the fall that we have been expecting and move up further.
The US 2Yr (0.21%), 5Yr (0.81%), 10Yr (1.33%) and the 30Yr (1.91%) Treasury yields remain stable. Our view remains the same. The 10Yr can test 1.45%-1.5% while above 1.3% and the 30Yr can rise to 2.1% and higher while above 1.8% and on a rise past 2%. Also from a bigger picture the 10Yr has room to test even 1.7% on the upside while above 1.2%-1.18%. A strong break below 1.18% (10Yr) and 1.8% (30Yr) is necessarily needed to negate the rally and bring the yields under pressure for a fresh fall.
The German 2Yr (-0.72), 5Yr (-0.64%), 10Yr (-0.33%) and 30Yr (0.16%) yields remain stable at higher levels. There is room for the current corrective rally to test -0.30%/-0.25% (10Yr) and 0.20% (30Yr) on the upside. The price action thereafter will need a close watch for a reversal and the resumption of the broader downtrend.
The Indian 10Yr GoI (6.1920%)has risen back yesterday. A break above 6.2% will pave way for a further rise to 6.22%-6.24% and in turn will negate our view of seeing 6.1% and lower levels.
The 5Yr GoI (5.6268%) has come-off after testing the resistance at 5.64%. The range of trade is likely to be 5.6%-5.64% in the near-term. A breakout on either side of this range will then determine whether the yield can rise to 5.66%-5.68% or fall to 5.55%-5.5%.
GBP/USD Remains Supported But Faces Major Hurdle
Key Highlights
- GBP/USD started a fresh increase above the 1.3800 resistance.
- It broke a key bearish trend line with resistance near 1.3800 on the 4-hours chart.
- EUR/USD is struggling to stay above the key 1.1780 support zone.
- The US CPI could increase 5.2% in August 2021 (YoY), down from 5.4%.
GBP/USD Technical Analysis
The Euro started a fresh increase from the 1.3725 zone against the US Dollar. GBP/USD broke the 1.3800 resistance to move into a positive zone.
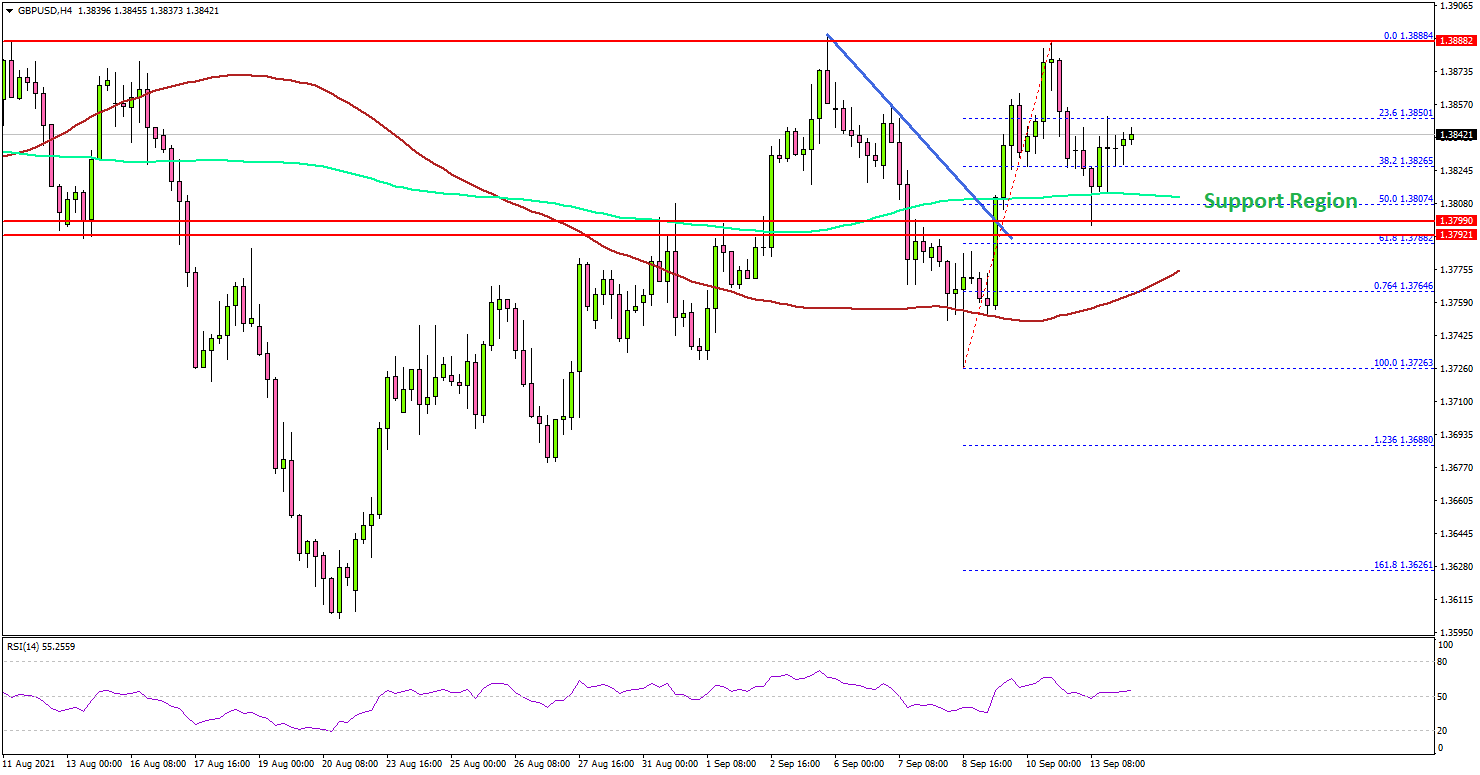
Looking at the 4-hours chart, the pair also surpassed a key bearish trend line with resistance near 1.3800. It settled above the 1.3800 level, the 200 simple moving average (green, 4-hours), and the 100 simple moving average (red, 4-hours).
However, the bulls struggled to clear the main 1.3880 resistance zone. A high was formed near 1.3888 before there was a downside correction. There was a break below the 1.3850 and 1.3825 support levels.
The pair even tested the 50% Fib retracement level of the upward move from the 1.3726 swing low to 1.3888 high. On the upside, an initial resistance is near the 1.3865 level. The first major resistance is near the 1.3880 level, above which GBP/USD might rise towards the 1.4000 level.
On the downside, there is a major support forming near the 1.3800 zone. The next major support is near the 1.3765 level and the 100 simple moving average (red, 4-hours). Any more losses might push the pair towards the 1.3725 support zone in the near term.
Looking at EUR/USD, the pair extended its decline below 1.1800, but the bulls are still fighting near the key 1.1780 level.
Economic Releases
- UK Claimant Count Change for August 2021 – Forecast -71.7K, versus -7.8K previous.
- UK ILO Unemployment Rate for July 2021 (3M) – Forecast 4.6%, versus 4.7% previous.
- US CPI for August 2021 (MoM) – Forecast +0.4%, versus +0.5% previous.
- US CPI for August 2021 (YoY) – Forecast +5.2%, versus +5.4% previous.
- US CPI Ex Food & Energy for August 2021 (YoY) – Forecast +4.2%, versus +4.3% previous.
Eco Data 9/14/21
[php_everywhere instance="1"]
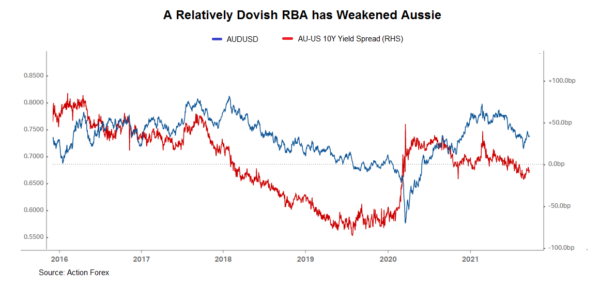
Aussie’s Weakness Exacerbated by Dovish RBA and Slump in Iron Ore Price
Concerns over inflation, slower economic growth and normalization of monetary stimulus have hurt market sentiment, pressuring commodity currencies over the past week. Among G10 commodity currencies, Australian dollar performed the worst as it was additionally hammered by a dovish RBA and the selloff of iron ore price.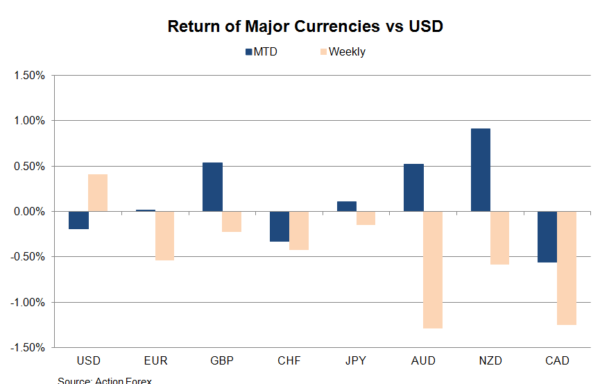
Dovish RBA under Global Normalization Theme
The RBA adopted dovish tapering in September. While going ahead with asset purchases of AUD 4B/ week (down from AUD 5B/ week previously), policymakers noted that they would continue “until at least mid February 2022”, compared with the previous guidance of November 2021. They also cautioned that the delta variant would “material decline” in 3Q21 GDP and slower subsequent growth rebound. The stance compared with the ECB (also held meeting last week) which upgraded both growth and inflation forecasts. The members also for the first time acknowledged inflation pressures could be more persistent than previously anticipated. In mid-August, the RBNZ, while leaving all monetary policy tools unchanged, reiterated that the“least regrets policy stance” is to “further reduce the level of monetary stimulus”. As the market awaits the FOMC meeting next week, the consensus is that the tapering process would begin later this year. RBA’s cautious tone has helped weaken its currency as its counterparts are turning less dovish.
Slump in Iron Ore Price
The selloff of iron ore price is another key reason pressuring Aussie. The iron ore price has tumbled almost -40% from July’s peak. Back in May, China, the major of Australia’s iron ore, threatened to “punish” Australia by increasing iron ore imports from Brazil. Over the past month, China has reportedly planned to curb crude steel production so as to reduce emissions. This is prone to restrict its demand for iron ore. If the country really sticks to the target of limiting steel production to 2020 level, it would mean a nearly -12% decline in output from August to December.
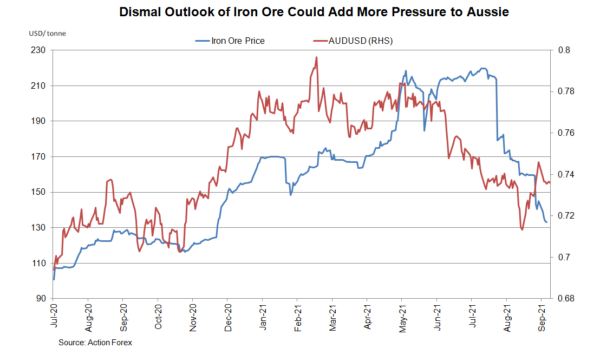
The latest report revealed that China’s iron ore imports increased +10.2% to 97.49M tones in August. This marks the first month-over-month rise since March. Yet, the volume remained -2.86% less than the same period last year. In the first 8 months of the year, iron ore imports were down -1.7% y/y to 746M tonnes. The outlook of China’s iron ore demand remains dismal. Besides China’s retaliatory act and environmental concerns, a slowing Chinese growth outlook has weighed on the real estate sector. This also reduces demand for steel, hence its major component, iron ore. Aussie could continue to tread water if iron ore price remains under pressure.
September Flashlight for the FOMC Blackout Period
Summary
- The Federal Reserve is currently purchasing $80 billion worth of Treasury securities and $40 billion worth of MBS every month, and many market participants look for the FOMC to commence a "tapering" of its asset purchases in the near future.
- In our view, the disappointing labor market report for August and the uncertainties imparted by the recent surge in COVID cases on the economic outlook mean that an announcement of tapering at the upcoming meeting is quite unlikely.
- However, it is important not to miss the forest for the trees. Progress continues to be made toward the Committee's goal of "maximum" employment. Unless the economic recovery is completely derailed over the next few months, we believe a taper announcement will be forthcoming at either the November or the December FOMC meetings.
- The Committee could potentially use its statement to signal the timing of tapering commencement. For example, changing the first sentence of the statement and/or characterizing the risks to the economic outlook as more "balanced" could signal that the FOMC believes that tapering is imminent.
- That said, we believe that the Committee will refrain from making substantive changes to the wording that it uses in the September 22 statement.
- Will the "dot plot," which shows the expected pace of rate hike among the 18 Committee members, shift? A downgrade to GDP growth forecasts could cause some dots to shift lower. But forecasts of lingering inflation next year may lead some members to conclude that the pace of tightening that they expected three months ago is still warranted.
Crunch Time: November and December FOMC Meetings Likely To Be "Live"
The Federal Open Market Committee (FOMC) will hold a highly anticipated meeting on September 21-22. We describe the meeting as "highly anticipated" because the issue of the Fed tapering its asset purchases is very much on the minds of most market participants. To recap, the Federal Reserve bought significant amounts of U.S. Treasury securities and mortgage-backed securities (MBS) when the pandemic essentially shut down the economy in the spring of 2020. Last December, the Committee said that the Fed would continue to buy Treasury securities and MBS at monthly rates of $80 billion and $40 billion, respectively, until "substantial further progress has been made toward the Committee’s maximum employment and price stability goals."
The statement that was released following the most recent FOMC meeting on July 28 indicated that the economy had "made progress" toward meeting these goals. Left unsaid was that evidently this progress was not quite "substantial" enough to warrant tapering of asset purchases. Consequently, it seems that commencement of tapering is drawing nearer. The question is when?
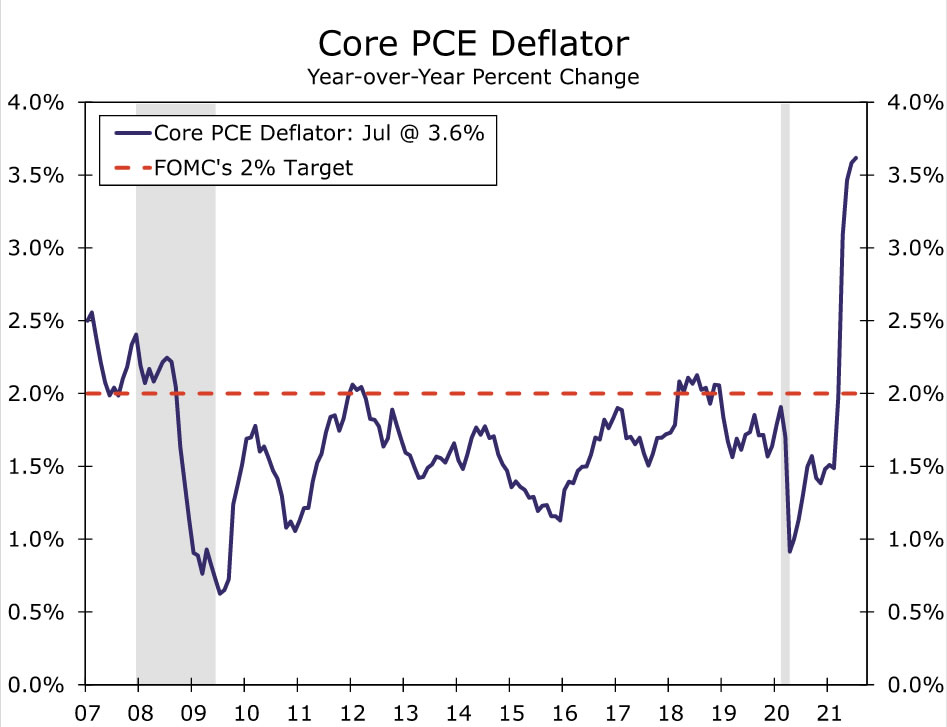
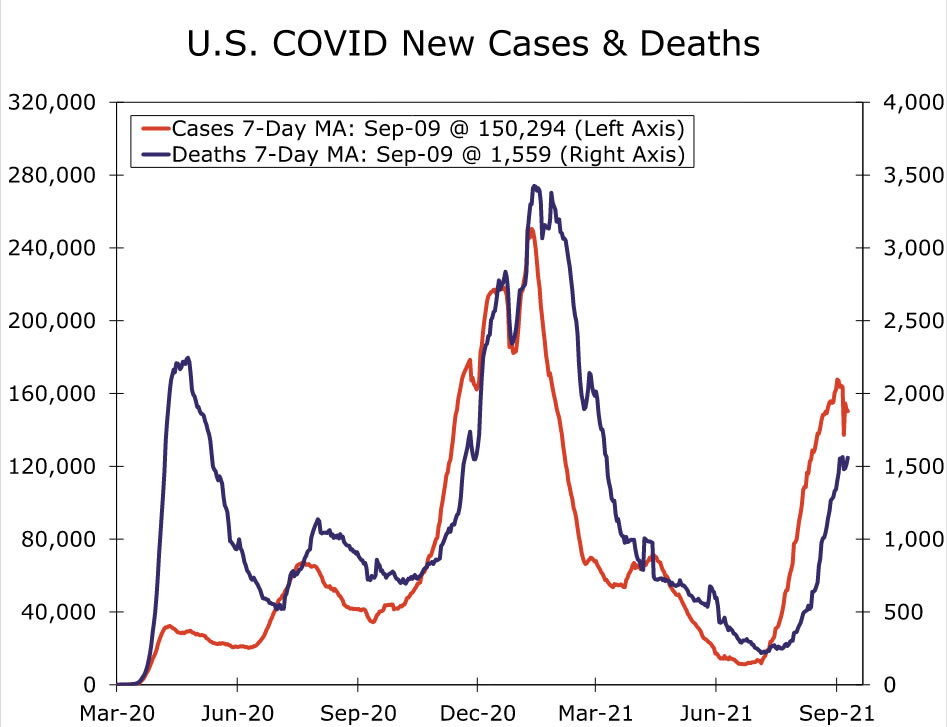
With inflation still running well above the FOMC's 2% target, most Fed officials, including Chair Powell, have signaled that they believe the inflation half of "substantial further progress" has been met (Figure 1). This indicates that the labor market data will be critical to a taper announcement at either the November 2-3 or December 14-15 FOMC meetings. Since the July 28 FOMC meeting, the pace of the economic recovery has slowed amid the rapid ascent of new COVID cases (Figure 2). High frequency data and consumer confidence surveys softened in August, while nonfarm payrolls grew just 235,000 in August, the smallest increase since January. We suspect the additional "hard data" for August will be similarly weak when it is released later this month.
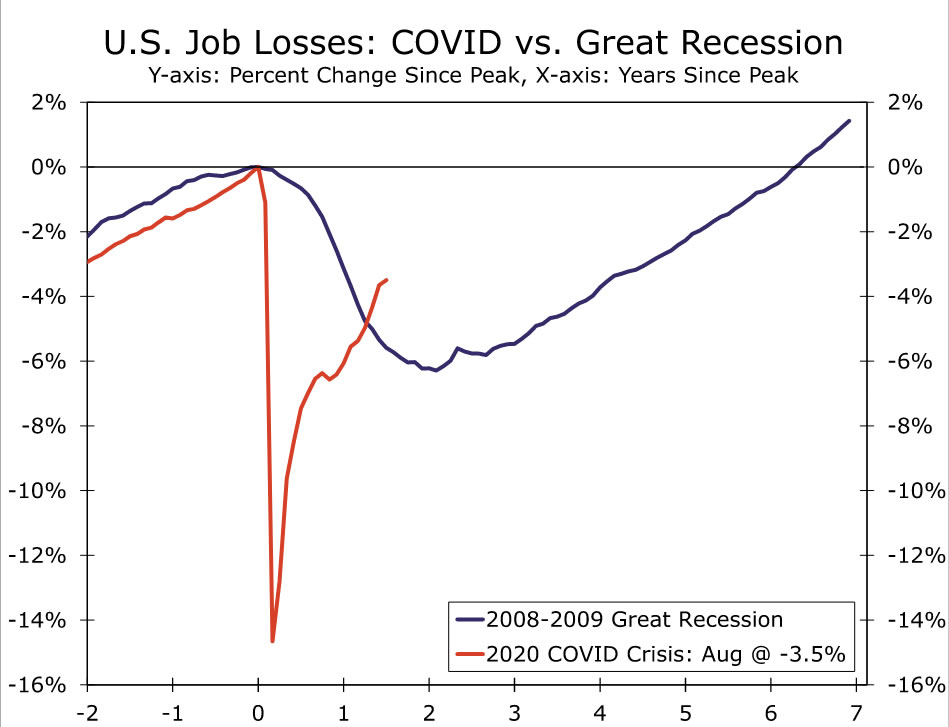
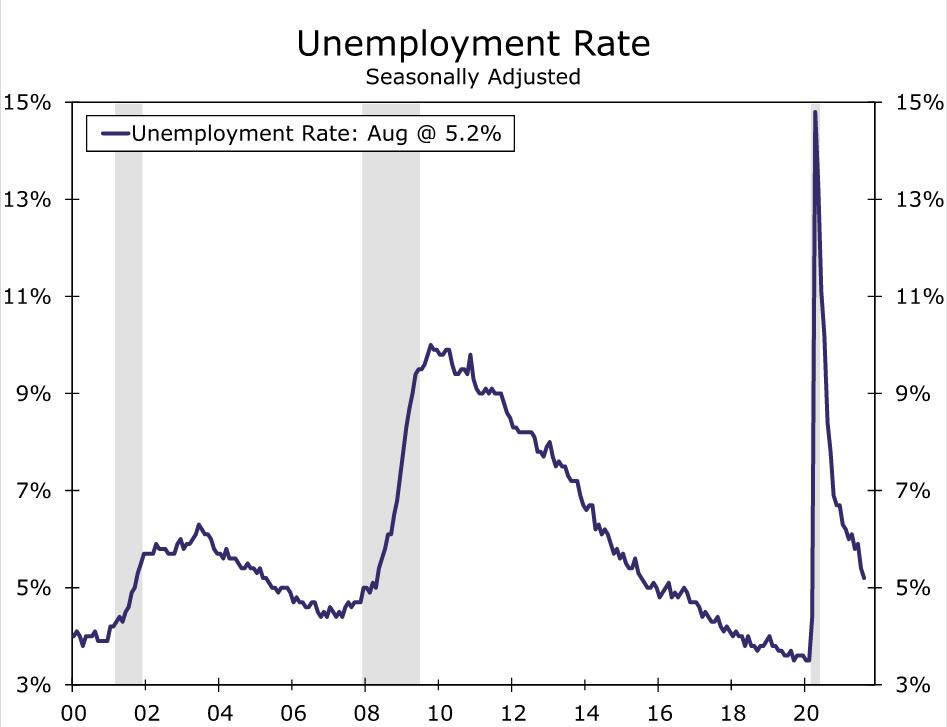
At first blush, this might suggest that the FOMC has taken a step backwards when it comes to tapering. Although we readily acknowledge that an announcement of tapering commencement at the September 22 meeting is quite unlikely, we would argue that November or December are still very much "in play." The pace of progress may have slowed, but progress did continue as employment rose by 235,000 in August plus another 134,000 in upward revisions to the previous two months. Progress is cumulative, and employment continues to rebound much faster in this recovery than it did following the downturn in 2007-2009 (Figure 3). The unemployment rate has also fallen 0.7 points since the FOMC's July meeting (Figure 4).
Furthermore, the Committee may view August as a useful model for how the economy will perform in additional post-vaccine COVID waves. It is encouraging to us that the economy continued to expand despite COVID cases that are at levels not seen since February, and this continued expansion may ease some concern among Fed officials as they look ahead to the winter.
That said, we believe the FOMC will be keenly watching the September employment report as it will be the last one the Committee sees before the November 2-3 meeting. The August miss is not the end-all-be-all for a November announcement if employment bounces back in September. The monthly job numbers have been very volatile throughout the re-opening process, and it is quite possible August's miss will be revised higher and/or offset by a stronger number in September. A potential peak in COVID cases, school re-openings and the end of enhanced unemployment benefits all point towards a rebound in job growth in September.
Just how strong of a September employment report will be needed to bring about a November tapering announcement is difficult to say. Many factors beyond the headline number determine whether a report is "good" or "bad". However, our sense is that a print of around 700K jobs or more would probably be enough to get the FOMC to announce a taper on November 3. Job growth around 700K would bring the combined rise in payrolls over August and September to around one million, and it would mean that the labor market has recovered just about 80% of the jobs lost at the beginning of the pandemic.
There is nothing magical about the 700K number. However, the further away the September employment report is from this mark in either direction, the more our conviction would likely grow regarding a November versus a December announcement. If the report comes in north of one million jobs with robust labor force and wage growth, it should be all-systems-go in November unless something else on the public health or economic front shows major deterioration. Conversely, if the September employment report shows another reading of just a few hundred thousand jobs, we suspect the FOMC will postpone a tapering announcement in November and wait until December to determine whether commencement is warranted. Although the two meetings are just six weeks apart, the timing of the October and November employment reports are such that the FOMC will have received two new employment readings between November 3 and December 15. Some Committee members have signaled the importance of seeing the autumn economic data, and a weak September employment reading may nudge them towards a bit more caution.
Although the exact timing of the taper announcement is relevant, we believe it is important to not miss the forest for the trees. Unless the economic recovery is completely derailed over the next few months, we believe a taper announcement will be forthcoming at one of the two final FOMC meetings of the year. In the grand scheme of things, tapering that starts in late November versus late December is a relatively small difference, and our impression is that markets are well-prepared for either of these outcomes. We will be reviewing the September FOMC statement and Chair Powell's press conference closely for clues about the pace of tapering in addition to the timing.
During the tapering period that occurred over the course of 2014, the FOMC decided to reduce the Fed's purchases of Treasury securities and MBS generally by $5 billion per meeting. Therefore, it took the Fed almost a year to wind down its monthly purchase rate of $45 billion for the former and $40 billion for the latter between December 2013 and November 2014.
As noted previously, the Federal Reserve is currently buying $80 billion and $40 billion worth of Treasury securities and MBS respectively every month. Our current forecast assumes the FOMC will reduce its pace of asset purchases by $10 billion for the former and $5 billion for the latter at each forthcoming FOMC meeting. But we acknowledge that the pace of reduction could be used as a counterbalance to the commencement of tapering. That is, if the FOMC decides to taper its asset purchases at the November 3 meeting, then it very well may opt for the $10B/$5B pace. Alternatively, if the Committee decides to wait one more meeting, then the continued inter-meeting economic progress might permit a faster pace of tapering along the lines of $15B/$7.5B per meeting. Either way, we believe the Fed will finish up its asset purchases sometime between next summer and fall.
Statement Changes Could Signal That Tapering is Drawing Closer
The statement that will be released at the conclusion of the meeting will outline the FOMC's views about the current state of the economy, and the Committee could potentially use changes to its wording to give some clues on when tapering will commence. For example, the statement currently opens with the following sentence: "The Federal Reserve is committed to using its full range of tools to support the U.S. economy in this challenging time, thereby promoting its maximum employment and price stability goals." Indeed, this sentence has opened every statement since it was first used following the FOMC meeting on April 29, 2020. At the time, claims for unemployment insurance were spiking and economic activity was essentially in free fall. The prominent use of this sentence at the beginning of the statement signals that the Committee is willing to do everything in its power, including the purchase of Treasury securities and MBS, to support the U.S. economy. Removing this sentence entirely or moving it to a less prominent position would signal that the Committee believes that some of these tools may not be needed much longer and that tapering could potentially commence at the next FOMC meeting.
In addition, the FOMC noted in its March 2021 statement that "the path of the economy will depend significantly on the course of the virus, including progress on vaccinations. The ongoing public health crisis continues to weigh on economic activity, employment, and inflation, and poses considerable risks to the economic outlook." The Committee implicitly upgraded its outlook at the April meeting by dropping "considerable" from the last sentence and stating simply that "the ongoing public health crisis continues to weigh on the economy, and risks to the economic outlook remain." In both the June and the July statements, the Committee said "the path of the economy will depend significantly on the course of the virus. Progress on vaccinations will likely continue to reduce the effects of the public health crisis on the economy, but risks to the economic outlook remain." Softening of this risk assessment further—maybe along the lines of calling the risks "more balanced"—would indicate that the Committee is feeling more optimistic about the economic outlook and that an imminent tapering of asset purchases may be appropriate.
We readily admit that the Committee could use these changes to the statement, or potentially others, to signal that tapering is drawing closer. But in our view, the disappointing print on non-farm payrolls in August slowed the "progress" that the economy has made toward the FOMC's goal of "maximum" employment, and the recent surge in COVID cases clearly adds uncertainty to the economic outlook. In short, we believe that the Committee will refrain from making substantive changes to the wording that it uses in the September 22 statement. If economic data improves sufficiently in coming weeks, including the September labor market report that is slated for release on October 8, then Fed officials could use public comments throughout October to signal that tapering will commence in November.
Potential Changes to the Summary of Economic Projections
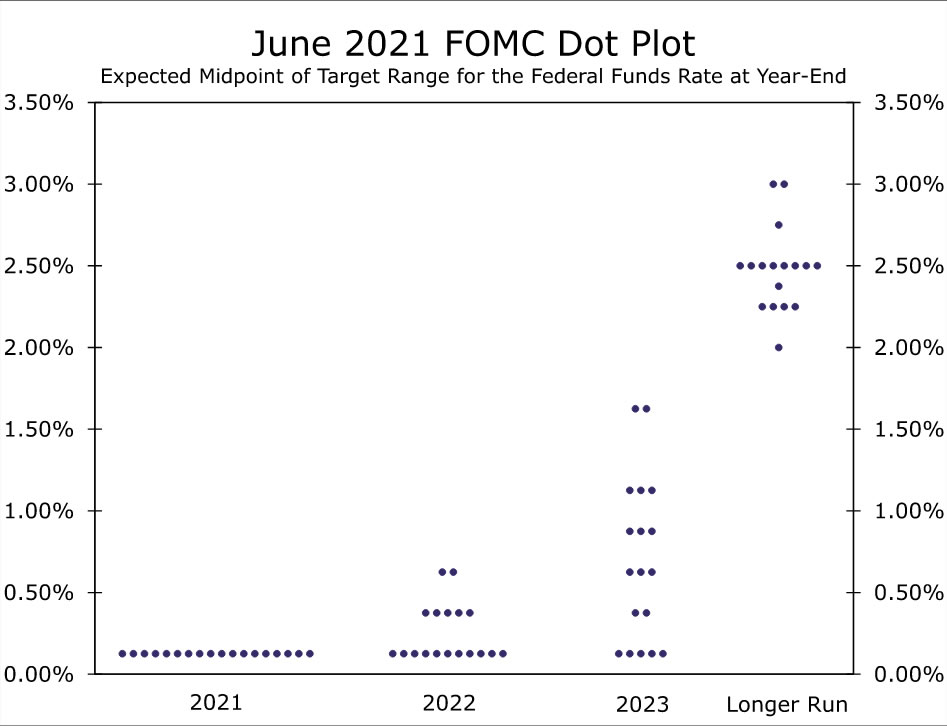
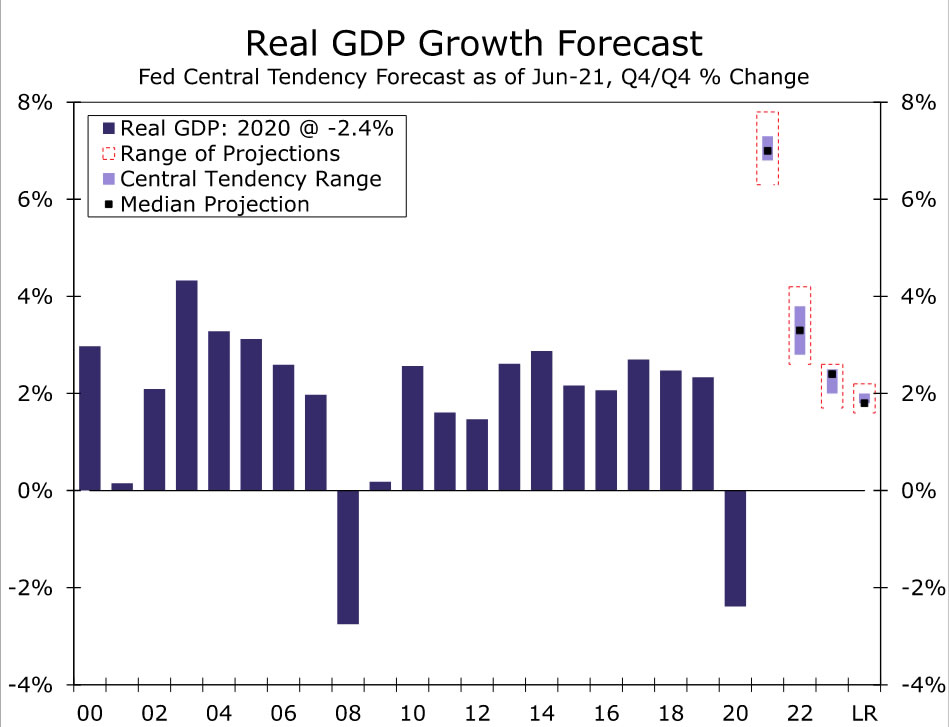
There is also the issue of rate hikes. Of course, nobody is looking for the FOMC to hike rates in the near term, let alone at this meeting. But the meeting may convey some information that should help market participants form expectations about the timing and pace of eventual monetary tightening. In that regard, the Summary of Economic Projections (SEP), which details the Committee's macroeconomic forecasts and which is provided on a quarterly basis, is scheduled to be published at the conclusion of this meeting. The "dot plot", which was released after the June 16 meeting, showed that seven of the 18 committee members thought that the target range for the federal funds rate would be higher than its current setting of 0.00% to 0.25% by the end of next year (Figure 5). Thirteen members thought the range would be higher at the end of 2023. Furthermore, the median forecast among the 18 individual projections in June saw real GDP rising 7.0% in 2021 (Q4-2021 relative to Q4-2020) followed by 3.3% in 2022 (Figure 6)
However, data on economic activity since June indicate that the economy has decelerated more quickly than many analysts had expected just three months ago. Furthermore, the downside risks to the economic outlook have risen since early summer. At the time of the last SEP in June, new COVID cases had receded considerably from their January highs and were averaging less than 15K/day, but new cases have subsequently skyrocketed. Re-imposition of restrictions that locked down the economy in spring 2020 do not seem to be likely. That said, high frequency data indicate that consumers have turned a bit more cautious recently with fewer visits to retail locations and restaurants as well as fewer airline flights.
In June, the average forecast among the Blue Chip panel of forecasters saw real GDP rising 6.7% this year and 4.4% in 2022. In August, the average for 2021 had been paired back to 6.2% (the average for 2022 remained unchanged at 4.4%). Therefore, it seems likely that FOMC officials may have made some downward revisions to their GDP growth forecasts as well. Everything else equal, expectations of slower economic growth could lead some committee members to rethink the appropriateness of hiking rates next year, leading to a downward shift in the dot plot.
But everything else may not be equal. Specifically, the median FOMC forecaster projected a 3.4% rate of PCE inflation this year and 2.1% in 2022. But the renewed spike in COVID cases has the potential to keep supply chains gummed up in coming months, which could cause inflation to recede at a slower pace than many committee members expected three months ago. In that event, the median inflation forecast could be bumped up, which could keep the dot plot from shifting lower. In short, the SEP that will be released on September 22 will convey important information about how Fed policymakers are thinking about the economic outlook and their monetary policy response.
Bullish Dataset Awaited to Bolster Pound ahead of BoE
Sterling remains the king among major currencies year-to-date thanks to its immediate vaccination landmark at the start of the year, but despite its latest rebound, buying pressures have been inadequate to drive it above the 1.3900 – 1.4000 resistance territory over the past month. With one week to go until the next Bank of England's policy meeting and investors being lost between optimism for monetary tightening and fears of slowing economic growth, this week’s data could be crucial to build some hawkishness. UK employment data will feature the calendar on Tuesday, followed by CPI inflation on Wednesday and retail sales on Friday, all due at 06:00 GMT.
What is BoE's policy guidance?
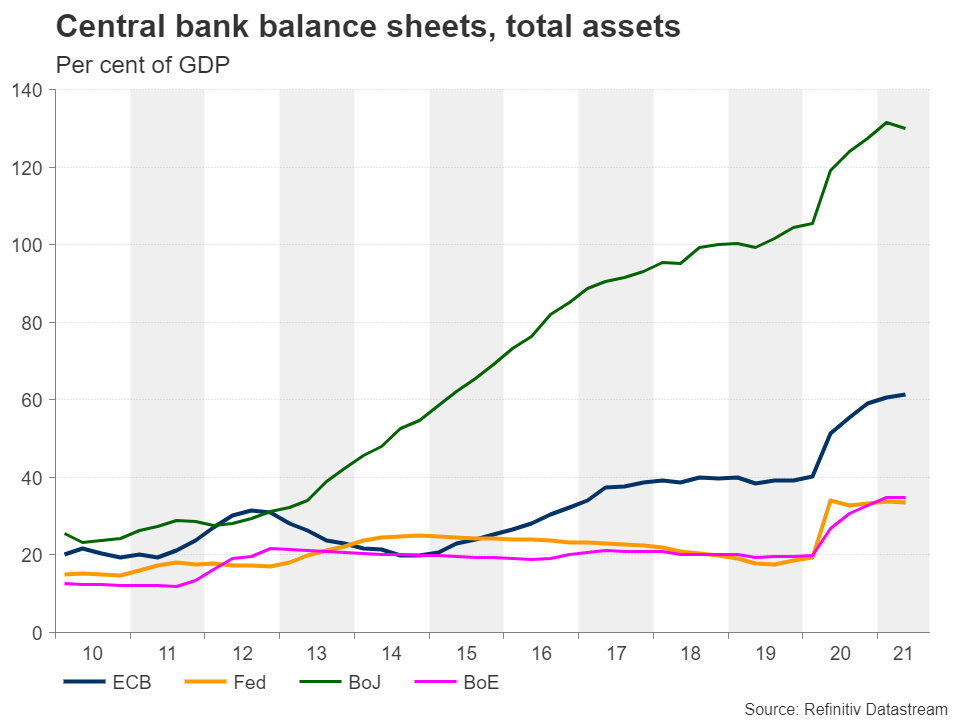
The BoE communicated a clear plan for how it intends to exit the pandemic-led monetary easing phase during its August gathering. The guidance is for the benchmark interest rate to rise first from the current 0.1%, but the focus will not switch to the balance sheet unless that rate climbs to 0.5%, in which case the central bank is expected to stop reinvesting its holdings of government and corporate bonds. Then, should economic conditions allow for more rate hikes to 1.0%, it will consider selling some of its bonds.The above suggests that the balance sheet is not a priority for the BoE, although its size to GDP has ramp up since the start of the year to peak marginally above the Fed’s as of Q2. Interest rates need to reach a threshold point for the central bank to adjust the settings in the asset purchase program. However, how fast borrowing costs will pick up towards the target will be conditional on the UK’s economic circumstances.
BoE chief Andrew Bailey revealed last week that during the previous policy meeting policymakers were split evenly (4-4) between those who believed that there was clear evidence that the economy is making progress in eliminating spare capacity and achieving 2.0% inflation sustainably, and those who felt that more needs to be done.Apparently, the deceleration in the services sector as reflected in the downbeat August Markit PMI survey, and the stagnation in July’s monthly GDP figures is not in tie with this narrative. Yet, the economic spectrum could take a more positive color this week as forecasts point to a solid employment growth of 178k in July compared to 95k in June and to a mildly smaller unemployment rate of 4.6% from 4.7% previously.
Perhaps the jobs data could be considered outdated, though with the furlough scheme entering its final weeks this month, a positive surprise could be an encouraging signal for the central bank that more people have been rejoining the labor market as government’s wage contribution have been falling. Recent stats indicated that the number of people under the furlough scheme was the lowest in July since the start of the pandemic.
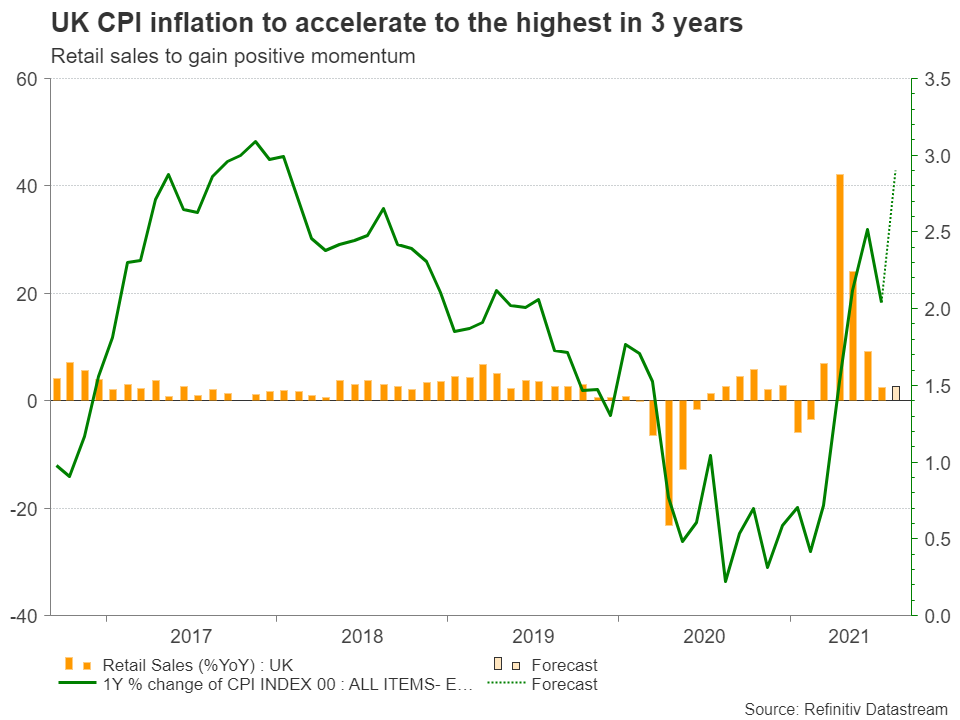
On Wednesday, inflation figures could be another incentive to deviate from current loose policy settings, with investors expecting headline CPI to heat to 2.9% y/y from 2.0% previously and the monthly gauge bouncing from 0.0% to 0.5%. A potential pickup in producer prices on the same day could further convince that inflation could be something more than temporary, especially if retail sales on Friday return to growth, flagging that consumer spending is a tailwind to soaring prices. Expectations are for a robust recovery from -2.5% to 0.5% m/m, which could consequently lead to a stronger annual expansion of 2.7% versus 2.4% previously. Excluding fuel, retail sales could interestingly show a steeper upturn of 0.8% m/m from -2.4% in July.
Good news for sterling
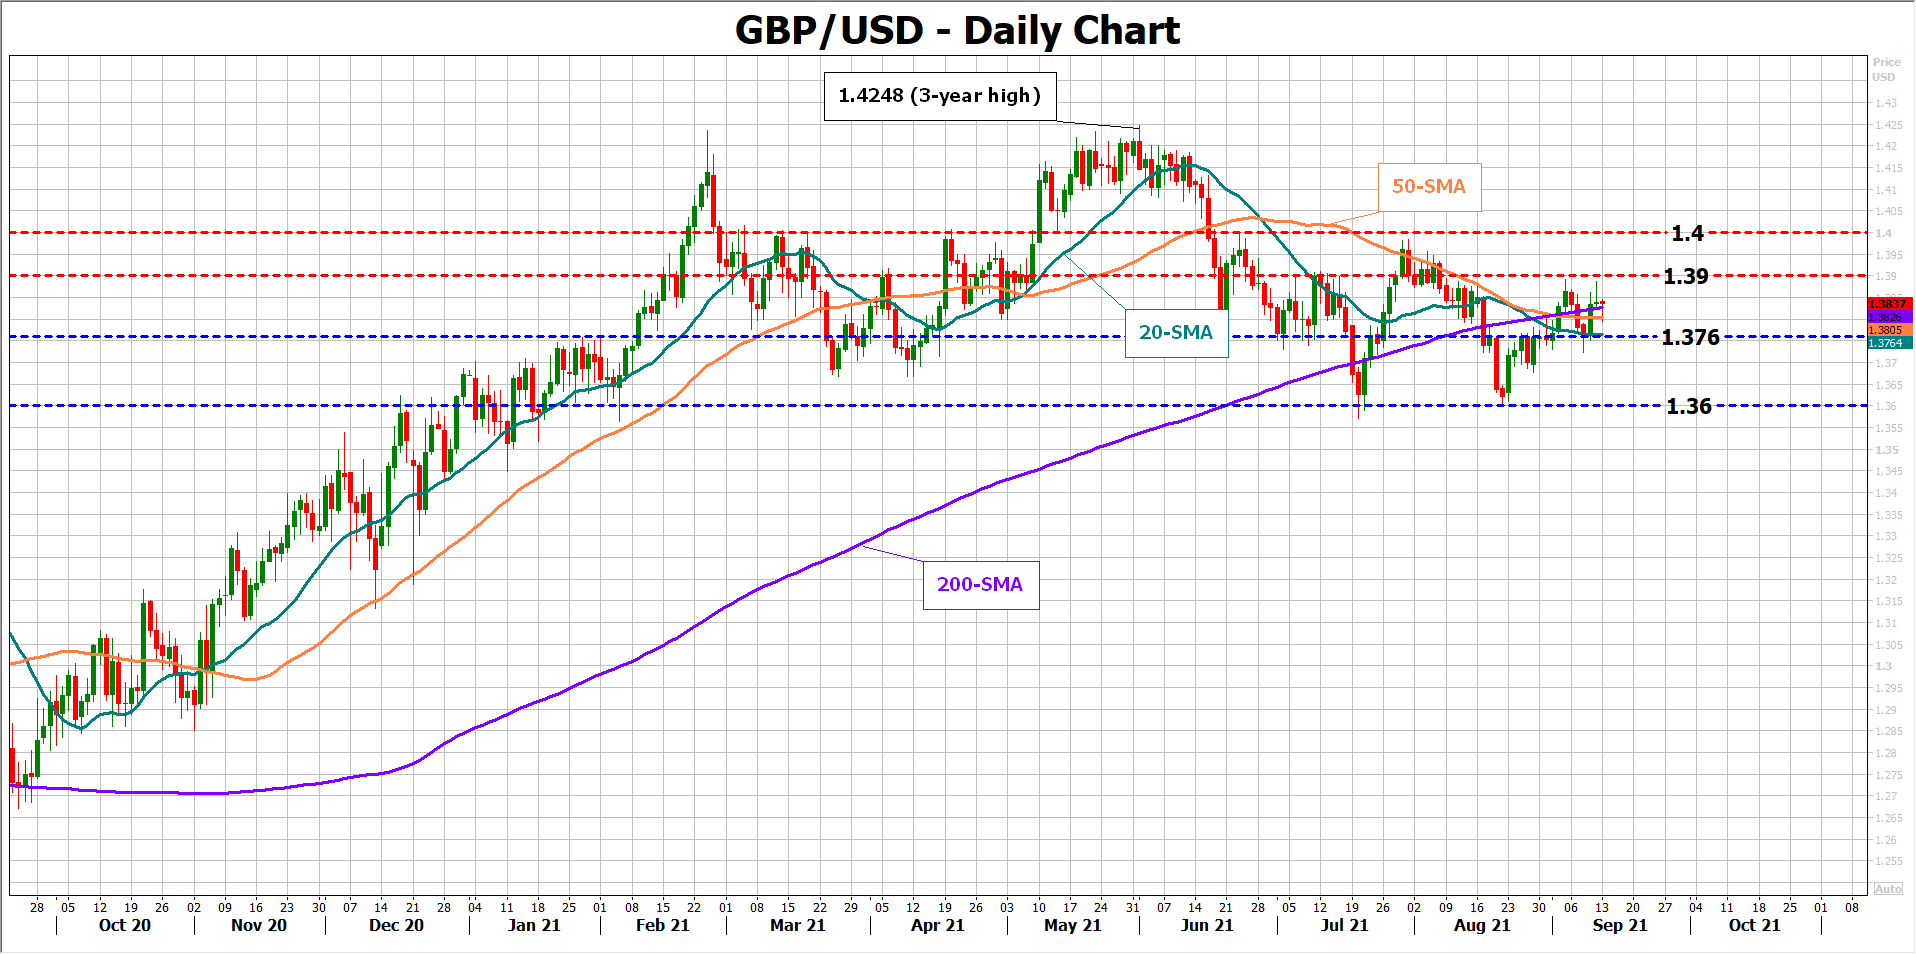
The good news for sterling is that the new BoE chief economist and former ECB official, Huw Pill, who will be participating in the voting process for the first time since his nomination, is considered a hawk on policy. Therefore, although an imminent rate hike during next week’s BoE event is unlikely to emerge as covid mortality is still gradually rising, his contribution could strengthen the hawkish voice within the central bank and raise the odds for a 15 basis-point rate hike in May 2022, especially if this week’s dataset provides an early warning that the economy is indeed meeting the minimum criteria for escaping the stimulus era. In this case, pound/dollar could set another battle with the 1.3900 level before heading for the crucial resistance of 1.4000.Alternatively, if the data fell short of expectations, pound/dollar could slide below the 200-day simple moving average at 1.3825 to seek support around the 20-day SMA at 1.3760.
Sunset Market Commentary
Markets
Asian/Chinese markets started the week in risk-off modus this morning as Chinese authorities took additional regulatory steps to prohibit ‘unwarranted’ (often monopolistic) practices from local tech giants. However, in a session devoid of any important data, European equities quite easily decoupled from these Asian trends. Even some ‘reflationary tendencies’ could be noticed, as oil, natural gas and (some) industrial commodities (aluminum, copper) maintained a good bid. Major European indices rose up 1%+ though are currently off the intra-day highs. Whether these price rises are supportive for overall growth is another story. At least today, equities don’t bother too much. The impact of this constructive sentiment on bonds/interest rate markets or FX was less straightforward. Core European and US yields even decline, albeit marginally. The EMU 10-y inflation swap (1.86%) touched the highest levels since end 2013, but this was still counterbalanced by a persistent decline in real yields. German yields currently are changing less than 0.5 bp across the curve. ECB’s Schnabel in an address in her home country repeated the ECB’s assessment that the prospect of persistently excessive inflation remains highly unlikely. However, should inflation sustainably reach the 2.0% target unexpectedly soon, she committed the ECB will ‘act equally quickly and resolutely’. The US yield curve flattens slightly with the 2-y yield little changed but longer maturities easing up to 2 bp (30-y) even as US equities also opened with decent gains. Tomorrow’s US inflation data remains the next milestone as global markets are counting down to next week’s Fed policy meeting, which is expected to clarify the Fed’s intentions for tapering.
Underlying reflationary tendencies, contrary to what is often the case, initially didn’t hamper a further USD rebound, even as the momentum slows during as US traders joined the fray. DXY is testing intermediate resistance in the 92.80/85 area. USD/JPY tries holding north of 110. EUR/USD (1.1790) declined further below the 1.18 handle as USD resilience was reinforced by persistent post-ECB euro softness. EUR/USD 1.1758 marks the 62% retracement of the late August/early September rebound. Euro softness also pushed EUR/GBP (0.8525) further south in the 0.8450/0.8615 consolidation range. Cable is trading little changed at 1.3835. Later this week, markets will receive an in extenso update on the UK economy with labour market data (tomorrow), price data (Wednesday) and retail sales (Friday). The data might fuel the debate within the MPC as to whether conditions are falling in place for the UK economy to eliminate spare capacity in such a way that would enable inflation to hold around the 2.0% target in a sustainable way. If in case of positive data, the Bank of England probably will continue to take a guarded approach on hiking policy rates which we don’t expect to occur before the middle of next year.
News Headlines
The Organization of the Petroleum Exporting Countries (OPEC) in its monthly report said that oil demand in Q3 2021 has proved to be resilient, supported by rising mobility and travelling activities. OPEC downwardly revised Q4 2021 world oil demand estimates though as the increased risk of COVID-19 cases primarily fueled by the Delta variant is clouding prospects. As a result, oil demand recovery is partially delayed into H1 2022 with an upward revision to total 2022 forecasts by 0.9 mb/d to 100.8 mb/d, exceeding pre-pandemic levels. Brent crude rises north of $73.5/b in a general constructive market sentiment.
Shanghai International Port Group said in a statement that it has suspended some container-related operation in the world’s biggest container port as the city braces for Typhoon Chantu to make landfall. Most flights in and out are also cancelled today and tomorrow. In the US, the National Hurricane Center warned that tropical storm Nicolas is forecast to strengthen to a hurricane by the time it reaches the northwest Gulf coast.
NZD Flat, Business Confidence Improving
The New Zealand dollar is almost unchanged in the Monday session. NZD/USD is currently trading at 0.7109, down 0.05% on the day.
ANZ Business Outlook shows improvement
New Zealand released the preliminary reading of the ANZ Business Outlook for September. The survey is normally published at the end of the month, but ANZ has been releasing mid-month surveys due to Covid. The reading was an improvement over the August release. Business Confidence rose to -6.8, up from -14.2 beforehand. The survey also found that inflation pressures had eased, but cost pressures remained extreme.
The government is going ahead with plans to ease lockdown restrictions as Covid numbers continue to fall. The New Zealand dollar has rebounded sharply and has more room to move higher if risk appetite improves. NZD/USD jumped 1.10% in August and has padded further gains of 0.90% in September as it trades above the 71 line. If economic conditions improve and the RBNZ can move forward with a rate hike, the New Zealand dollar should respond with further gains.
New Zealand GDP ahead
New Zealand releases GDP for the second quarter on Wednesday (the last major economy to post this release). The economy will be hard-pressed to repeat or beat the strong 1.6% gain in Q1. Still, the consensus of around 1.3% is more than respectable and would indicate that the recovery continues at a good pace.
Investors have circled September 22 on their calendars, which is when the FOMC holds its next policy meeting. The dismal non-farm payrolls likely extinguished any chance that the Fed would announce a long-awaited taper at this meeting. Still, that does not mean that this meeting will be perfunctory. If upcoming numbers such as this week’s retail sales are strong, the Fed could signal that tapering is a go at the FOMC meeting in November. Such a move would likely provide a strong boost for the US dollar.
NZD/USD Technical
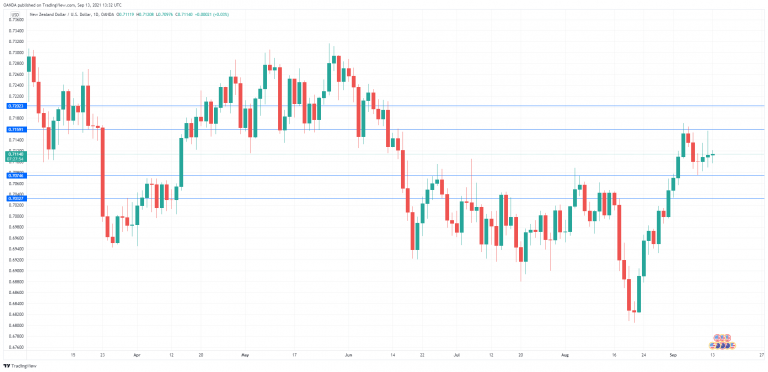
- There is resistance at 0.7159 and 0.7202
- On the downside, there is support at 0.7074. Close by, there is support at 0.7032
EUR/USD Mid-Day Outlook
Daily Pivots: (S1) 1.1797; (P) 1.1824; (R1) 1.1838; More...
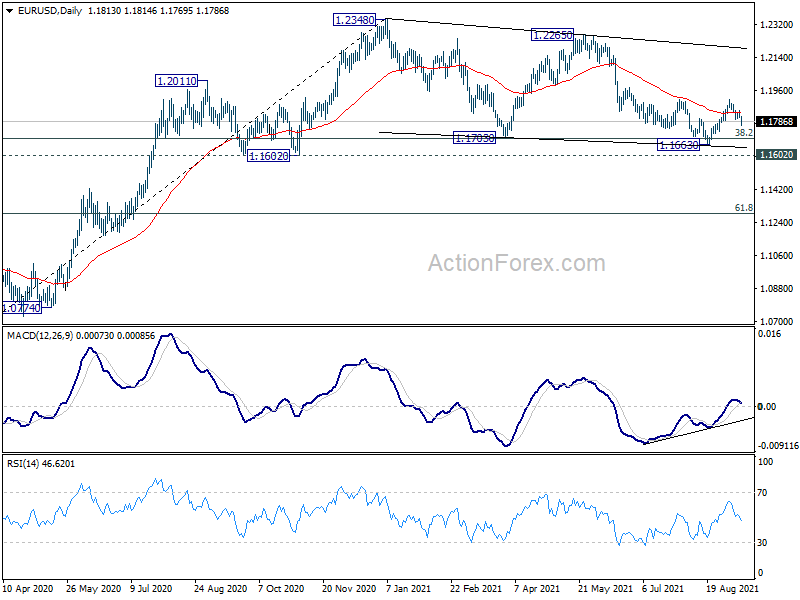
Intraday bias in EUR/USD stays mildly on the downside. Rebound from 1.1663 could have completed at 1.1908, after rejection by 1.1907 key structural resistance. Deeper fall would be seen for retesting 1.1663 support. Break there will extend the whole pattern from 1.2348 towards 1.1602 key support level. On the upside, above 1.1850 minor resistance will turn bias back to the upside for another test on 1.1907/8 resistance.
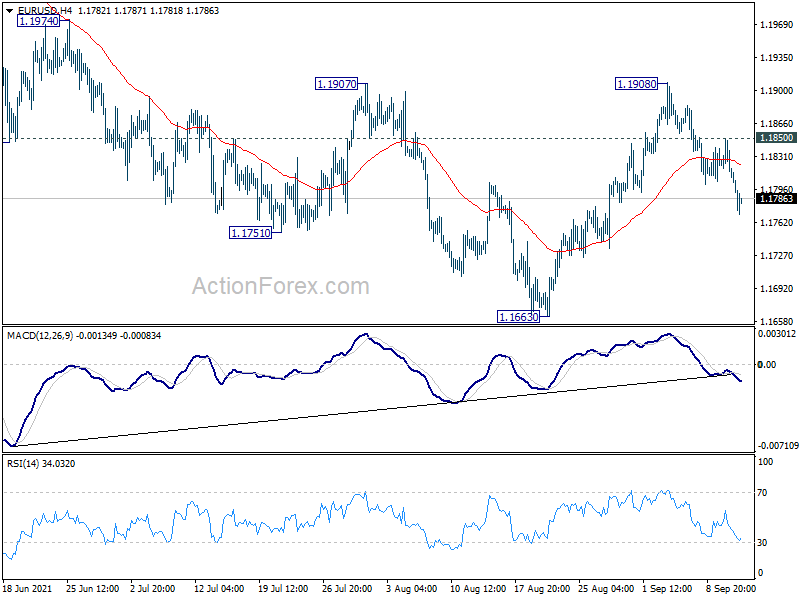
In the bigger picture, rise from 1.0635 is seen as the third leg of the pattern from 1.0339 (2017 low). Further rally remains in favors long as 1.1602 support holds, to cluster resistance at 1.2555 next, (38.2% retracement of 1.6039 to 1.0339 at 1.2516). However sustained break of 1.1602 will argue that the rise from 1.0635 is over, and turn medium term outlook bearish again. Deeper fall would be seen to 61.8% retracement of 1.0635 to 1.2348 at 1.1289 and below.