Sample Category Title
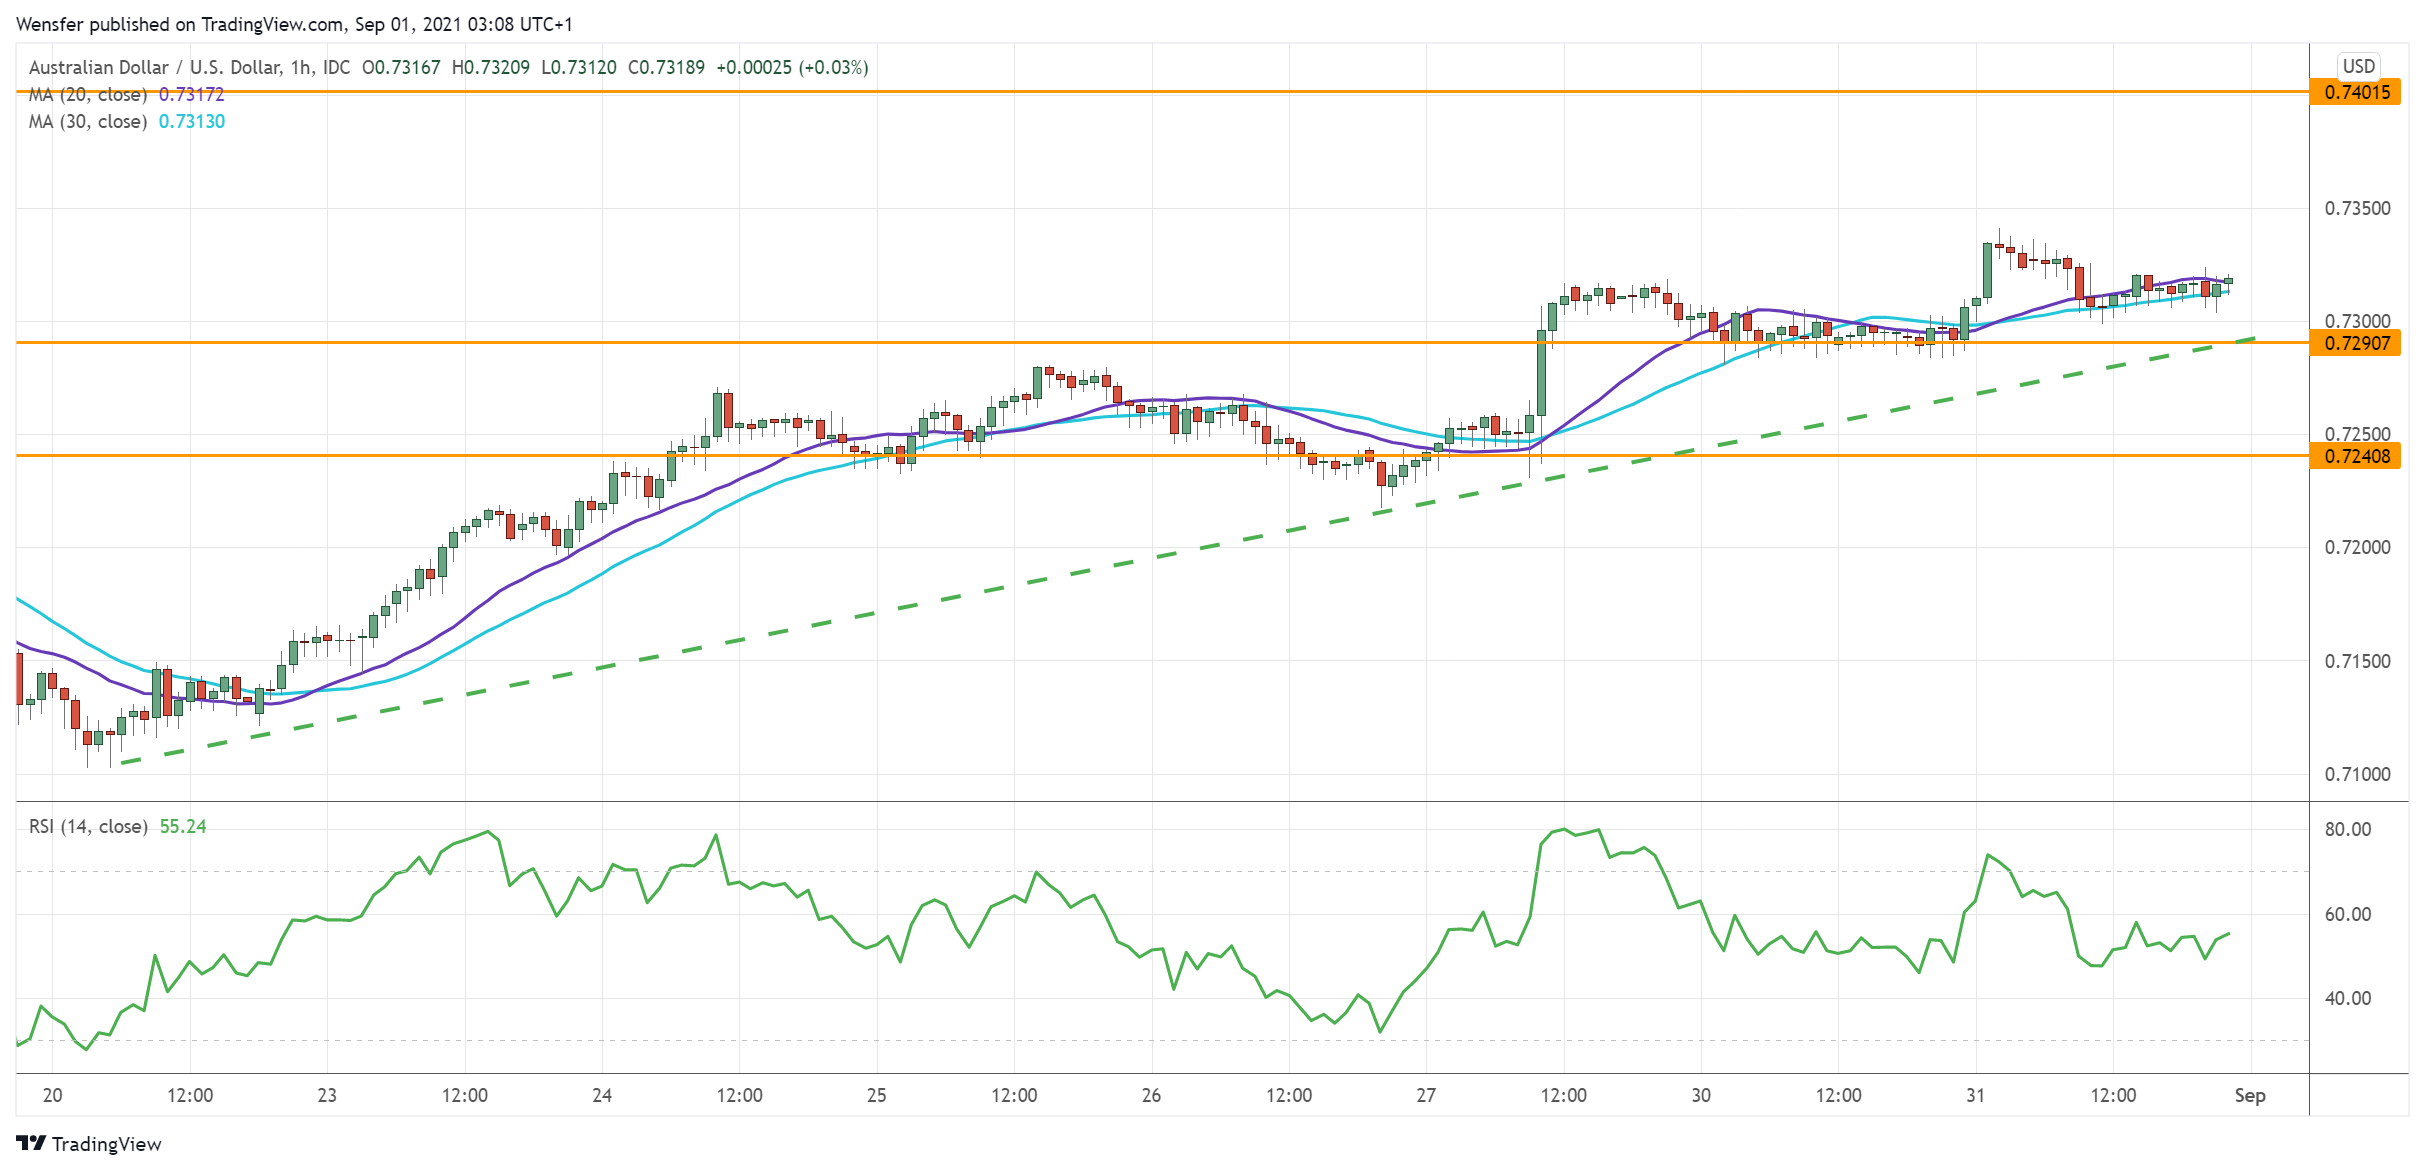
AUD/USD Rises To Major Resistance
The Australian dollar edges higher on upbeat Q2 GDP. The pair continues to recover along a rising trendline after it bounced back from the daily demand area near 0.7100.
The bullish pace accelerated after the first resistance at 0.7170 was lifted. Buyers are pushing towards the major hurdle at 0.7400 from the daily time frame.
A bullish breakout may trigger a runaway rally as medium-term sellers cover their positions. That in turn could end a three-month correction. 0.7290 is fresh support to let the RSI return to neutrality.
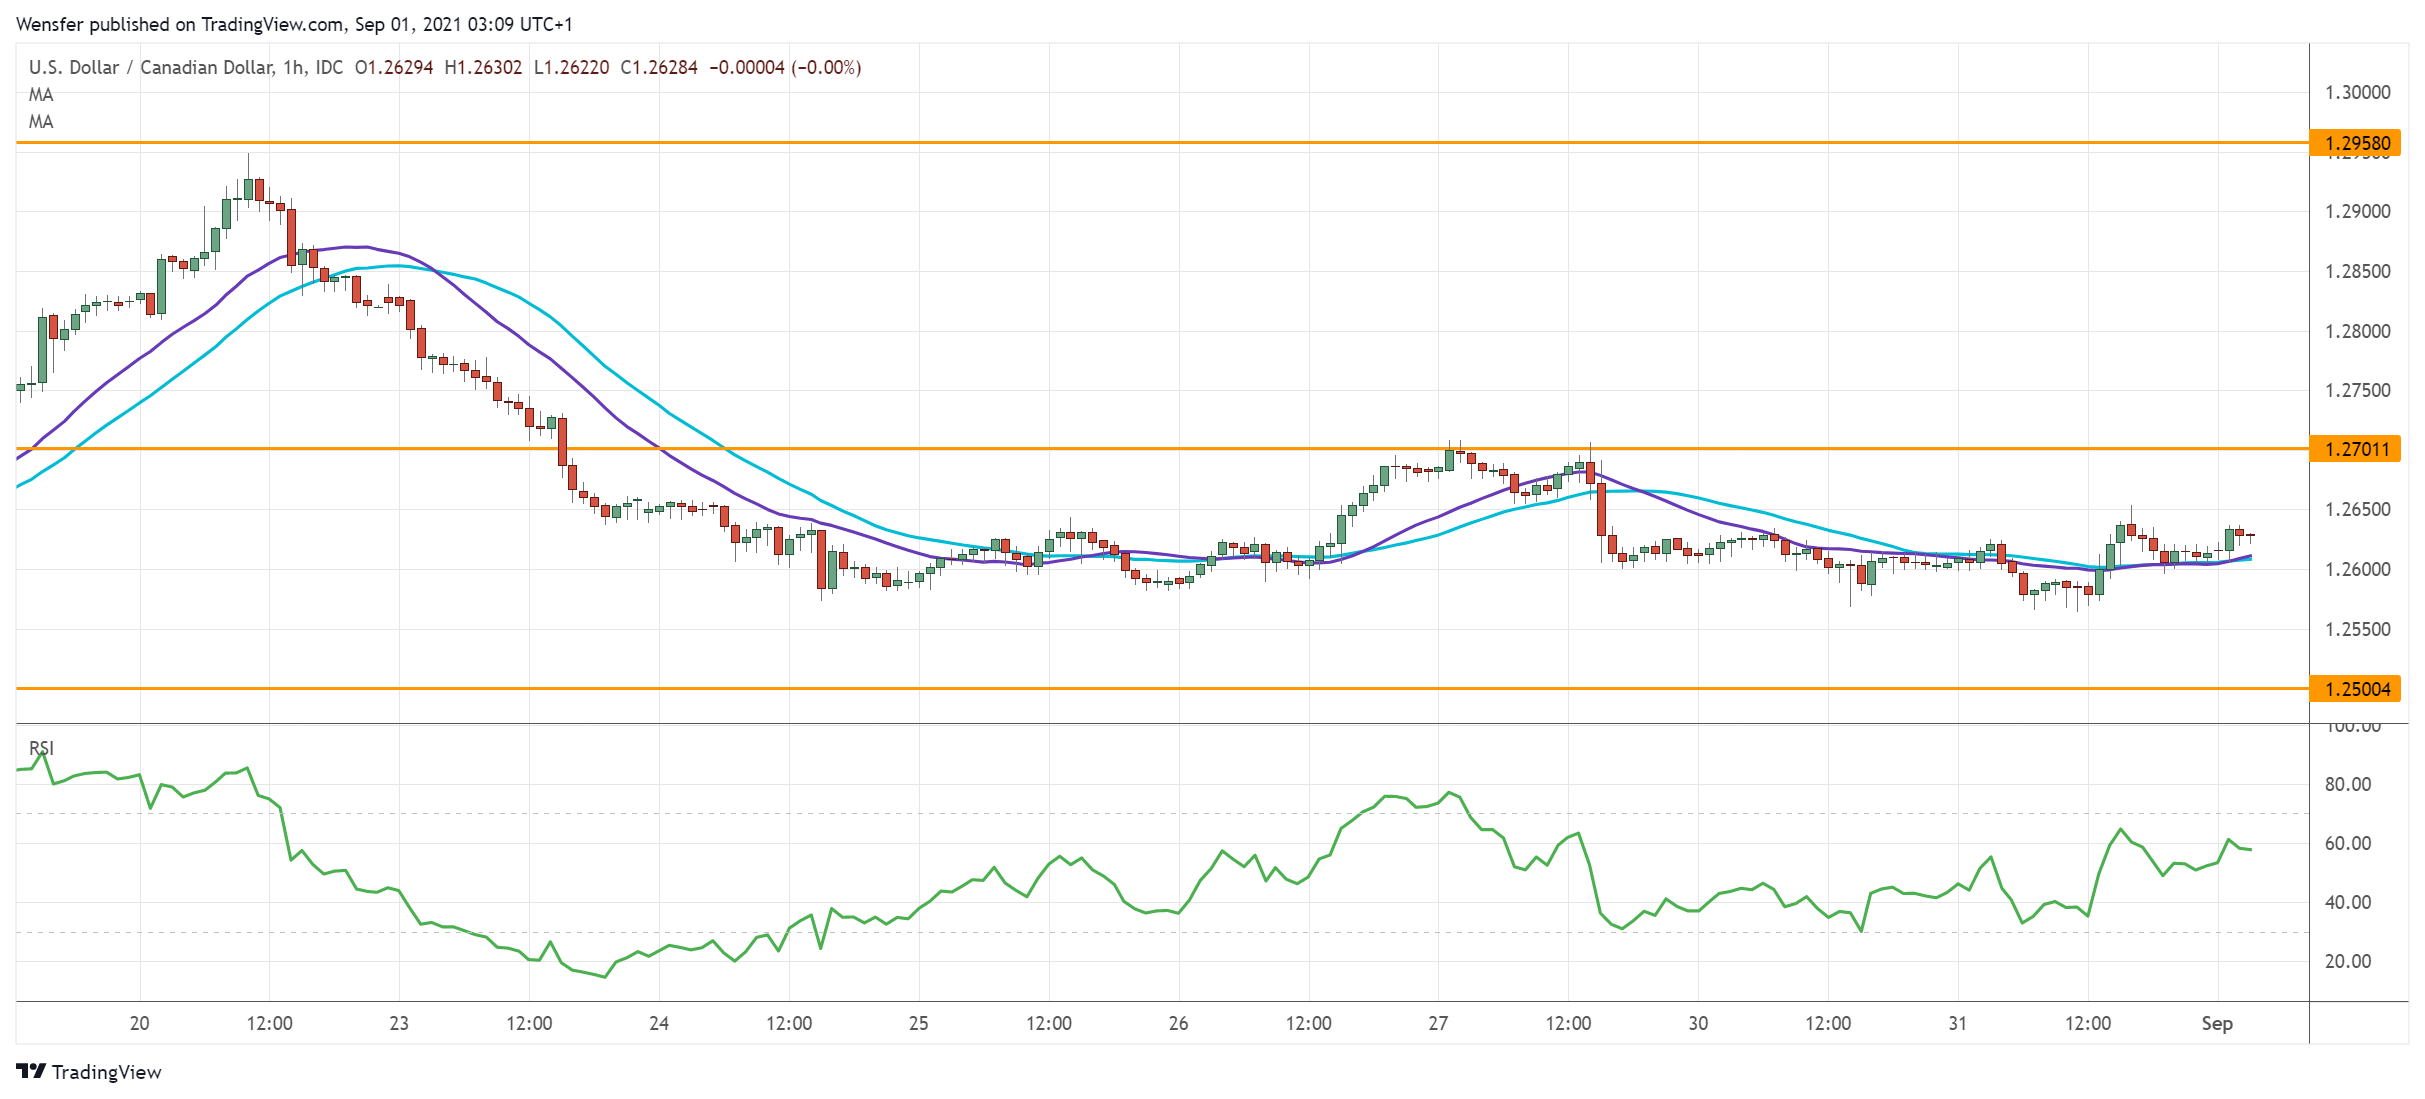
USD/CAD Struggles For Support
The Canadian dollar stalled after the Q2 GDP fell short of expectations. The US counterpart is testing the 30-day moving average and last week’s rebound failed to make an impression.
The fall below 1.2580 suggests a lack of buying interest. 1.2500 on the daily chart is a critical floor. A deeper retracement would put buyers on the defense with 1.2300 as a potential target.
On the upside, buyers will need to rack up offers at 1.2700 before they could hope for a second chance. Then 1.2900 would be within reach.
EUR/USD Continues To Recover
The US dollar continues to soften from weaker-than-expected consumer sentiment in August.
The euro bulls gained confidence after the single currency rallied above 1.1800, an important supply zone from the mid-August sell-off. Now, this has turned into an area of congestion along a rising trendline. Furthermore, it is a clear indication of a bullish bias in the short term.
However, an overbought RSI may lead to a limited pullback. A bounce off 1.1795 would propel the pair to the daily resistance at 1.1900.

USDJPY Looks For A Bullish Triangle Breakout
USDJPY has been gradually recovering within a symmetrical triangle over the past two weeks, but it was unable to close decisively above the 110.00 level.
Having stepped on the 20-day simple moving average (SMA) and jumped into the upper bullish Bollinger band area, the price is currently looking for the opportunity to break the surface of the triangle formation, which could consequently bolster buying forces above the 110.00 number and towards the 110.70 – 111.00 resistance area. Note that the levels coincide with the 61.8% and 78.6% Fibonacci retracement levels of the 111.65 – 108.71 downfall. Even higher, the pair could sail towards the 111.65 top and then attempt to overcome the 2020 high of 112.21.
The upward slope in the RSI, which has pierced above its 50 neutral mark, is an encouraging indication that positive momentum could persist. That said, the indicator continues to trade within a range below its August high. Therefore, fresh higher highs might be required to confirm a bullish bias. Likewise, the MACD, having barely stepped into the positive area, has yet to show a clear direction.
On the downside, a close below the triangle could power selling pressures towards the 23.6% Fibonacci of 109.40 and the 109.10 support zone. Should the bears clear the 108.71 – 108.35 floor too, the pair could plunge towards the April low of 107.47.
All in all, traders appear to be indecisive in the USDJPY market so far, waiting for a move above or below the triangle to adjust their exposure accordingly.

US Dollar Has Reason To Rise
Stock markets paused growth yesterday, with the dollar gaining support on the downturn and US indices correcting by around 0.1% from their peaks. Declines in Europe ranged from 0.1% in the CAC 40 to 0.3% in the DAX and 0.4% in the FTSE 100.
Pressure on the DAX was triggered by a wave of profit-taking that took away 1.5% from the index after touching the 16,000 level, a significant resistance from where the index rolled back earlier in August. Since Wednesday morning, there have been more buying, with an increase of 0.4%.
Perhaps this profit taking is the reason for the sluggishness of the markets the day before. Often, the stocks rise when the dollar is falling, but the US currency has been very reluctant to retreat in recent days.
The USD index was supported again yesterday on the way down to the 50 SMA, which has been the significant support line of the uptrend of the last three months. The same is true for EURUSD, which the bears did not let the day close significantly above 1.1800, pushing the pair below that level early on Wednesday.
The GBPUSD rebound in previous weeks lost strength on the approach to 1.3800, the area where the 50- and 200-day moving averages crossed, indicating that the bears are in control of the pair.
There are several factors on the USD's side in the coming days.
Firstly, there is the nervousness of waiting for the NFP on Friday. Strong data has the potential to trigger a wave of buying, cementing expectations that a reduction in balance sheet purchases will be announced as early as September.
Secondly, the US Treasury has noticeably depleted its liquidity supply to $262 billion without the ability to conduct new borrowing. And it intends to bring it to $800 billion in the coming months. During periods of active placements, dollar purchases tend to intensify, pulling liquidity from the riskiest markets.
Third, although the Fed is moving slowly to reduce its crisis-era support, it is several steps ahead of the Bank of Japan, the ECB and the Bank of England, which are further away from policy normalization. And that is significant fundamental support for the US currency.
If we see more profit-taking in the coming days and weeks, it could provide even more support for the USD on the capital flight to safety.
The DAX performance could prove to be the canary in the coal mine, reflecting the increased pull of investors to lock in profits from the impressive gains since the beginning of the year with 22% rise for S&P500, 20% for Nasdaq, 17% for Dow Jones, 15% for DAX 30 and 8% in the FTSE100.
It is likely that with the new month, investors will switch to Asian markets where more upside potential has accumulated after a 5% slump in the Hang Seng since the start of the year and a 2% rise in Shanghai Composite since the beginning of the year.
The US Dollar Retains The Benefit Of The Doubt
Markets
It doesn't happen that often but European (interest rate) markets set the tone for global trading yesterday. EMU August inflation (headline rising from 2.2 to 3.0%, core up 0.7% Y/Y to 1.6% Y/Y) printing higher than expected, caused some hawkish ECB members (Holzmann, Knot) to make their point that time has arrived for the ECB to scale back policy support. ECB growth and especially inflation forecasts might again be upwardly revised at next week's meeting. It is still unsure how/when this will translate in slower ECB PEPP bond buying. However, with the little ECB policy normalization discounted, European yields extended recent bottoming. The German yield curve bear steepened with yields rising between 2.3 bp (2-y) and 6.1 bp (30-y). 10-y yield (-0.385%) tries to conquer the -0.40%/-0.38% resistance area. US yields followed the European trend from a distance. US data were mixed, with an acceleration in US house prices (cf infra) but a sharper than expected decline in consumer confidence. US yields rose between 0.8 bp (2-y) up to 3.6 bp (30-y), with higher real yields being the driver. The rise in LT interest rate differentials wasn't enough for EUR/USD to confirm its break of the 1.1805 resistance. The pair closed only modestly higher at 1.1809. The TW USD index tested support in the 92.48 area but also closed little changed (92.63). A more fragile risk sentiment and the rise in US real yields maybe served as drivers for the USD resilience. The euro also slightly outperformed sterling, but failed to regain the 0.86 barrier (close 0.8585).
Asian equities this morning are well bid despite higher core yields and yesterday's pause in the US equity rally. Even so, the dollar retains the benefit of the doubt (DXY 92.77; USD/JPY 110.25; EUR/USD 1.18). After poor official PMI's earlier this week, the China Caixin manufacturing PMI also dropped into contraction territory (49.2 from 50.3). The yuan remains slightly in the defensive near USD/CNY 6.463.
At the first day of the month, the focus as usual turns to the US manufacturing ISM and ADP job growth. For the ISM a modest decline from 59.5 to 58.5 is expected. ADP job growth is expected to pick up from 330k to 638k. Recent data/survey evidence indicated that the peak in US growth momentum might be behind us, but prices pressures remain elevated. We see risks for a downside surprise. On the other hand, labour date might remain strong. On the European bond markets we look out whether the German 10-y yield will regain the -0.38% area and whether 10-y euro swaps (-0.035%) can return into positive territory. ECB's de Guindos in an interview published this morning at least confirms his positive assessment on the EMU economy going into next week's ECB meeting. Yesterday intraday EUR/USD performance was slightly disappointing. The pair probably needs weaker than expected data to resume its rebound to the 1.1909 next target.
News headlines
The US S&P Case Shiller house price index showed house prices rising at their fastest y/y pace since the start of the data more than 30 years ago. The yearly growth figure was 19.08% from 17.14% in May, beating 18.6% consensus. Low mortgage rates, surging lumber prices, labour and material shortages and a tight inventory (Covid-preference to move to the suburbs) all added to the mismatch between strong demand and a lack of supply. The WSJ reports that the US government might today announce measures to tackle the supply side of the story. Changes include allowing mortgage giants Fannie and Freddie Mac to invest more of their resources into rental housing, to encourage affordable housing production and to increase the financing available for manufactured homes. First-time home buyers and philanthropies will be given a chance to buy distressed properties insured by the Federal Housing Administration.
Australian GDP rose faster than expected in Q2 (0.7% Q/Q vs 0.4% Q/Q) following an upwardly revised 1.9% Q/Q in Q1. Household consumption and government spending were the main contributors to growth with net exports being a drag. Q2 data paint a misleading picture on the current situation of the Australian economy as the delta Covid-variant outbreak forced several states back into tight lockdowns as the government tries to fire up its vaccination campaign. The Aussie dollar is unmoved by the data, trading around 0.7310 against the US dollar.
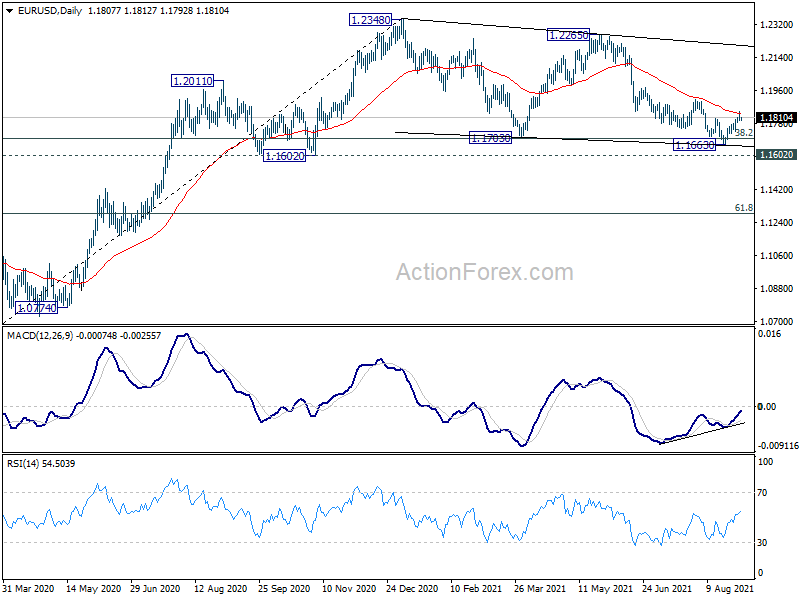
EUR/USD Daily Outlook
Daily Pivots: (S1) 1.1788; (P) 1.1816; (R1) 1.1838; More...
EUR/USD is losing some upside momentum as seen in 4 hour MACD. But further rise is in favor as long as 1.1734 minor support holds, for 1.1907 resistance. Decisive break there will indicate that fall from 1.2265, as well as the consolidation pattern from 1.2348, have completed. Near term outlook will be turned bullish for 1.2265/2348 resistance. On the downside, break of 1.1734 will turn bias back to the downside for 1.1602/63 support zone instead.
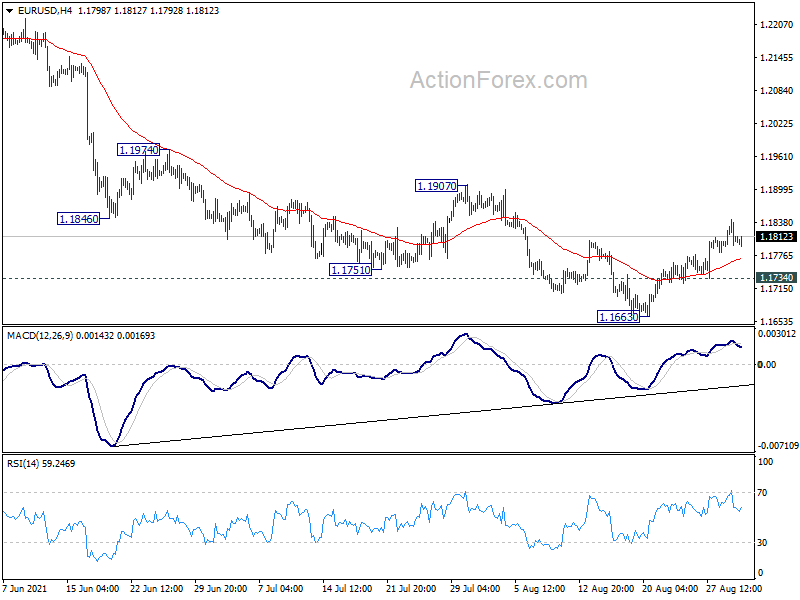
In the bigger picture, rise from 1.0635 is seen as the third leg of the pattern from 1.0339 (2017 low). Further rally remains in favors long as 1.1602 support holds, to cluster resistance at 1.2555 next, (38.2% retracement of 1.6039 to 1.0339 at 1.2516). However sustained break of 1.1602 will argue that the rise from 1.0635 is over, and turn medium term outlook bearish again. Deeper fall would be seen to 61.8% retracement of 1.0635 to 1.2348 at 1.1289 and below.
GBP/USD Daily Outlook
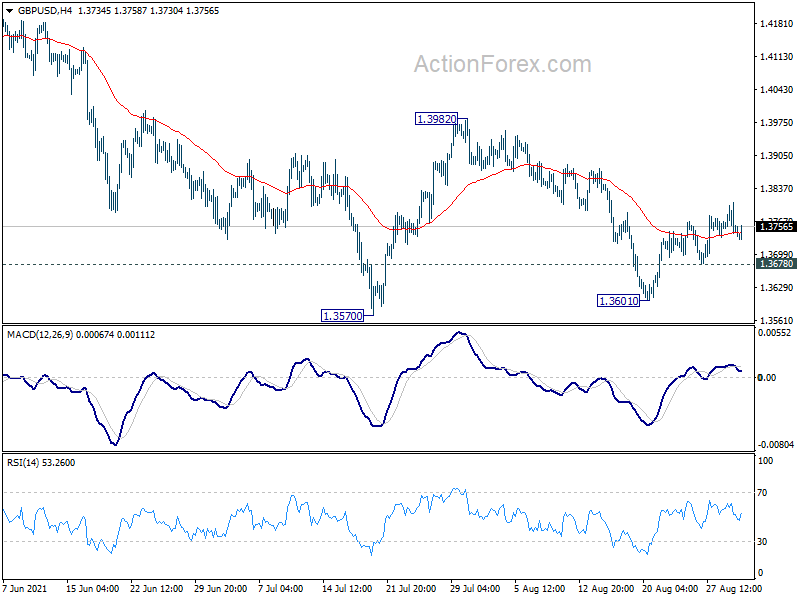
Daily Pivots: (S1) 1.3729; (P) 1.3768; (R1) 1.3794; More...
GBP/USD is losing some upside momentum as seen in 4 hour MACD. But rebound from 1.3601 is in favor to continue as long as 1.3678 minor support holds, for 1.3982 resistance first. Decisive break there will pave the way back to retest 1.4248 high. On the downside, break of 1.3678 will turn bias back to the downside for 1.3570 low, and possibly further to 1.3482 key resistance turned support.
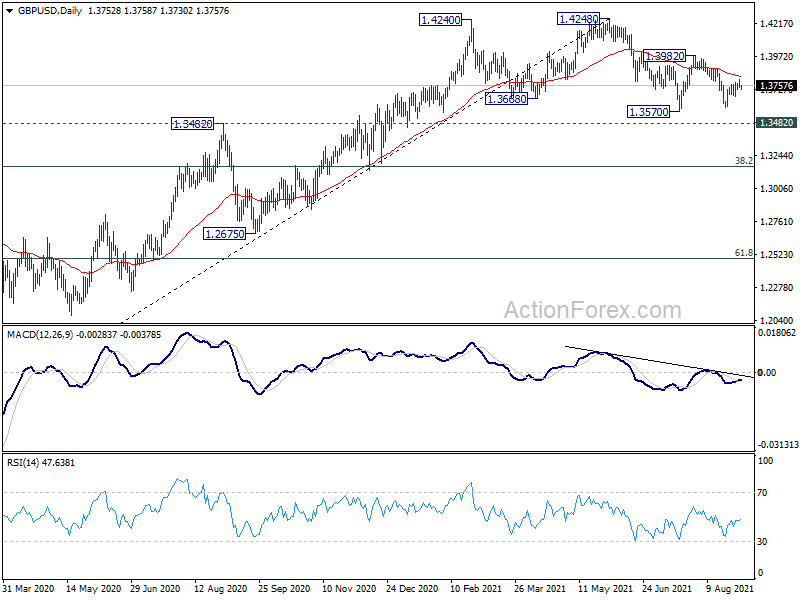
In the bigger picture, current development argues that rise from 1.1409 (2020 low) has completed at 1.4248, after failing 1.4376 resistance. Fall from there could either be correcting the rise from 1.1409, or starting another falling leg inside long term sideway pattern. In either case, sustained break of 1.3482 resistance turned support will target 38.2% retracement of 1.1409 to 1.4248 at 1.3164 first. Break there will pave the way to 61.8% retracement at 1.2493.
USD/CAD Bounces Off Support
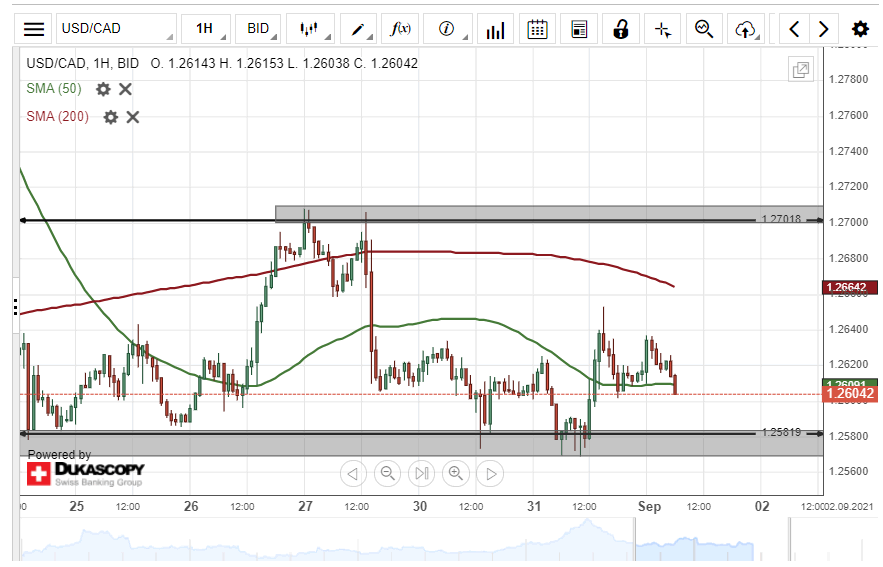
On Tuesday, the US Dollar surged by 67 pips or 0.54% against the Canadian Dollar. The currency pair breached the 50– hour simple moving average during Tuesday's trading session.
Given that the support level of 1.2580 holds, bullish traders may pressure the exchange rate higher during Wednesday's trading session. The potential target for buyers would be near the 1.2701 area.
However, the 200– hour SMA at 1.2665 could provide resistance for the USD/CAD currency exchange rate within this session.
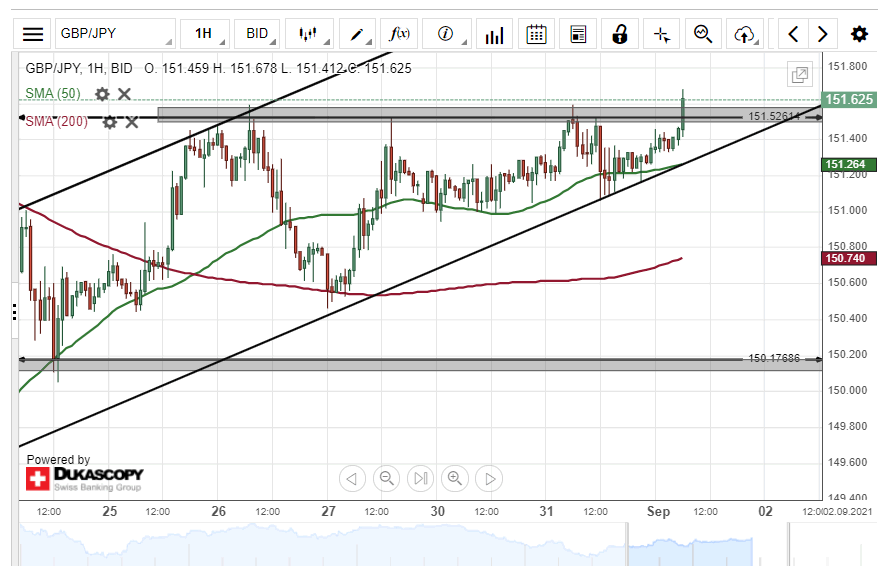
GBP/JPY Potential Target At 152.00
The GBP/JPY currency pair failed to break the 151.50 resistance level on Tuesday. As a result, the British Pound fell by 41 pips or 0.27% against the Japanese Yen during Tuesday's trading session.
Technical indicators suggest that the exchange rate could trend bullish during the following trading session. The possible target for buyers would be near the 152.00 level.
However, the resistance line at 151.52 could provide a barrier for bullish traders within this session.