Sample Category Title
Market Morning Briefing: Pound Has Scope To Rise Towards 1.3840
STOCKS
Equities are trading higher and most indices look bullish in the near term. Watch positive movement in equities globally for the next few days.
Dow (35455.80, +242.68, +0.69%) has risen well after the Jackson Hole meeting last week. We may expect the Dow to rise to 35750 or higher in the medium term.
DAX (15851.75, +58.13, +0.37%) has been fluctuating within 1560-16000 over the last few sessions unable to decide on a clear direction. We may expect a test of 16000 which if breaks can be bullish for the medium term.
Nikkei (27718.86, +77.72, +0.28%) has bounced from 27481.23 seen on Friday. The view is now bullish to see a rise towards 28000 in the coming sessions. While below 28000,the danger of seeing a fall towards 27000 cannot be negated.
Shanghai (3533.26, +11.10, +0.32%) trades above 3500.The view is now bullish to see a test of 3550 and eventually 3600.If Shanghai fails to sustain above 3500 then a corrective fall towards 3400 is possible in the coming sessions..
Nifty (16705.20, +68.30, +0.41%) has crossed the level of 16700.If nifty sustains above 16700,there are high chances of seeing a rise towards 16800/850 on the upside..
Sensex (56124.72, +15.62, +0.31%) has risen sharply above the level of 56000. While above 56000 we can see a test of 57000 on the upside in the coming sessions
COMMODITIES
Weak Dollar after the Jackson Hole meeting has been positive for commodities as most commodity prices have risen sharply. Brent and WTI can rise to 75 and 70 respectively before again declining from there. Gold and Silver looks bullish too. Copper may test 4.40.
Brent (73.02) has broken above 72.50 and could be headed towards 75-77 again before any decline sets in. We expect 75 to hold as a decent resistance in the near term.
WTI (68.64) too has risen and can test upper resistance at 70 before any decline is seen.
Gold (1817.20) has come off from 1821.9 tested on Friday. We have to see if the price sustains above 1820/25 to head towards 1840 eventually or holds below 1820 to fall back to 1800. A rise looks more likely just now.
Silver (24.13) has risen too and is bullish for a rise to 24.50.
Copper (4.3480) has broken the range of 4.20-4.30 on the upside. A rise towards 4.40 can be seen in the coming days. Thereafter, whether it sustains or falls back will have to be seen.
FOREX
Expected volatility has been seen after the Jackson Hole meeting where it was stated that the central bank would begin tapering before end of the year. Dollar Index trades lower taking up Euro to 1.18+ levels and while that sustain, a rise to 1.1850-1.19 could be seen. USDJPY has come off and could test 109.40-109. Pound and Aussie are bullish for the near term. USDCNY is falling towards 6.45/44 while USDINR can dip too towards 73.45/25.
Dollar Index (92.617) has come off sharply after the Jackson Hole meeting on Friday where the central bank has is likely to begin tapering before the end of this year. However, it has been stated that there is “much ground to cover” before any rake hikes are seen. Breaking below 92.80/60 will indicate further bearishness for the index dragging it towards 92 eventually. Immediate view is bearish.
Euro (1.1807) has risen well and could be headed towards resistance at 1.1850 from where a decline looks possible. A break above 1.1850, if seen and sustained will be positive and take the exchange further up towards 1.19.
EURJPY (129.62) has risen well too and could test 130-130.50 on the upside soon before facing any rejection there. The cross has to break above 130.50 and sustain in order to indicate fresh bullishness for the medium term and look for fresh upside targets. Till then we may expect 130.50 to hold and produce a rejection.
Dollar-Yen (109.78) seems to have come off sharply and while the dollar Index trades lower, USDJPY can also move down to test 109.40-109.00 soon.
Aussie (0.7298) is likely to test 0.7350 before facing rejection from there. Failure to rise from current levels can drag it lower to 0.7250 from here itself.
Pound (1.3768) has scope to rise towards 1.3840 and face rejection from there for a fall towards 1.37.
USDCNY (6.4674) has fallen sharply and could be headed towards 6.45/44 before again bouncing back from there.
USDINR (73.6850) fell sharply on Friday before the Jackson Hole meeting. Immediate support is seen at 73.60 which if breaks can take the pair further down to 73.45/25. If the falling momentum sustains, there is scope for an eventual fall towards 73 in the longer run. Any immediate bounce if seen can take the pair higher to 74.0-74.20 again.
INTEREST RATES
The US Treasury yields have dipped across tenors following the Fed Chairman Jerome Powell’s speech on Friday. Powell said that the Fed will begin the stimulus taper this year. However, he had indicated that the interest rate hike might take a longer time. The Treasury yields have support near current levels which will have to hold in order to see a rise from here. We will have to wait and see. The German yields remain stable and are keeping alive the chances of seeing a corrective rally before resuming the downtrend. The 5Yr GoI remains stuck in the 5.68%-5.72% range and needs to see a breakout of this range to get clarity.
The US 2Yr (0.22%), 5Yr (0.79%), 10Yr (1.30%) and the 30Yr (1.91%) Treasury yields have come down sharply across tenors on Friday. The 10Yr will have to sustain above 1.28% and the 30Yr above 1.87% in order to keep the chances alive of seeing the rise to 1.4%-1.45% (10Yr) and 2%- 2.1% (30Yr) that we have been mentioning last week. Else the yields can fall-back to 1.2%-1.18% (10Yr) and 1.8%-1.75% (30Yr). We will have to wait and watch.
The German 2Yr (-0.75%), 5Yr (-0.71%), 10Yr (-0.43%) and 30Yr (0.04%) yields have dipped slightly. The 30Yr keeps alive the chances of seeing a rise to 0.10%-0.20% (revised up from 0.15% mentioned on Friday). The 10Yr on the other hand has to break above -0.40% in order to gain momentum and move up to test -0.30%/-0.25% (10Yr) on the upside. Thereafter the yields can reverse lower and resume the broader downtrend.
The 5Yr GOI (5.6831%) is still oscillating within the 5.68%-5.72% range. We repeat that we have to wait for a breakout of this range to see if the yield can move up to 5.74%-5.76% or fall to 5.66%-5.62% from here.
Eco Data 8/30/21
[php_everywhere instance="1"]
Forex and Cryptocurrency Forecast
EUR/USD: Three Hawks and a Dove in Jackson Hole
The return of the EUR/USD pair to 1.1700-1.1900 was predicted by 35% of experts supported by 25% of oscillators that showed it was oversold. After renewing the annual low of 1.1665 on August 20, the pair did go into a correction, reaching 1.1775 on Thursday.
The week's economic statistics proved weak enough for both the US and Eurozone, and all market attention has been shifted to the annual Jackson Hole symposium, running from 26 to 28 August. There were speeches by three representatives of the US Fed leadership, which turned out to be even more hawkish than investors had expected.
So the president of the Federal Reserve Bank of St. Louis James Bullard said that the asset purchase program is doing the US economy more harm than good at the moment by inflating another soap bubble in the real estate market. According to Esther George, head of the Federal Reserve Bank of Kansas City, the current outbreak of the pandemic caused by the Delta strain will not have a significant impact on the economic situation in the country, and it would be better if the process of winding down QE starts earlier than later.
Robert Kaplan from Dallas joined his fellow hawks. Thus, the overall sentiment of these three high Federal Reserve officials can be reduced to the desire to start reducing asset purchases as early as the first and early second quarter of 2022, in the amount of $15 billion per month. Such a pace will allow the US central bank to raise its interest rate by the end of next year.
Fed chief Jerome Powell spoke at the Jackson Hole symposium at the very end of the working week, on the evening of Friday August 27. Some investors hoped that his position would be significantly softer than that of the Bullard-George-Kaplan trio. Otherwise, it could have dealt a major blow to the stock market, knocking down major indices including the Dow Jones, S&P500 and Nasdaq Composite. The bulls on the DXY dollar index, on the contrary, would be fazed by Jerome Powell's hawkish speeches. And although the consensus is gradually shifting to the fact that the regulator will announce the start of reducing monetary stimulus in November and will start implementing its plans in December-January, there was no need to wait for exact dates from the head of the Federal Reserve. That's exactly what happened: the high official said discussions about timing were still under way, that the issue would depend on economic and health risks, and that the central bank would continue to take a patient approach to their policies. The dollar weakened sharply after these words, and stock indices, on the contrary, updated historical highs once again.
Experts and investors have yet to analyze the likelihood of monetary restriction beginning in a period or another. So far, after some hesitation following Mr Powell's vaguely dovish position, the EUR/USD pair flew north, recorded a local high at 1.1802 and ended the five-day level at 1.1795.
Talking about the future, only 30% of the experts surveyed voted for the further growth of the pair, with the next targets of 1.1830 and 1.1900. The remaining 70% of analysts have taken the opposite view. They believe that the pair should retest the 1.1665 level. The nearest support is 1.1750 and 1.1700. The position of the indicators in total can be described as neutral. Among the oscillators on D1, 50% indicate a rise in the pair, 25% indicate a fall, and another 25% are colored neutral gray. As for trend indicators, 80% look south and 20% look north.
The coming week's events include the release of German consumer market statistics on August 30 and September 01. Similar statistics for the Eurozone will be released on August 31 and September 03. As for the US, the ADP report on the employment in the private sector and the ISM index of business activity in the manufacturing sector of the country will be published on September 1. And on the first Friday of the month, September 03, we will traditionally learn the most important indicators from the US labor market, including the number of new jobs created outside the agricultural sector (NFP).
GBP/USD: Wherever the Euro Goes, the Pound Goes
Overall, GBP/USD dynamics was reminiscent of the previous pair's movements. After reaching a low of 1.3600 on August 20, a rebound followed as a result of which the British pound rose to the mark 1.3767 on Thursday, August 26, as predicted by most (70%) experts.
Then came the meeting of American bankers in Jackson Hole and the hawkish speech of the aforementioned leaders of the Federal Reserve Bank, which led to some strengthening of the dollar and a decline in the pair to 1.3680. And then, thanks to the Fed chairman, the American currency began to fall in price again. As already mentioned, the market's hopes that Powell would announce a specific and early date for winding down the asset repurchase program did not come to fruition. As a result, the pair went up sharply, reaching a height of 1.3780, and completed the trading session at 1.3760.
Giving a forecast for the coming week, the majority of analysts (75%) expect the US currency to strengthen and a new storm of the 1.3600 level. If successful, the next target will be the horizon 1.3480. The nearest support is the zone 1.3680-1.3700.
The remaining 25% believe that the growth opportunities for the British currency have not yet been exhausted. The nearest resistance is at 1.3780, the nearest target is the return of the GBP/USD pair to the 1.3800-1.3875 zone. The nearest resistance levels are 1.3910 and 1.3960.
As for the oscillators on D1, 40% look south, 50% look east, and only 10% look north. Among the trend indicators, the ratio of forces is 60% to 40% in favor of the reds.
USD/JPY: Calm, and Calm Again
Amid market unrest caused by statements from Fed executives, unlike the rest of the currencies, the yen, as a quiet haven, is successfully countering any storms. The USD/JPY pair has been moving along the 110.00 horizon since last March, making rare attempts to get out of the 108.30-111.00 trading channel. This time, starting the week from 109.80 mark, it finished it almost there, at 109.82, and the range of fluctuations narrows even more: from 109.40 at the low to 110.25 at the high.
This behavior of the pair leads experts to give very versatile predictions. 40% of them have sided with bulls this time, 30% side with bears, and 30% have taken a neutral position. As for the indicators on D1, one cannot give priority to any of the directions here either.
Support levels are 109.40, 109.10, 108.70 and 108.30. The bears' dream is to retest the April low of 107.45. The nearest resistance levels are the 110.25, 110.55, 110.80, 111.00 and 111.65 zones. The ultimate goal of the bulls is still the same: to get to the cherished height of 112.00.
CRYPTOCURRENCIES: at the Crossroads

We put a question in the heading of the previous review. "The Lull Before the Storm?" - that is what it was. We also noted that powerful drivers will be needed to push bitcoin quotes above the current levels. But there were no drivers, so the storm hasn't happened yet. Although the news background is generally quite positive.
Thus, one of the digital market locomotives, MicroStrategy, purchased an additional 3,907 BTC on August 24 for about $177 million. The average purchase price was $45,294 per coin. And this suggests that the company does not expect any serious drawdown of the BTC/USD pair, and, on the contrary, expects its further growth.
In total, this analytics software provider has invested more than $2.9 billion in digital gold. Now there is a total of 108,992 BTC on MicroStrategy's balance sheet worth over $5 billion.
American banking giant Citigroup is awaiting regulatory approval to begin trading bitcoin futures contracts on the Chicago Mercantile Exchange (CME). Citigroup will therefore become another megabank after Goldman Sachs offering similar opportunities.
Bloomberg experts suggest that the US Securities and Exchange Commission (SEC) will approve not one, but several applications for the launch of ETFs on bitcoin futures. The goal is to maintain competition and not give anyone any advantage. The SEC may make its decision by the end of October. And the first European bitcoin futures could be launched as early as mid-September. This was announced by Europe's largest derivatives exchange Eurex.
Having reached the medium-term target, the BTC/USD pair is "stuck" in the $47,000-50,000 range. This zone is a kind of intersection of two roads: horizontal and ascending channels. And the mood of the market for the coming weeks depends on whether the pair will be able to break through the support at the level of $47,000.
In terms of medium- to long-term forecasts, they remain positive overall. This was shown by a survey conducted by Elwood Asset Management with 55 out of approximately 175 cryptocurrency hedge funds. According to the data, 65% of these hedge funds predict that bitcoin will be trading in the $50,000 to $100,000 range by the end of 2021. 21% of those surveyed named a price between $100,000 and $150,000. And only 1% of hedge funds predicts that the asset's value will be below $50,000.
63% of hedge funds believe that the cryptocurrency market capitalization will be in the range of $2 trillion to $5 trillion, with another 11% estimating a market capitalization of between $5 trillion and $10 trillion.
The fact that the price of BTC can show impressive growth, reaching $100,000, was admitted even by the constant critic of bitcoin, the president of the brokerage company Euro Pacific Capital Inc. Peter Schiff.
This "golden beetle" is known as the man who takes every opportunity to strike at cryptocurrency and call for the purchase of gold. However, this time, he did not undertake to dispute the fact that BTC is a great store of value. In fact, the ROI on bitcoin has been 8,900,000% over the past decade. At the same time, he remains bearish and excludes the possibility that the asset will ever be massively used as a means of payment. According to the financier, the only merit of bitcoin is that people speculate on it.
Mike McGlone, senior strategist at Bloomberg Intelligence, has also repeatedly predicted BTC's growth to $100,000. But, according to the expert, the mainstream of the second largest cryptocurrency by capitalization can become an obstacle to growth. People are beginning to realize that ethereum is "the building block for all financial technology, DeFi and infrastructure in a world that is going digital," McGlone said.
The expert named non-fungible tokens (NFT) as another powerful support for the price of the main altcoin. Such assets are becoming extremely popular and are mostly issued on the ETH blockchain.
At the same time, McGlone considers the former Goldman Sachs hedge fund manager Raoul Pal's forecast of ethereum growth to $20,000 as overstated. But, according to the analyst, the price will not fall below $2,000 either, rather the rate will exceed $4,000.
The creator of this altcoin, Vitalik Buterin, is much more optimistic about the future of ethereum. He expects that after the recent London hardfork and implementation of EIP-1559, the ETH price will be 10 times higher than current levels and reach $30,000. In this case, the capitalization of this altcoin would reach $3 trillion, and exceed the capitalization of all the major technology companies in the world. In the meantime, this figure is about $380 billion.
As far as the total capitalization of the crypto market is concerned, as we suggested in the previous review, there is now a struggle in the area of the psychologically important $2.0tn level. Starting at $2.043 trillion, this figure rose to $2.162 trillion on August 23, it fell to $1.973 trillion by August 27, and it rose again to $2.021 trillion by Friday evening.
Trading volumes on the BTC network remain low. The Crypto Fear & Greed Index froze practically, having risen by only 1 point in a week, from 70 to 71.
And in conclusion, our not-so-serious life hacks column has another tip on how to get rich on cryptocurrency. It turns out that for this you just need to move to live in Cool Valley in Missouri (USA). The mayor of this town decided to seriously raise the welfare of its 1,500 residents, and to that end promised to transfer $500 to $1,000 to each of them in BTC. At the same time, he put forward one condition: recipients will not be able to sell their bitcoins for five years, which, according to the mayor, will allow them to wait for the price of BTC to rise to half a million dollars.
CFTC Commitments of Traders – Risk Currencies Got Dumped. Reversal Likely in Coming Week
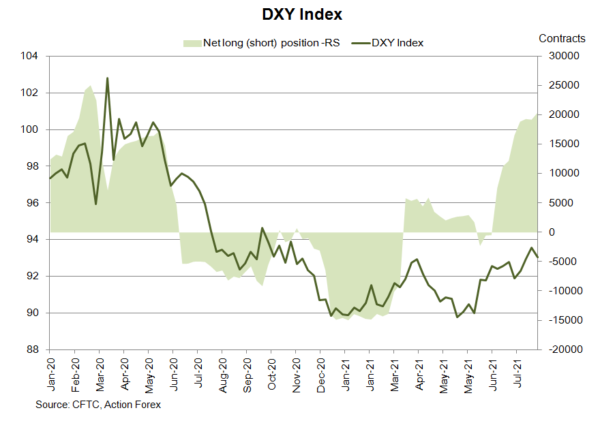
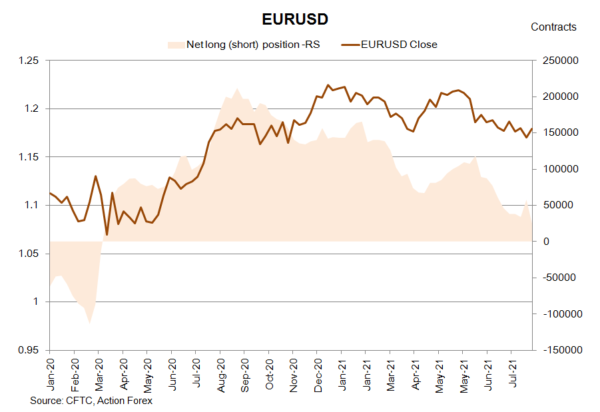
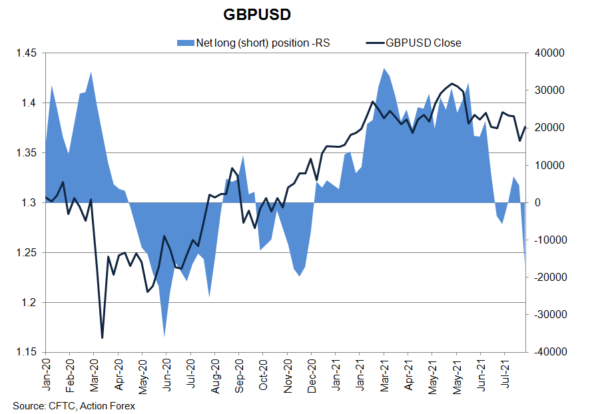
As suggested in the CFTC Commitments of Traders report in the week ended August 24, NET SHORT of USD index futures gained +1 151 contracts to 20 362. Speculative long positions added +1 151 with no change in shorts. European currencies got dumped in the reporting weeks on resurgence of new coronavirus cases and hopes of early Fed tapering. NET LENGTH in EUR futures sank -33 010 contracts to 24 630. GBP futures' drifted to NET SHORT of -16 745 contracts.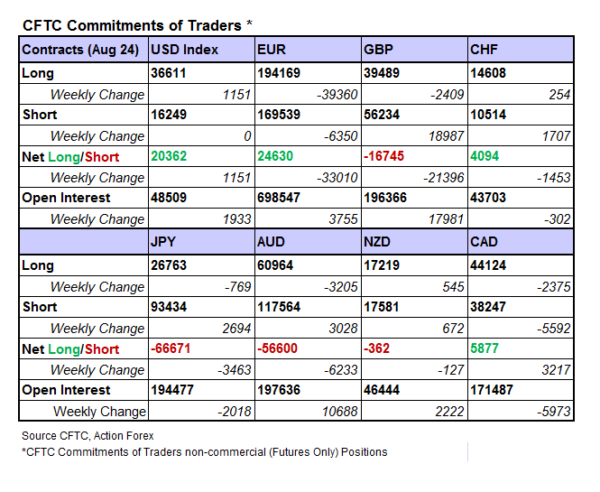
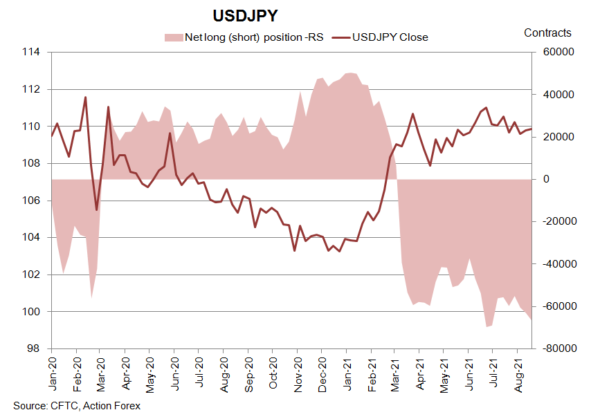
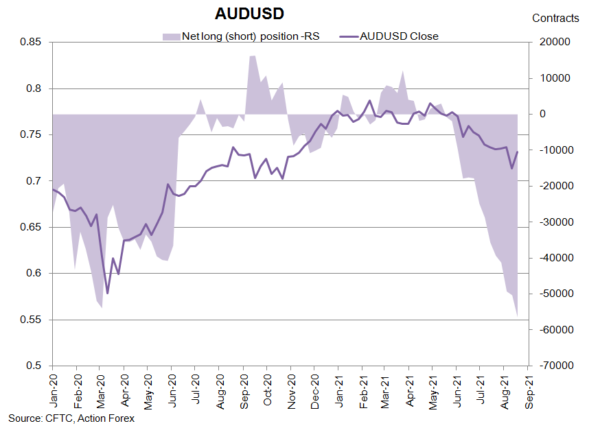
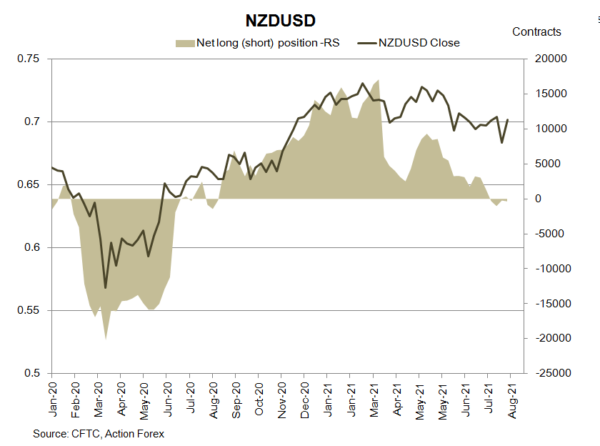
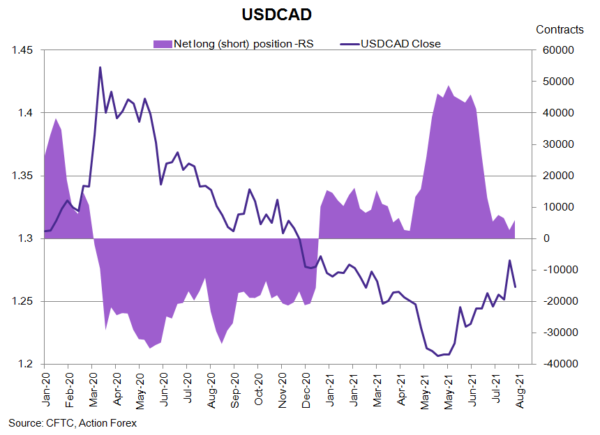
 On safe-haven currencies, NET LENGTH of CHF future fell -1 453 contracts to 4 094 while while NET SHORT of JPY futures gained +3 463 contracts to 66 671. Concerning commodity currencies, NET SHORT of AUD futures jumped +6 233 contracts to 56 600 while that of NZD futures added +127 contracts to 362 during the week. NET LENGTH of CAD futures rose +3 217 contracts to 5 877 during the week.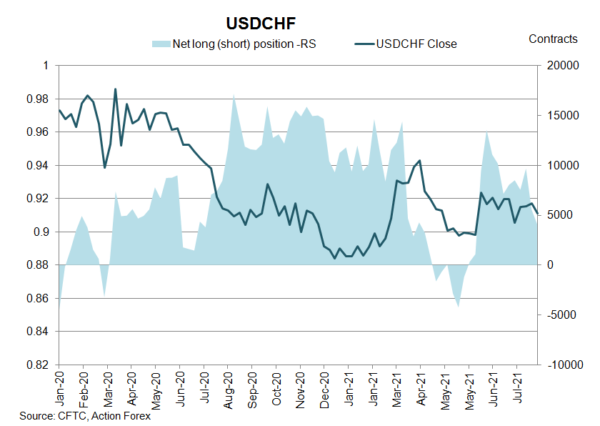
CFTC Commitments of Traders – Precious Metals Remained Firm while Crude Oil Rebounded after Sharp Fall
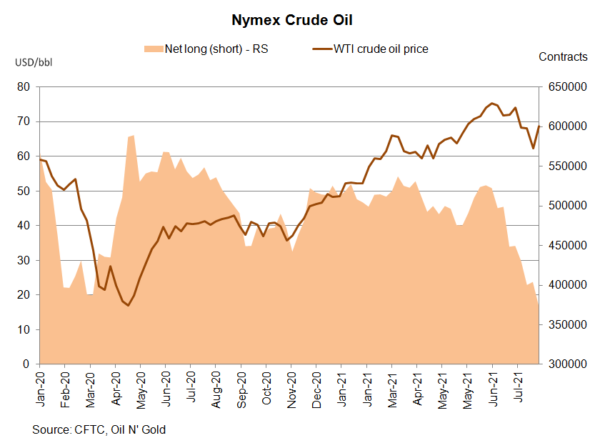
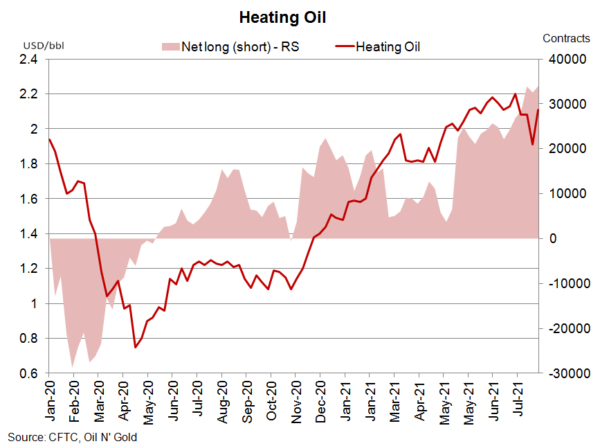
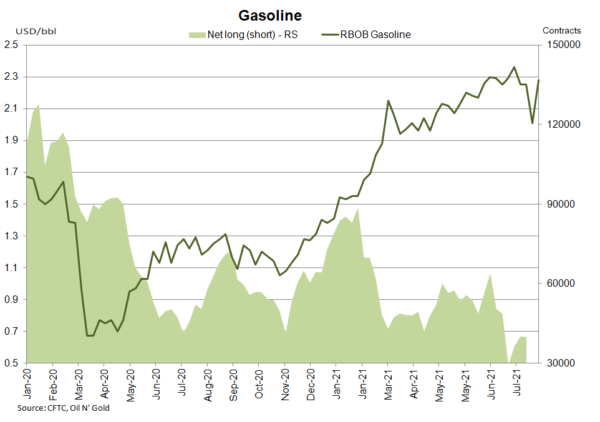
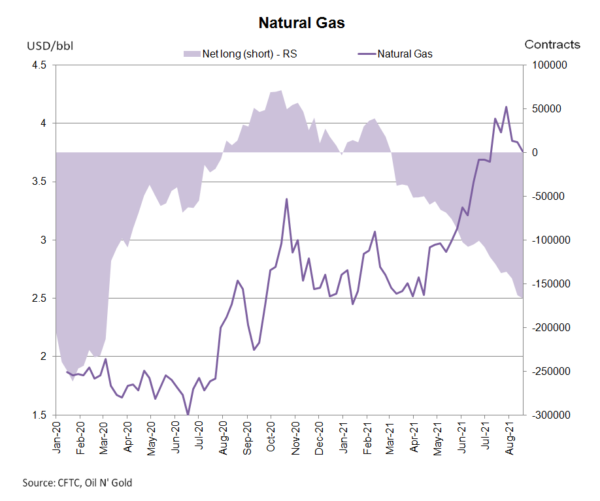
According to the CFTC Commitments of Traders report for the week ended August 24, NET LENGTH for crude oil futures plunged -30 011 contracts to 374 312 for the week. Speculative long position declined -10 078 contracts, while shorts jumped +19 933 contracts. The rebound of crude oil prices last week should probably lift net longs in the coming week. For refined oil products, NET LENGTH for heating oil gained +1 441 contracts to 34 020, while that for gasoline rose +1 137 contracts to 36 884. NET SHORT of natural gas futures increased +3 512 contracts to 166 577 during the week.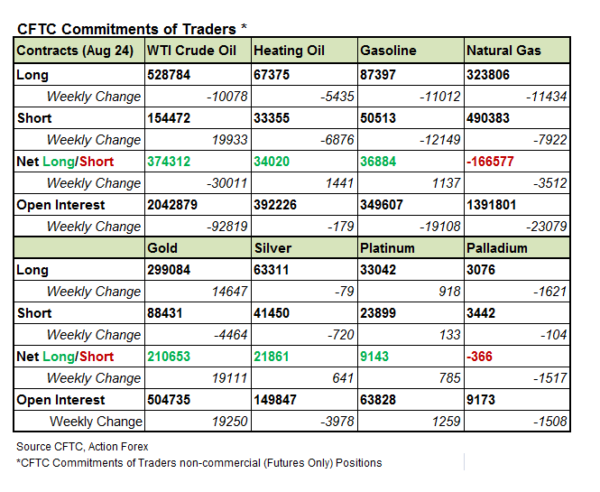
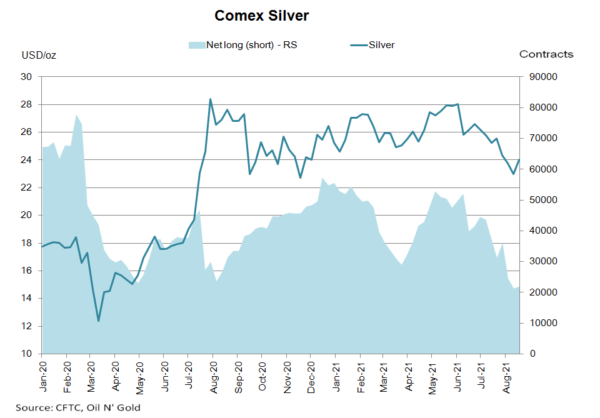
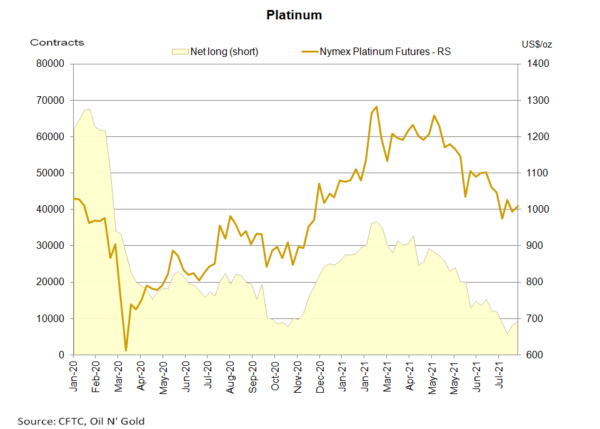
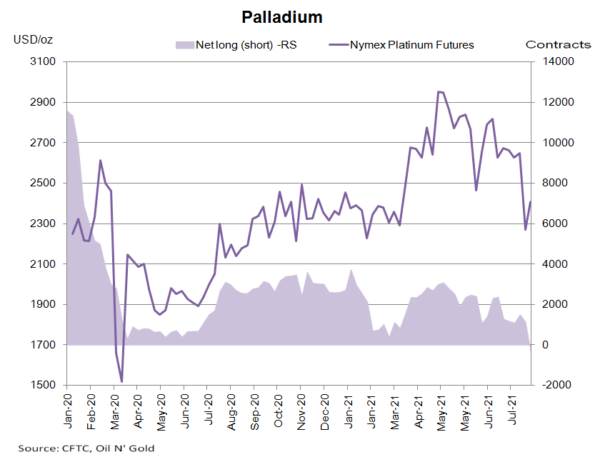
 Precious metals got further support amidst risk aversion. Gold futures’ NET LENGTH soared +19 111 contracts to 210 653 while silver futures’ NET LENGTH added +641 contracts to 21 861. For PGMs, NET LENGTH of Nymex platinum futures gained +785 contracts to 9 143. Yet, palladium futures drifted to NET SHORT of 366 contracts.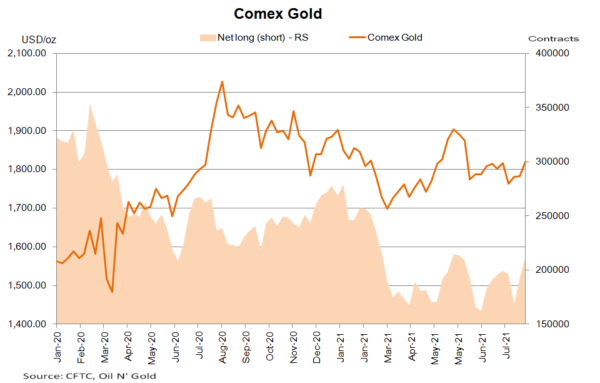
EUR/USD Weekly Outlook
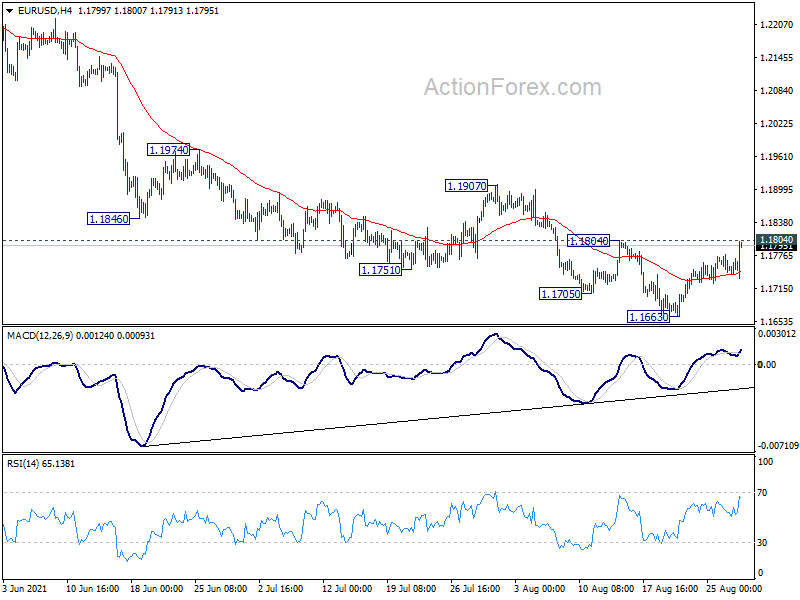
EUR/USD's recovery from 1.1663 extended higher last week but stays below 1.1804 resistance. Initial bias is neutral this week first with immediate focus on 1.1804 resistance. Break there will bring stronger rise to 1.1907 resistance first. Firm break there will indicate that fall from 1.2265, as well as the consolidation pattern from 1.2348, have completed. Near term outlook will be turned bullish for 1.2265/2348 resistance holds. In case of another fall, we'd continue to look for strong support from 1.1602/1703 key support zone to bring rebound.
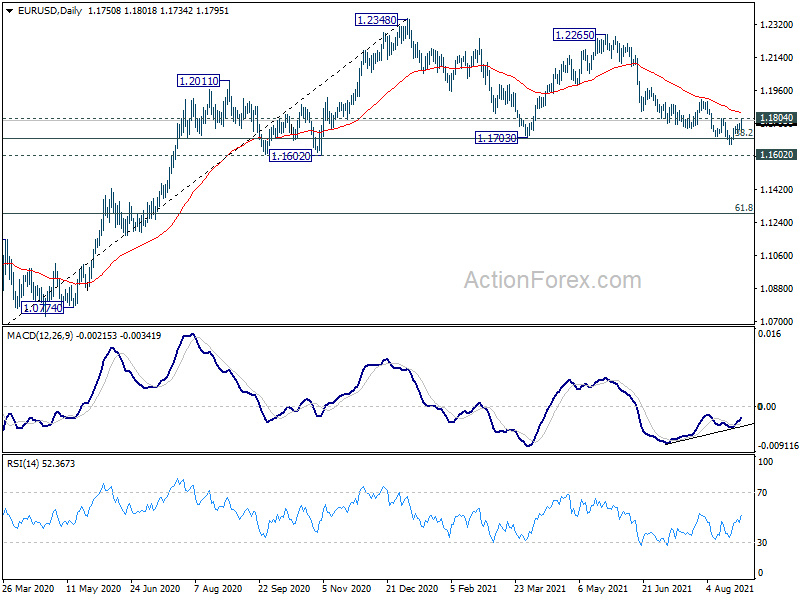
In the bigger picture, rise from 1.0635 is seen as the third leg of the pattern from 1.0339 (2017 low). Further rally remains in favors long as 1.1602 support holds, to cluster resistance at 1.2555 next, (38.2% retracement of 1.6039 to 1.0339 at 1.2516). However sustained break of 1.1602 will argue that the rise from 1.0635 is over, and turn medium term outlook bearish again. Deeper fall would be seen to 61.8% retracement of 1.0635 to 1.2348 at 1.1289 and below.
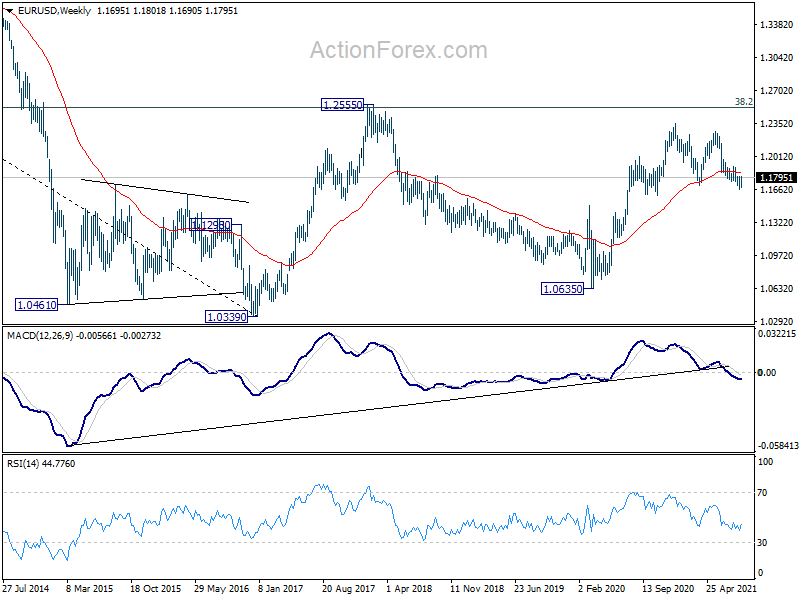
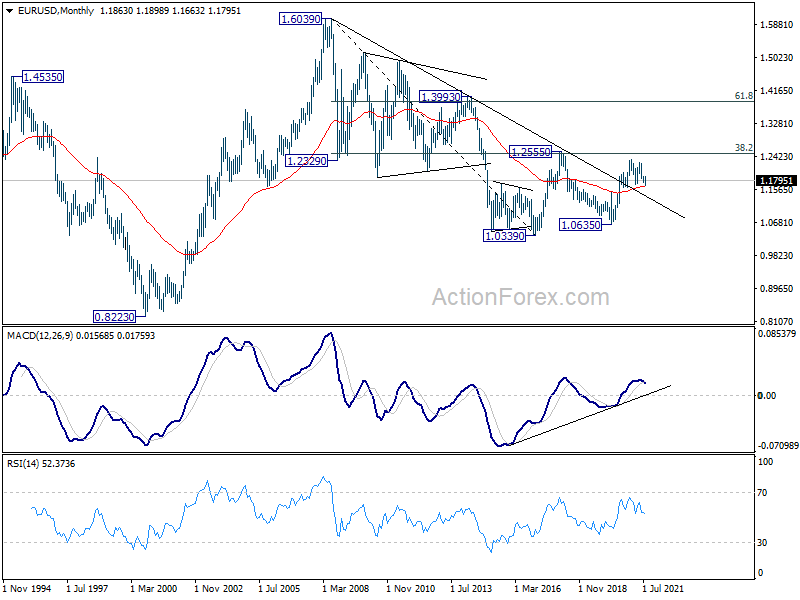
In the long term picture, focus remains on 1.2555 cluster resistance (38.2% retracement of 1.6039 to 1.0339 at 1.2516). Sustained break there should confirm long term bullish reversal and target 61.8% retracement at 1.3862 and above. However, rejection by 1.2555 will keep long term outlook neutral first, and raise the prospect of down trend resumption at a later stage.
USD/JPY Weekly Outlook
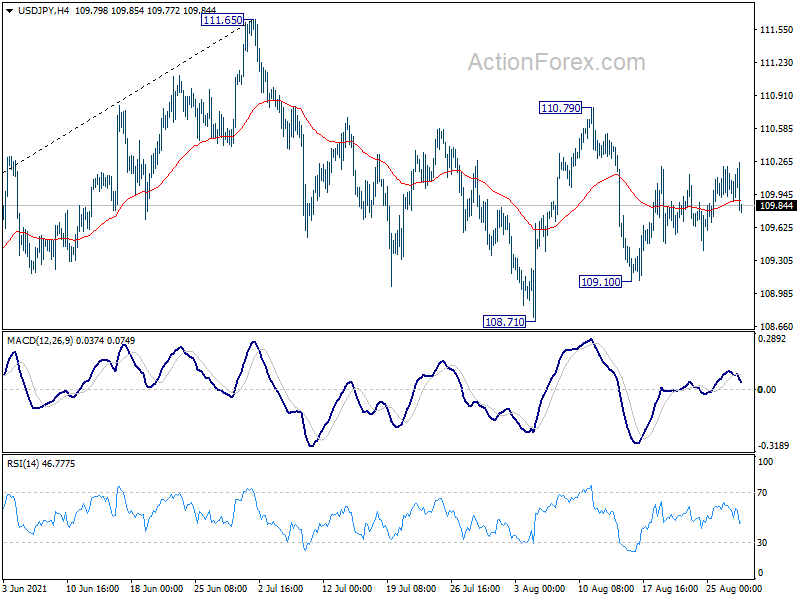
Range trading continued in USD/JPY last week and initial bias stays neutral this week first. On the upside, break of 110.79 will resume the rebound from 108.71 to retest 111.65 high. On the downside, break of 109.10 will target 108.71 support first. Firm break there will resume the decline from 111.65 and target 38.2% retracement of 102.58 to 111.65 at 108.18 next.
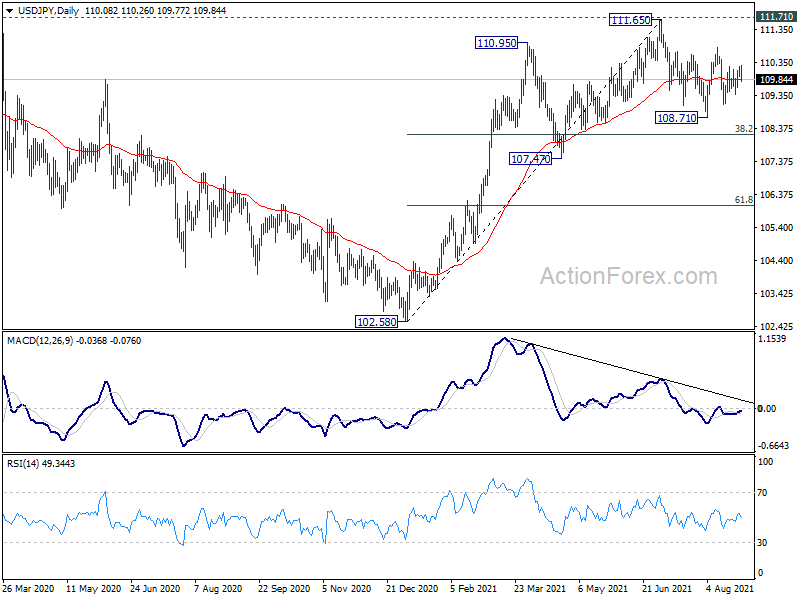
In the bigger picture, medium term outlook is staying neutral with 111.71 resistance intact. The pattern from 101.18 could still extend with another falling leg. Sustained trading below 55 day EMA will bring deeper fall to 107.47 support and below. Nevertheless, strong break of 111.71 resistance will confirm completion of the corrective decline from 118.65 (2016 high). Further rise should then be seen to 114.54 and then 118.65 resistance.
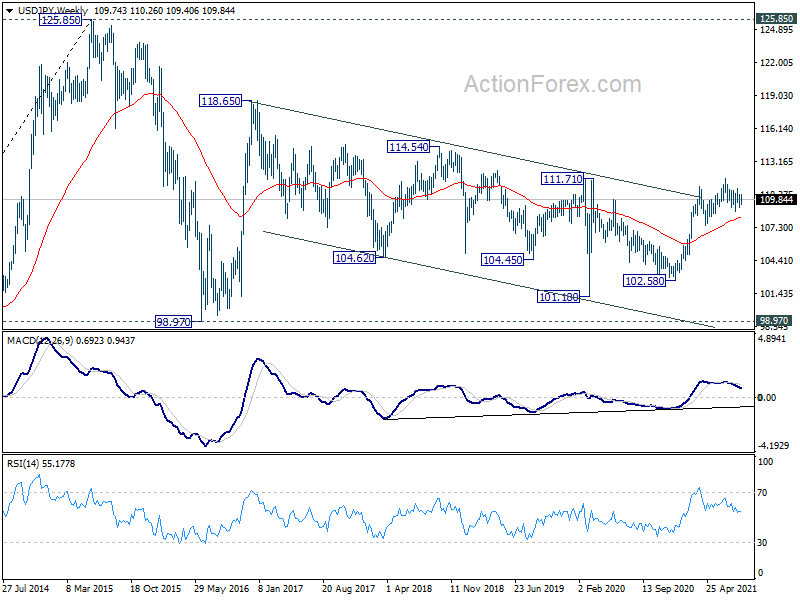
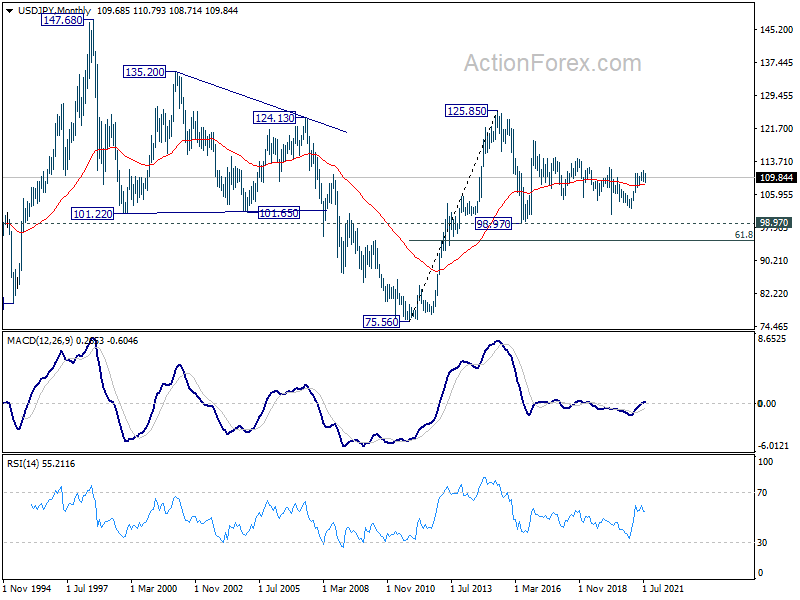
In the long term picture, the rise from 75.56 (2011 low) long term bottom to 125.85 (2015 high) is viewed as an impulsive move, no change in this view. Price actions from 125.85 are seen as a corrective pattern which could still extend. In case of deeper fall, downside should be contained by 61.8% retracement of 75.56 to 125.85 at 94.77. Up trend from 75.56 is expected to resume at a later stage for above 135.20/147.68 resistance zone.
GBP/USD Weekly Outlook
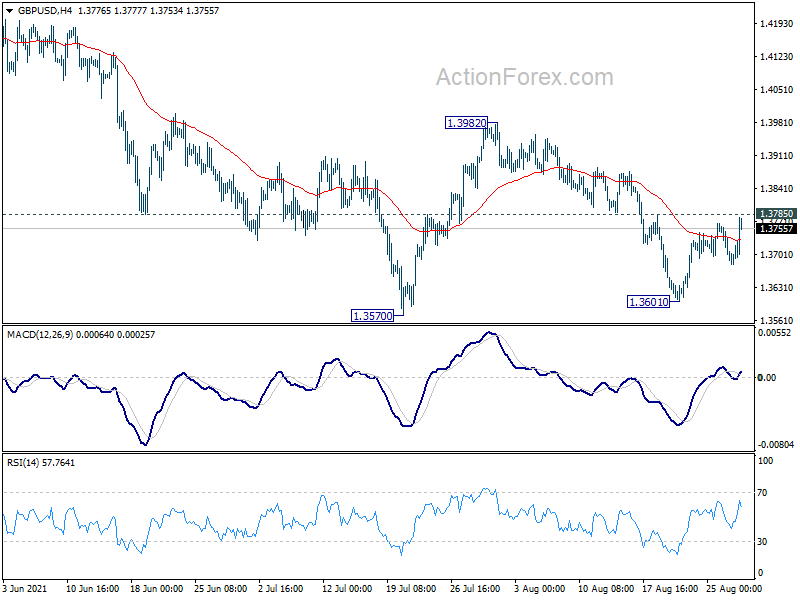
GBP/USD's rebound from 1.3601 extended high last week but stayed below 1.3785 resistance. Initial bias stays neutral this week first. On the upside. Break of 1.3785 will turn bias to the upside for 1.3982 resistance. Firm break there will indicate that fall from 1.4248 has completed and bring retest of this high. On the downside, below 1.3601 will resume the fall from 1.4248 to 1.3482 resistance turned support next.
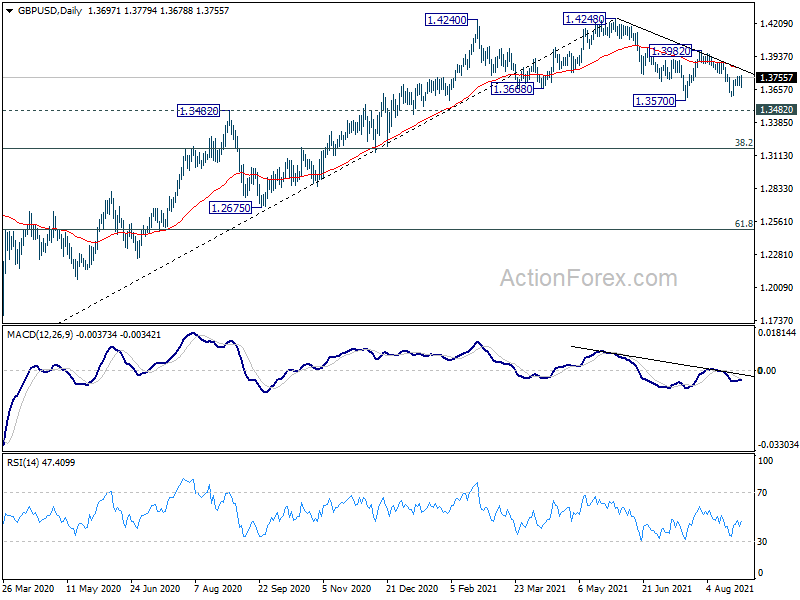
In the bigger picture, current development argues that rise from 1.1409 (2020 low) has completed at 1.4248, after failing 1.4376 resistance. Fall from there could either be correcting the rise form 1.1409, or starting another falling leg inside long term sideway pattern. In either case, sustained break of 1.3482 resistance turned support will target 38.2% retracement of 1.1409 to 1.4248 at 1.3164 first. Break there will pave the way to 61.8% retracement at 1.2493.
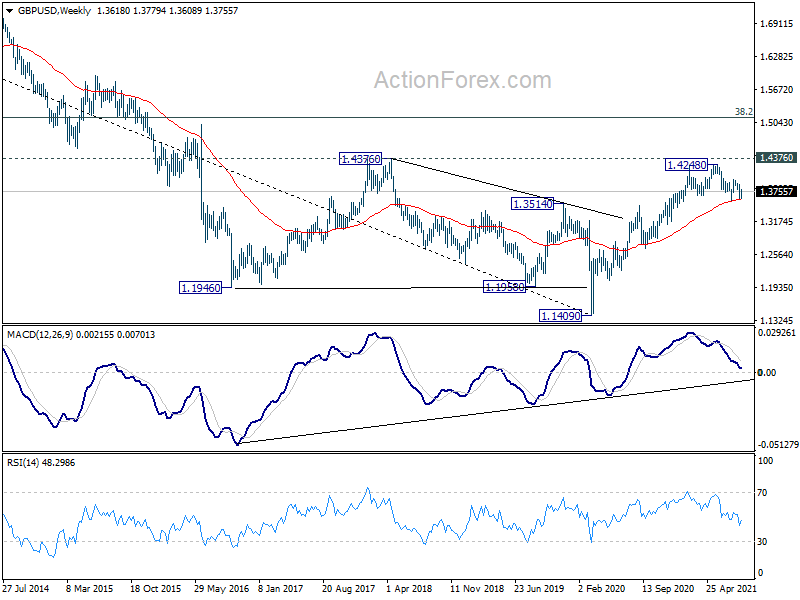
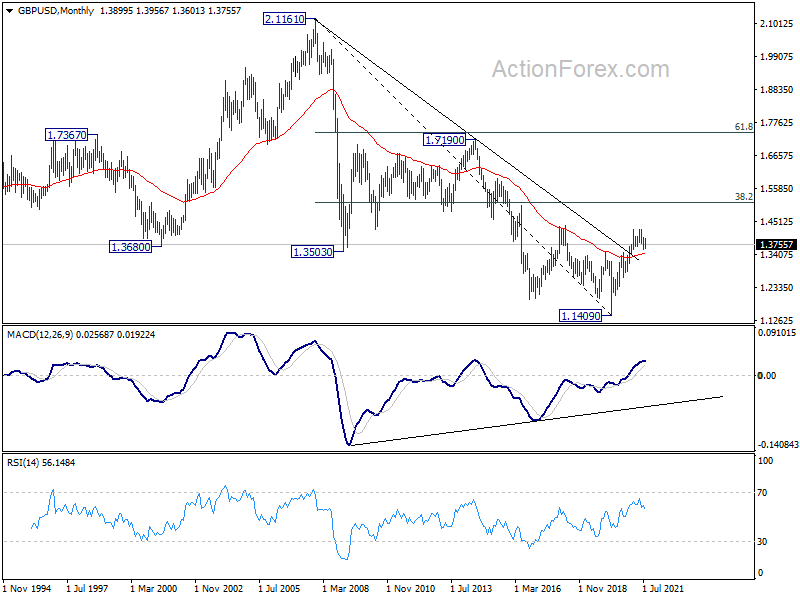
In the longer term picture, a long term bottom should be in place at 1.1409, on bullish convergence condition in monthly MACD. Rise from there would target 38.2% retracement of 2.1161 to 1.1409 at 1.5134. Reaction from there would reveal whether rise from 1.1409 is just a correction, or developing into a long term up trend.
USD/CHF Weekly Outlook
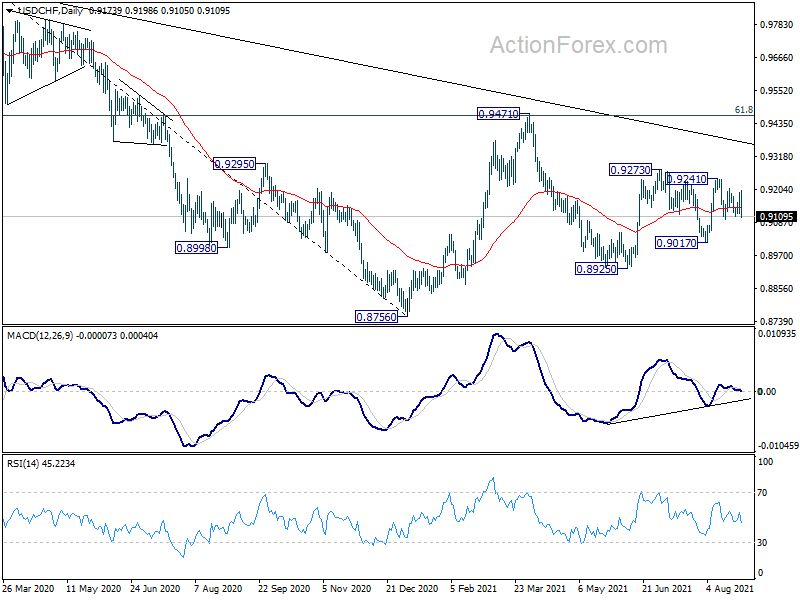
Range trading continued in USD/CHF last week and outlook is unchanged. Initial bias remains neutral this week first. On the downside, break of 0.9098 will target 0.9017 support first. Further break there will likely resume the decline from 0.9471 through 0.8925 low. On the upside, break of 0.9241 resistance should resume the rise from 0.8925 through 0.927.
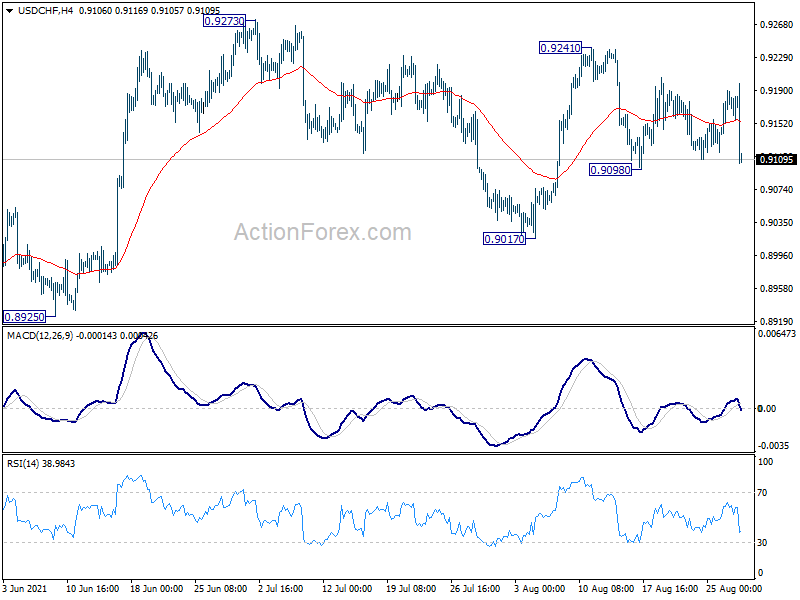
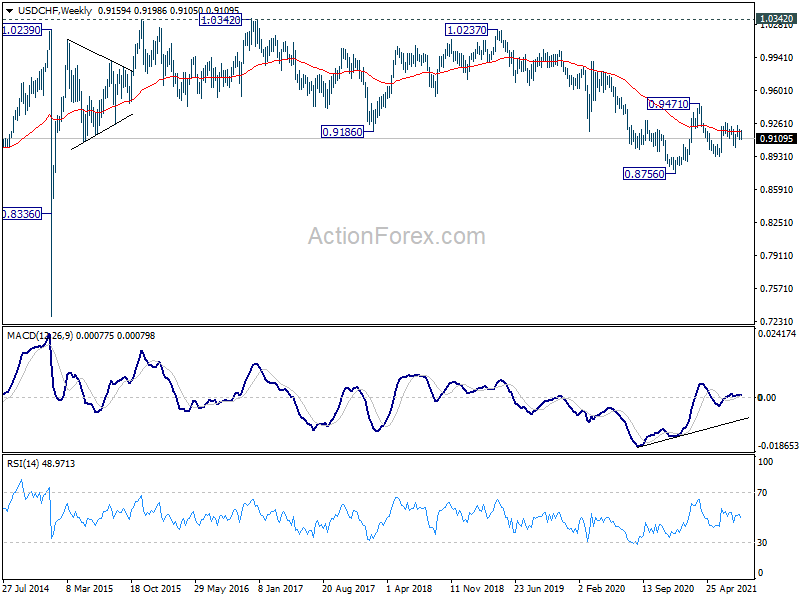
In the bigger picture, the failure to sustain above 55 week EMA (now at 0.9178) retains medium term bearishness in USD/CHF. Break of 0.8925 support should resume the whole decline form 1.0342 (2016 high) through 0.8756 low. However, break of 0.9273 resistance and sustained trading above 55 week EMA will be an early sign of bullish trend reversal. Focus will then turn to 0.9471 resistance for confirmation.
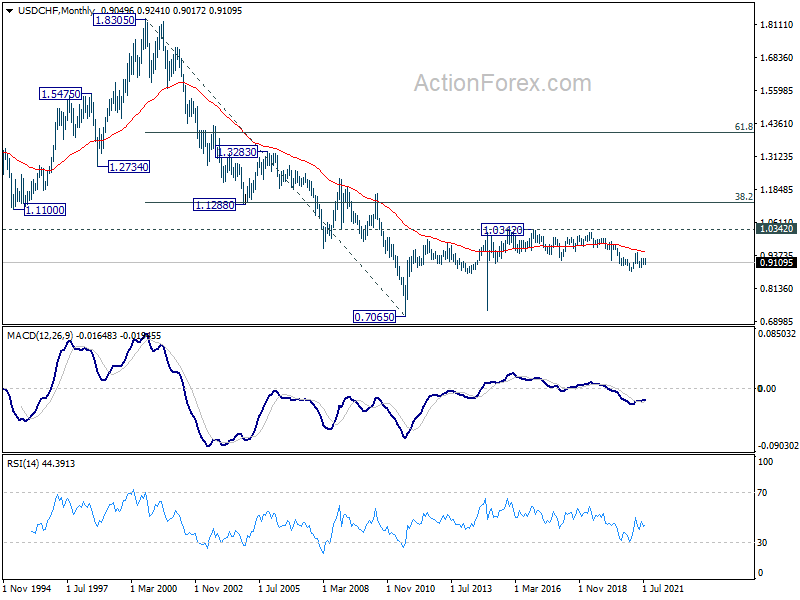
In the long term picture, price actions from 0.7065 (2011 low) are currently seen as developing into a long term corrective pattern, at least until a firm break of 1.0342 resistance.
AUD/USD Weekly Outlook
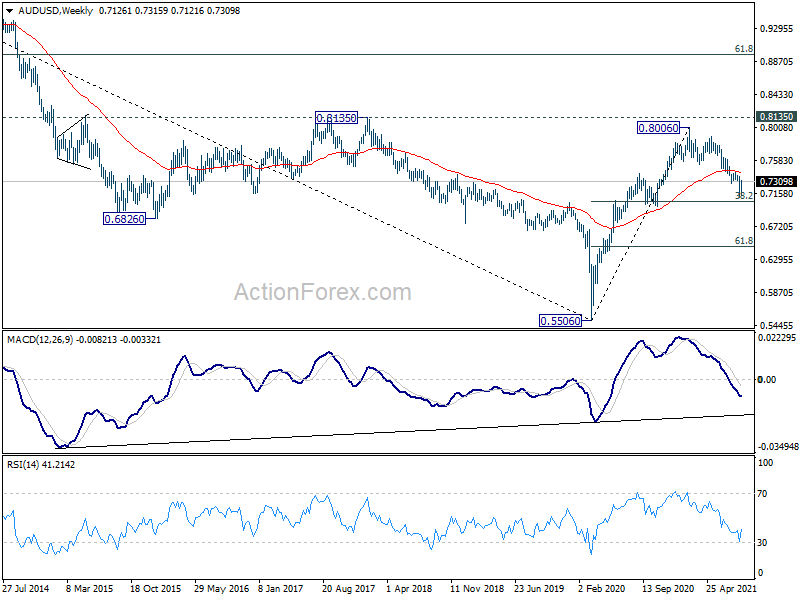
AUD/USD's rebound from 0.7105 extended higher last week. Break of 0.7288 support turned resistance indicates short term bottoming. Initial bias stays on the upside this week for 0.7425 resistance next. Sustained break there will argue that whole correction from 0.8006 has completed at 0.7105 already, just above 0.6991/7051 support zone. Stronger rise would be seen to 0.7530 support turned resistance for confirmation. On the downside, below 0.7221 minor support will turn bias back to the downside for 0.7105 and possibly below. But we'd continue to look for strong support from 0.6991/7051 cluster support to bring rebound.
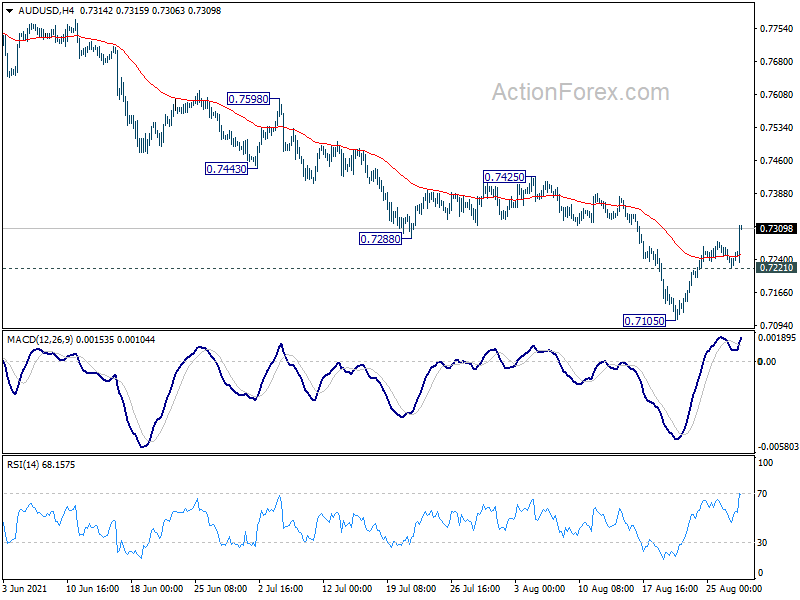
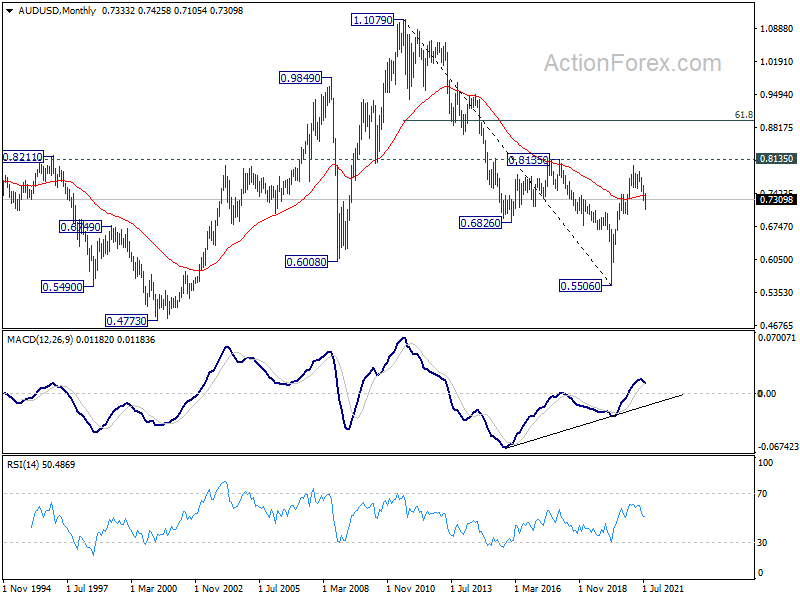
In the bigger picture, rise from 0.5506 medium term bottom could have completed at 0.8006, after failing 0.8135 key resistance. Correction from there could target 0.6991 cluster support (38.2% retracement of 0.5506 to 0.8006 at 0.7051). We'd look for strong support from there to bring rebound. However, sustained break of this level would argue that the whole medium term trend has indeed reversed. Deeper decline would be seen to 61.8% retracement at 0.6461.
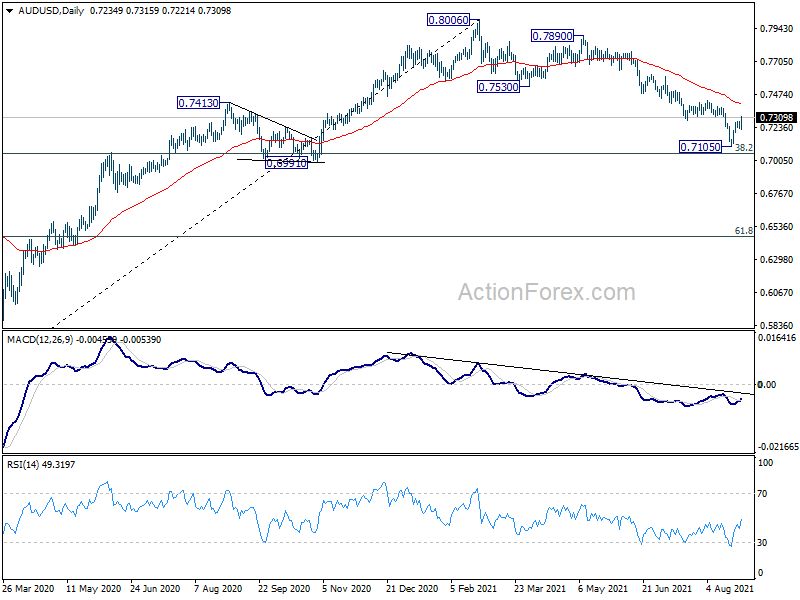
In the longer term picture, rise from 0.5506 could have completed at 0.8006. Subsequent fall is now seen as a correction only. As long as 0.6991 structural support holds, we'd expect another rise through 0.8006 at a later stage. However, sustained break of 0.6991 would argue that the trend has reversed and put 0.5506 low back into radar.