Sample Category Title
USD/CAD Weekly Outlook
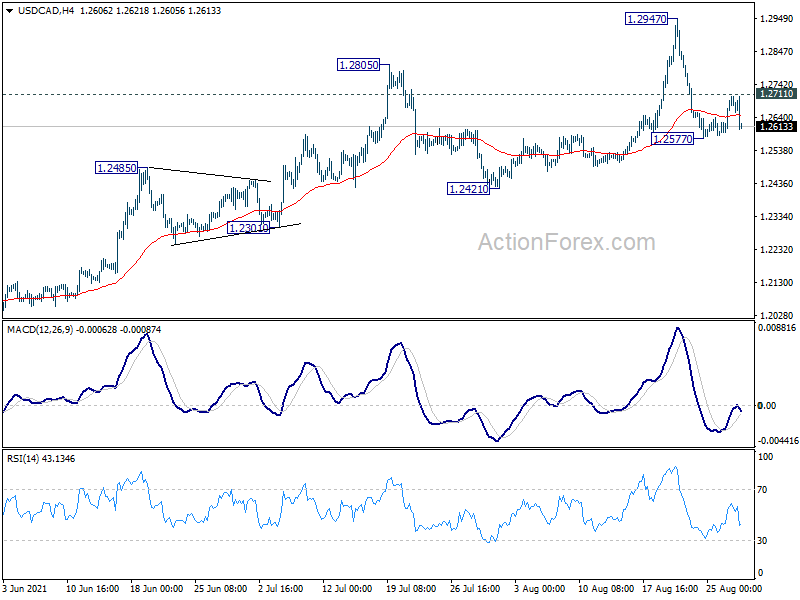
USD/CAD dropped to 1.2577 last week and turned sideway since then. Initial bias is neutral this week first. Another fall is in favor as long as 1.2711 minor resistance holds. Below 1.2577 will target 1.2421 structural support. Sustained break there will suggest rejection by 1.3022 fibonacci level. Rise from 1.2005 could have completed in this case and deeper fall would be seen to retest this low. On the upside, break of 1.2711 will retain near term bullishness, and turn bias back to the upside for retesting 1.2947 high.
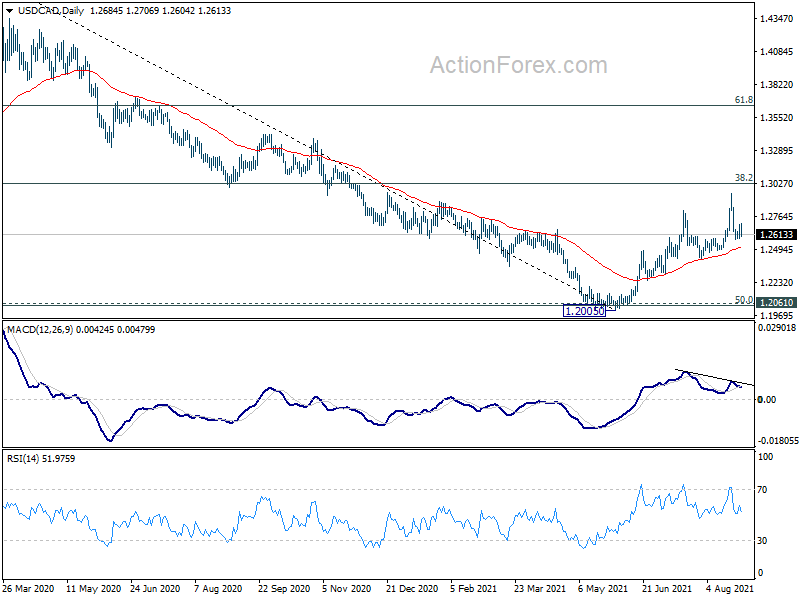
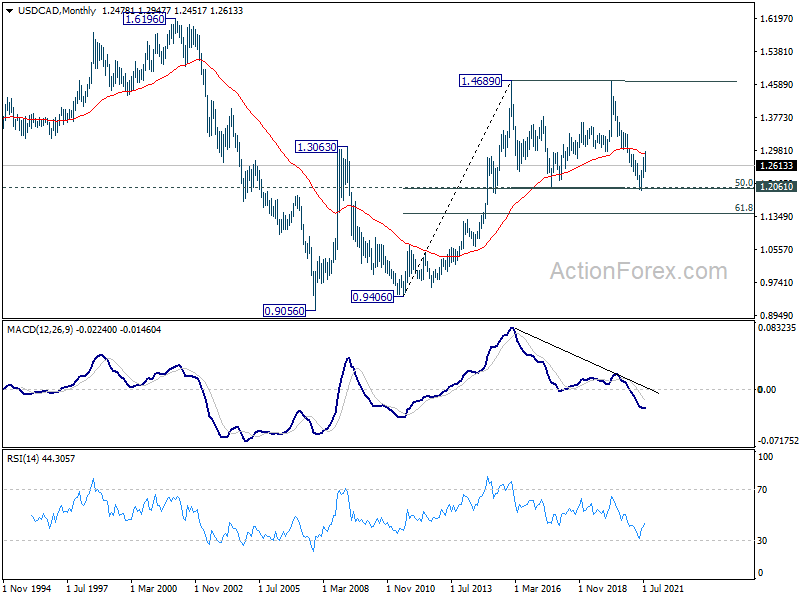
In the bigger picture, fall from 1.4667 is seen as the third leg of the corrective pattern from 1.4689 (2016 high). It should have completed after hitting 1.2061 (2017 low) and 50% retracement of 0.9406 to 1.4689 at 1.2048. Sustained break of 38.2% retracement of 1.4667 to 1.2005 at 1.3022 will pave the way to 61.8% retracement at 1.3650 and above. Overall, medium term outlook remains neutral at worst with 1.2048/61 support zone intact.
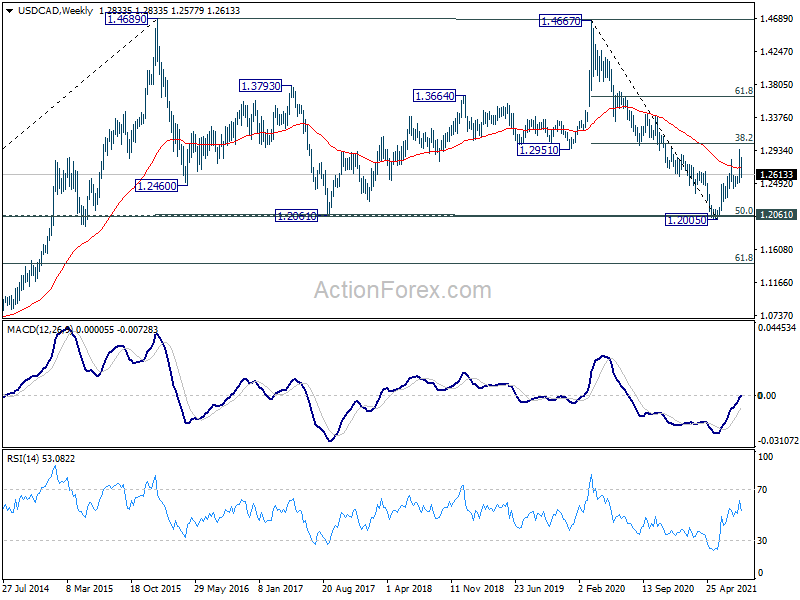
In the longer term picture, we're viewing price actions from 1.4689 as a consolidation pattern. Thus, up trend from 0.9506 (2007 low) is still expected to resume at a later stage. This will remain the favored case as long as 1.2061 support holds, which is close to 50% retracement of 0.9406 to 1.4689 at 1.2048. Firm break of 1.4689 will pave the way to 1.6196 high next.
GBP/JPY Weekly Outlook
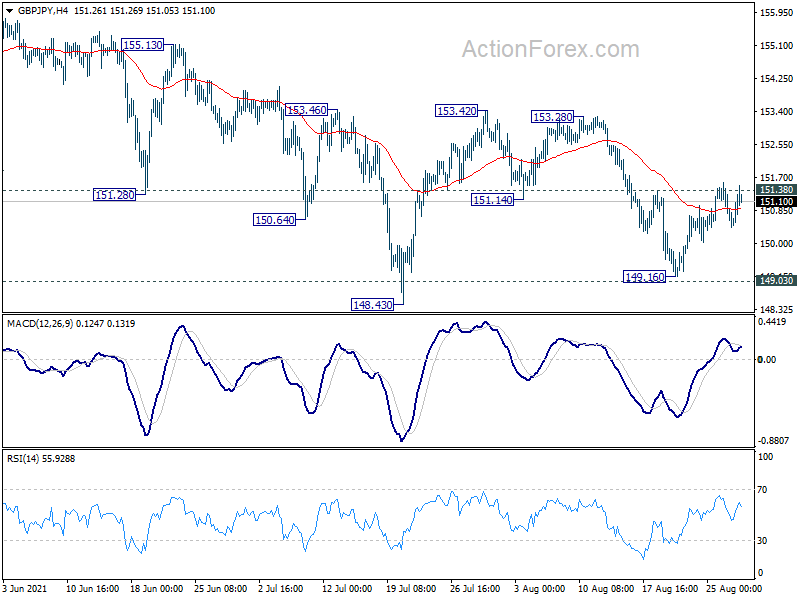
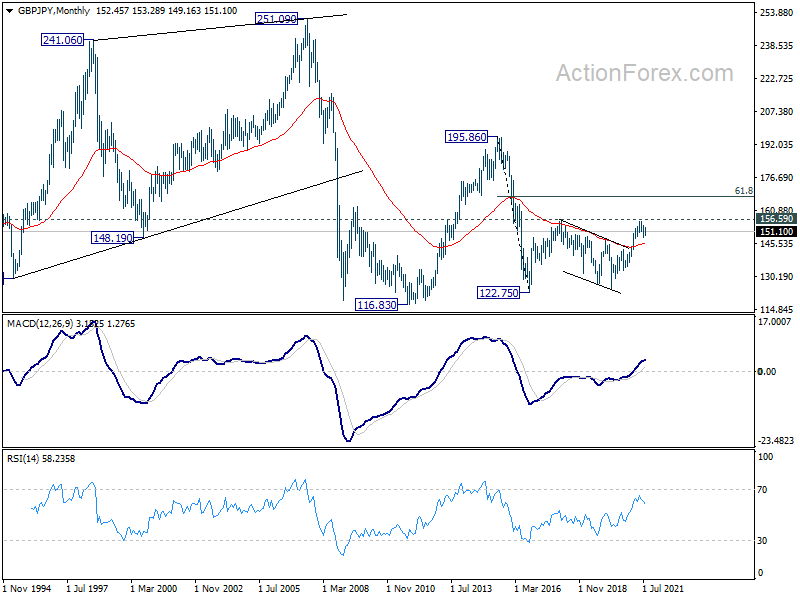
GBP/JPY rebounded last week but failed to sustain above 151.38 resistance. Initial bias remains neutral this week first. On the upside, firm break of 151.38 will turn bias to the upside for 153.42 resistance first. Break there will argue that whole corrective pattern from 156.05 has completed, and bring retest of this high. On the downside, however, decisive break of 149.03 support will carry larger bearish implication and target 143.78 fibonacci level next.
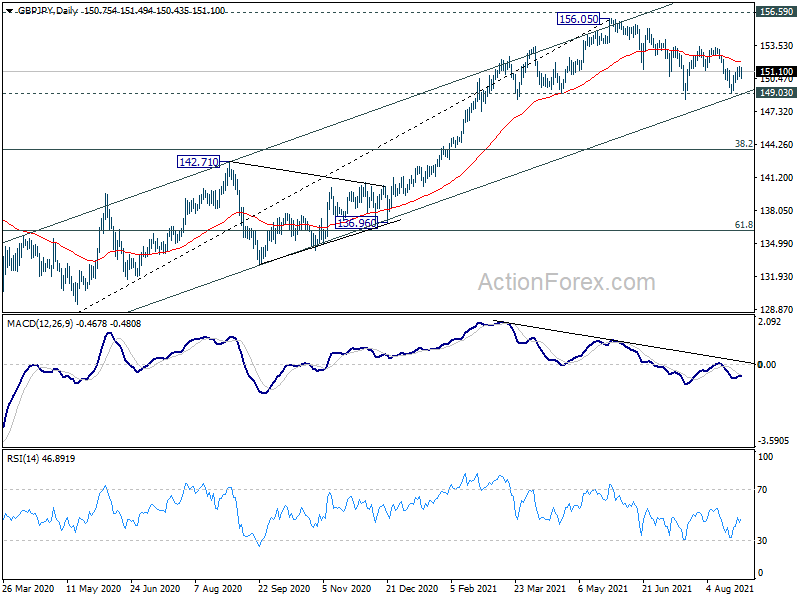
In the bigger picture, rise from 123.94 is seen as the third leg of the pattern from 122.75 (2016 low). As long as 149.03 support holds, such rise would still resume at a later stage. However, sustained break of 149.03 support will indicate rejection by 156.59. Fall from 156.05 would be at least correcting the whole rise from 123.94. Deeper fall would be seen back 38.2% retracement of 123.94 to 156.05 at 143.78 first.
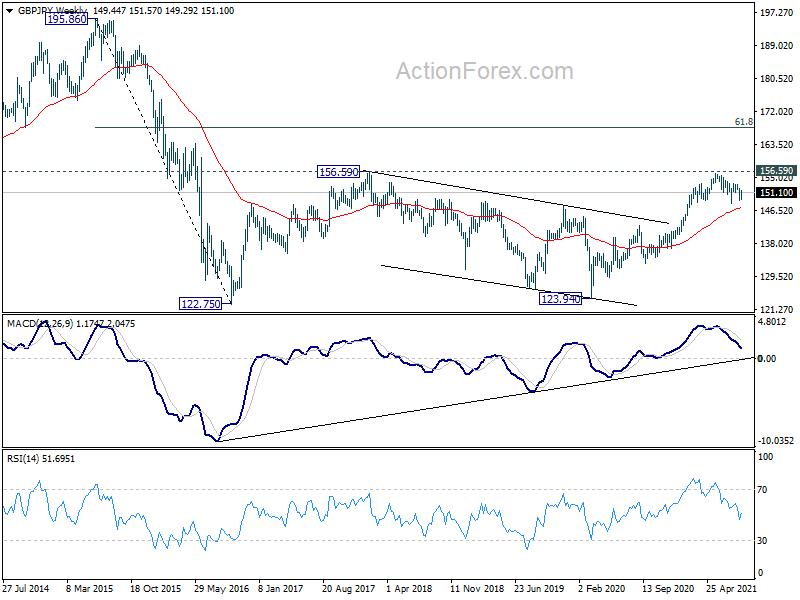
In the longer term picture, the strong break of 55 months EMA was an early sign of long term bullish reversal. Firm break of 156.69 resistance should now confirm the start of an up trend for 195.86 (2015 high). However, rejection by 156.69 will invalidate the bullish signal and keep long term outlook neutral first.
EUR/JPY Weekly Outlook
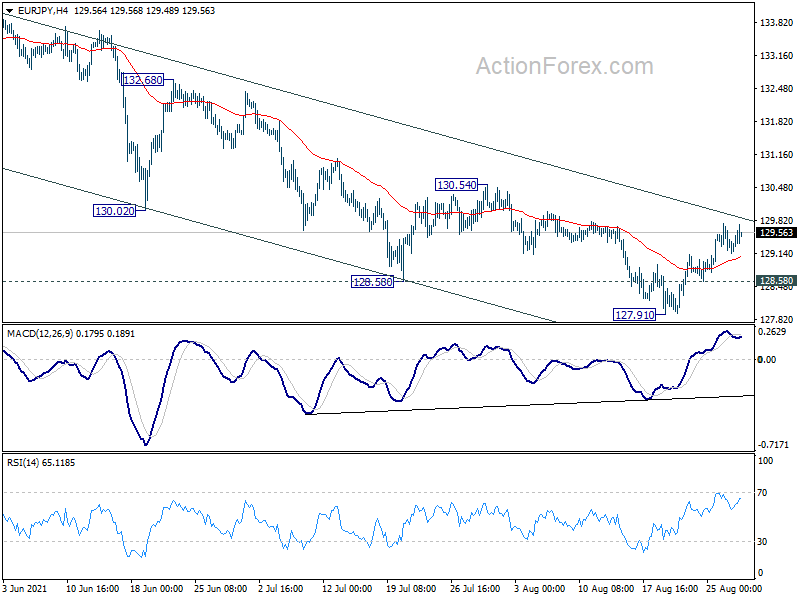
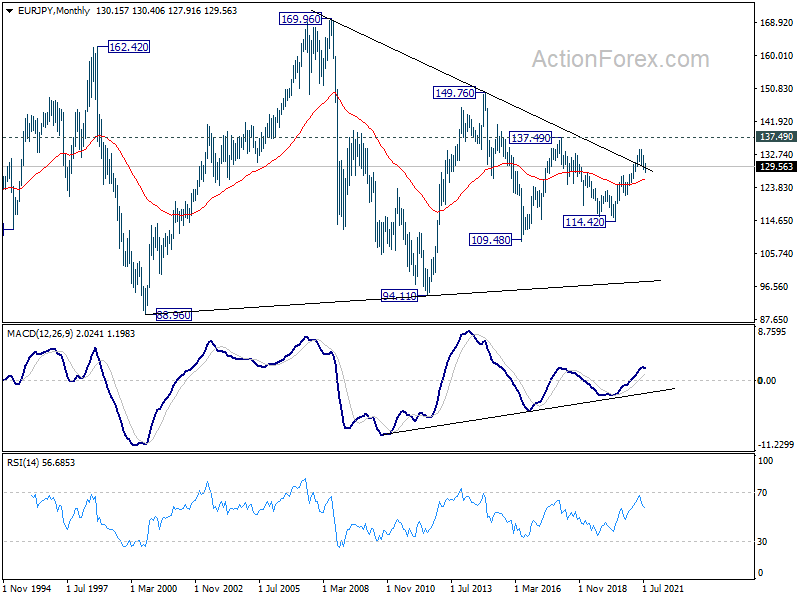
EUR/JPY's rebound from 127.91 extended higher last week. A short term bottom should be in place on bullish convergence condition in 4 hour MACD. Initial bias stays mildly on the upside this week for 130.54 resistance first. Sustained break there will argue that whole correction from 134.11 has completed and turn near term outlook bullish. Nevertheless, on the downside, below 128.58 minor support will turn bias back to the downside for retesting 127.91 low instead. Break will target 127.07 resistance turned support. That is close to 38.2% retracement of 114.42 to 134.11 at 126.58.
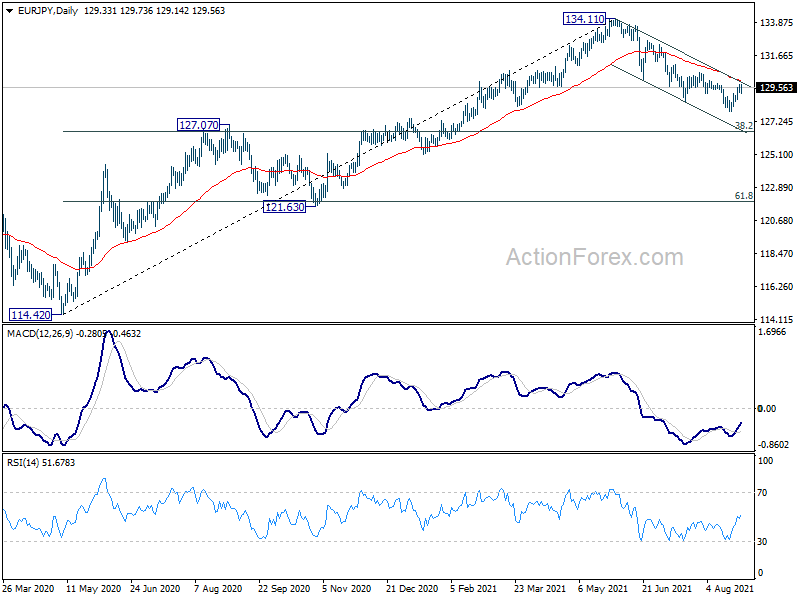
In the bigger picture, rise from 114.42 is seen as a medium term rising leg inside a long term sideway pattern. As long as 127.07 resistance turned support holds, further rise is still expected to retest 137.49 (2018 high). However, firm break of 127.07 will argue that the medium term trend has reversed, deeper fall would be seen to 61.8% retracement of 114.42 to 134.11 at 121.94.
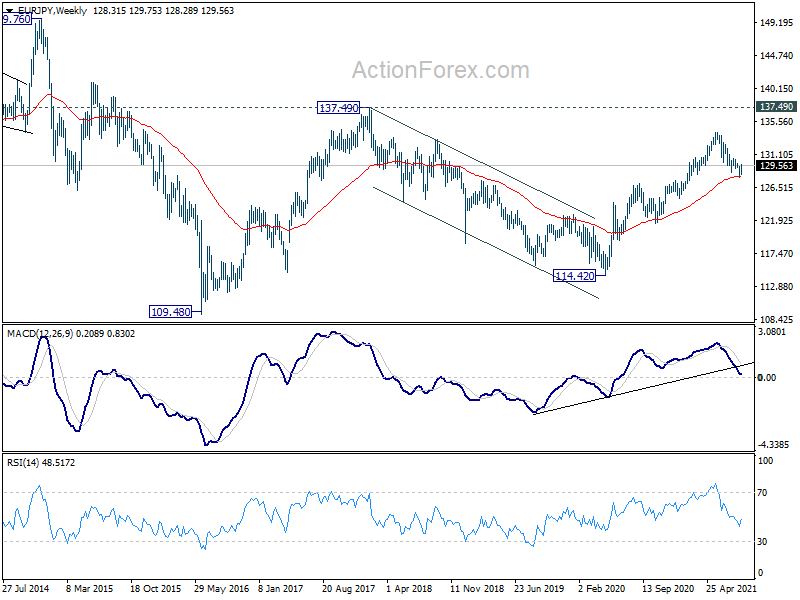
In the long term picture, EUR/JPY is staying in long term sideway pattern, established since 2000. Another rising leg in progress for 137.49 resistance and above.
EUR/GBP Weekly Outlook
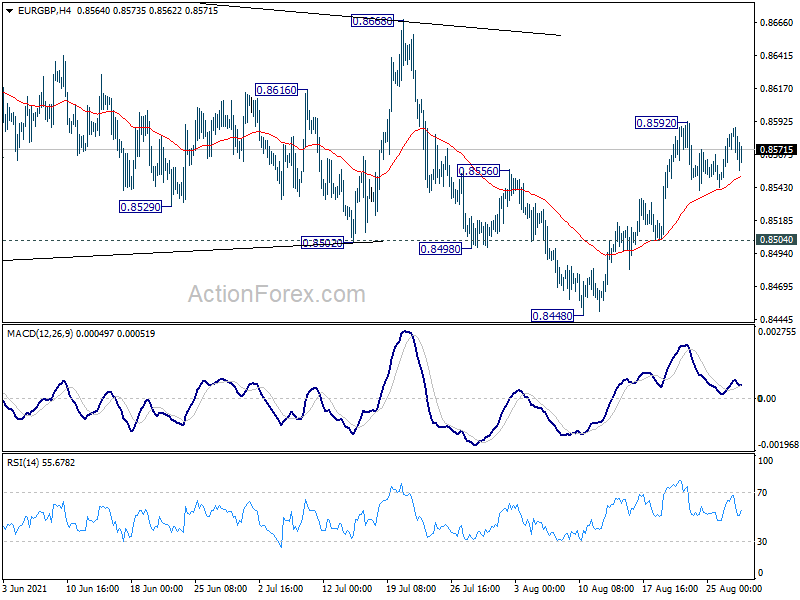
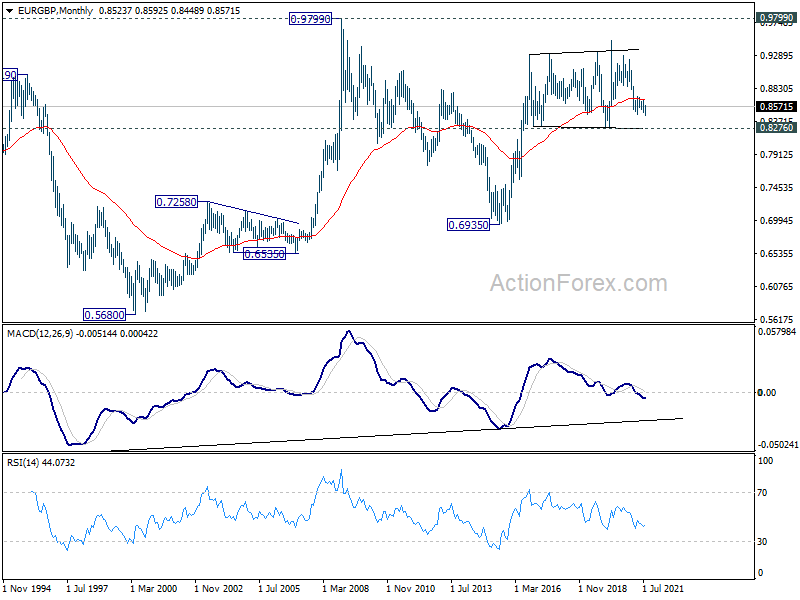
EUR/GBP edged higher to 0.8592 last week but turned sideway since then. Initial bias remains neutral this week first. Further rise is expected as long as 0.8504 support holds. On the upside, above 0.8592 will resume the rise form 0.8448 to 0.8668 resistance next. Firm break there will be a strong sign of near term bullish reversal at least On the downside, however, break of 0.8504 will turn bias back to the downside for retesting 0.8448 low instead.
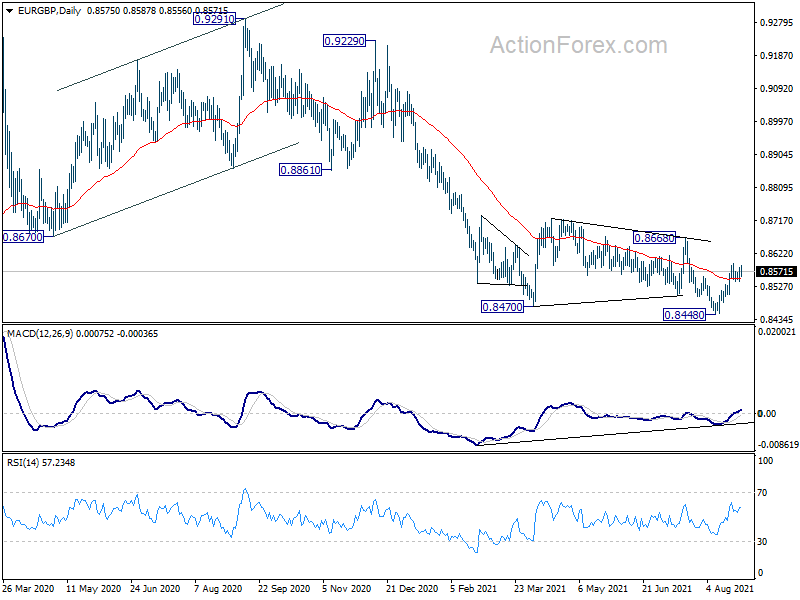
In the bigger picture, price actions from 0.9499 (2020 high) are still seen as developing into a corrective pattern. Deeper fall could be seen as long as 0.8668 resistance holds, towards long term support at 0.8276. However, firm break of 0.8668 resistance would argue that a medium term bottom was already formed. Stronger rise would be seen to 0.8861 support turned resistance to confirm completion of the corrective pattern.
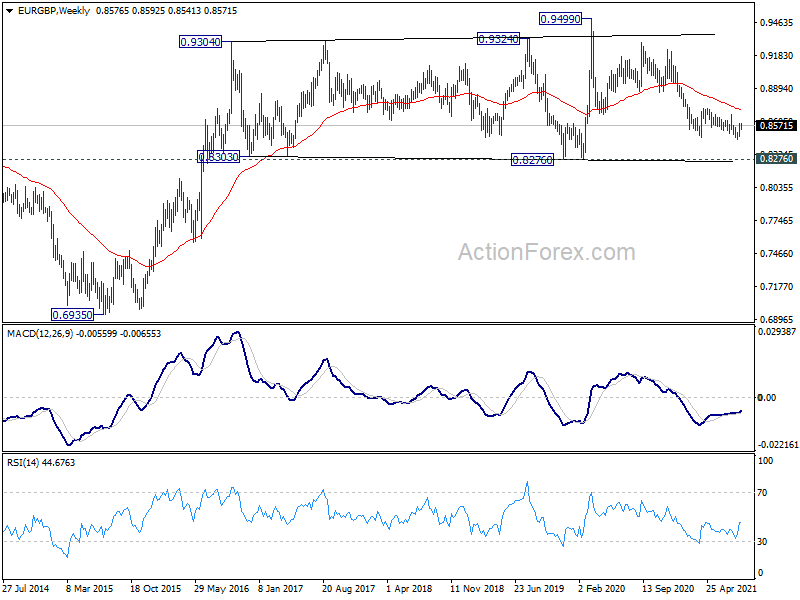
In the long term picture, outlook will stay bullish as long as 0.8276 support holds. Break of 0.9499 is in favor at a later stage, to resume the up trend from 0.6935 (2015 low).
EUR/AUD Weekly Outlook
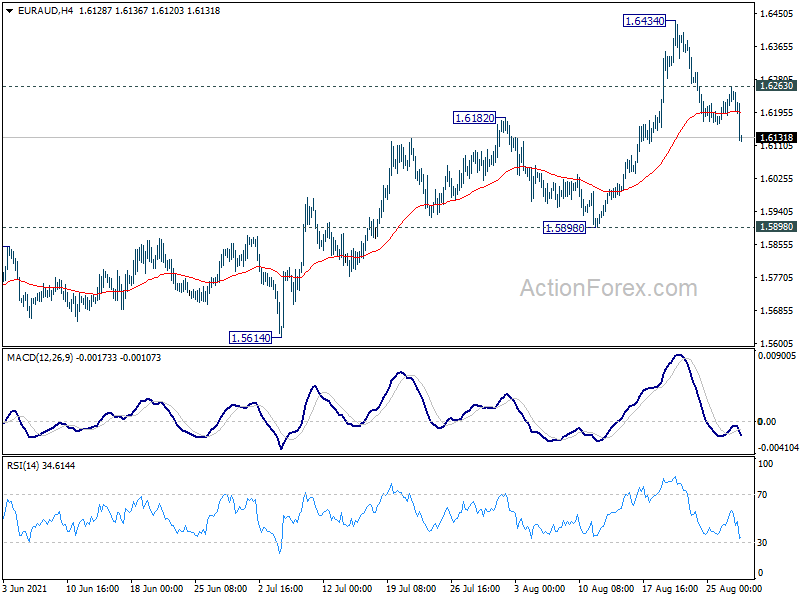
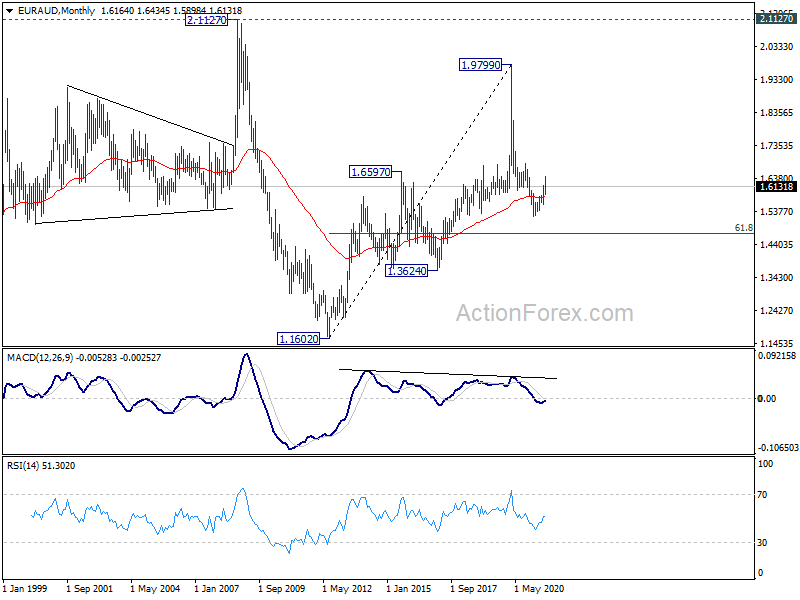
EUR/AUD's break of 1.6182 support turned resistance last week indicates short term topping at 1.6434 already. Initial bias is back on the downside for 1.5898 structural support first. Sustained break there will argue that choppy rise from 1.5250 has completed already. Outlook will be turned bearish for retesting 1.5250 low. On the upside, though, above 1.6263 minor resistance will retain near term bullishness, and turn bias back to the upside for 1.6434 high instead.
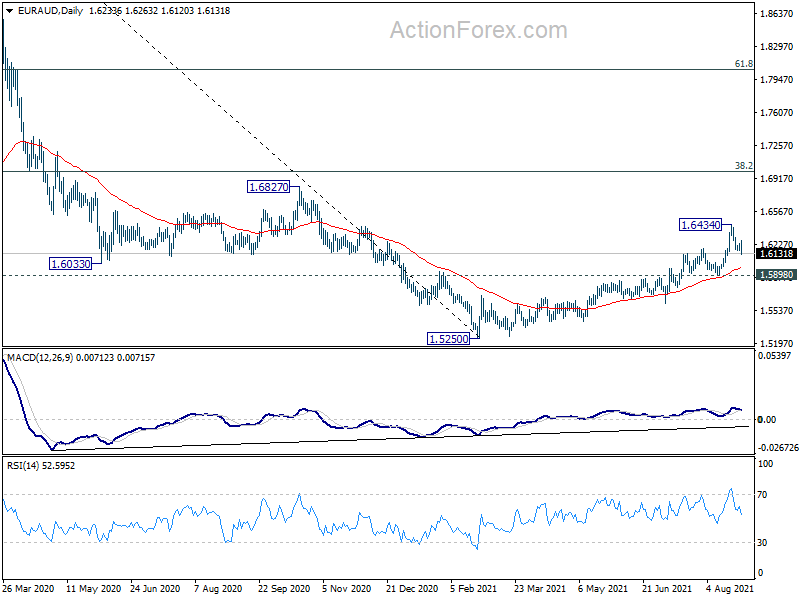
In the bigger picture, rise from 1.5250 medium term bottom is currently seen as a correction to the down trend from 1.9799 first. Stronger rise would be seen to 38.2% retracement of 1.9799 to 1.5250 at 1.6988 next. We'd tentatively expect strong resistance from there to limit upside, at least on first attempt. Meanwhile, break of 1.5898 support will indicate that the rebound has completed and bring retest of 1.5250 low.
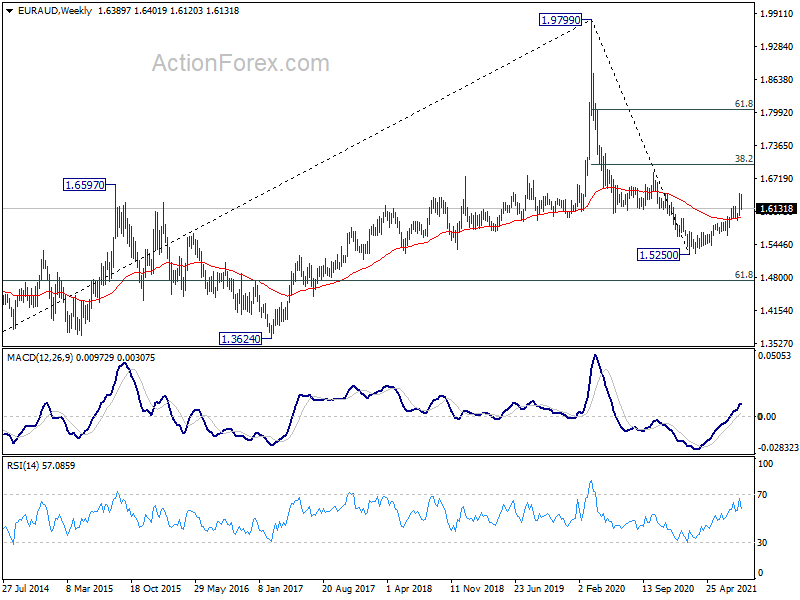
In the longer term picture, rise from 1.1602 (2012 low) should have already completed with three waves up to 1.9799 (2020 high). Fall from there is seen as a medium term to long term down leg as a long term down trend, or a sideway pattern. We'll assess the odds again at a later stage.
EUR/CHF Weekly Outlook
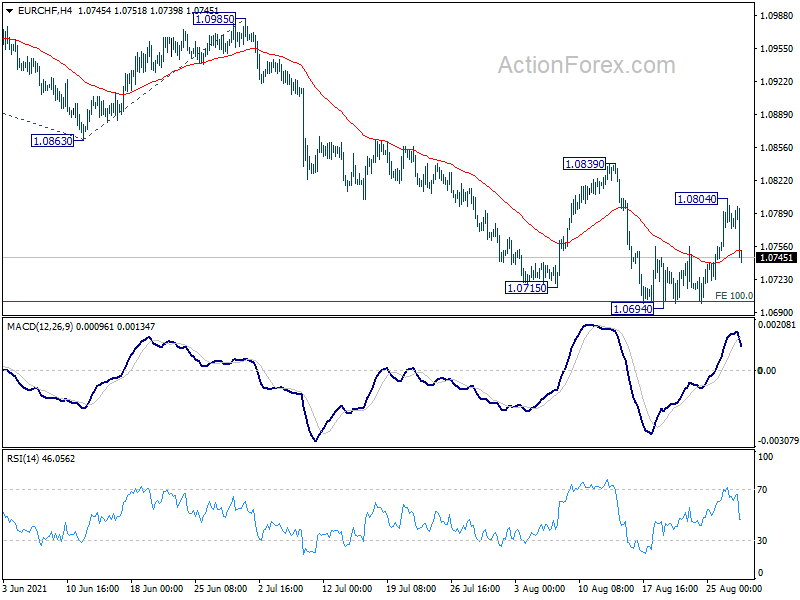
EUR/CHF rebounded to as high as 1.0804 last week but retreated sharply since then. Initial bias remains neutral this week first. With 1.0839 resistance intact, outlook remains bearish and further decline is expected. On the downside, firm break of 1.0694 will resume larger fall from 1.1149, to 138.2% projection of 1.1149 to 1.0863 from 1.0985 at 1.0590 next.
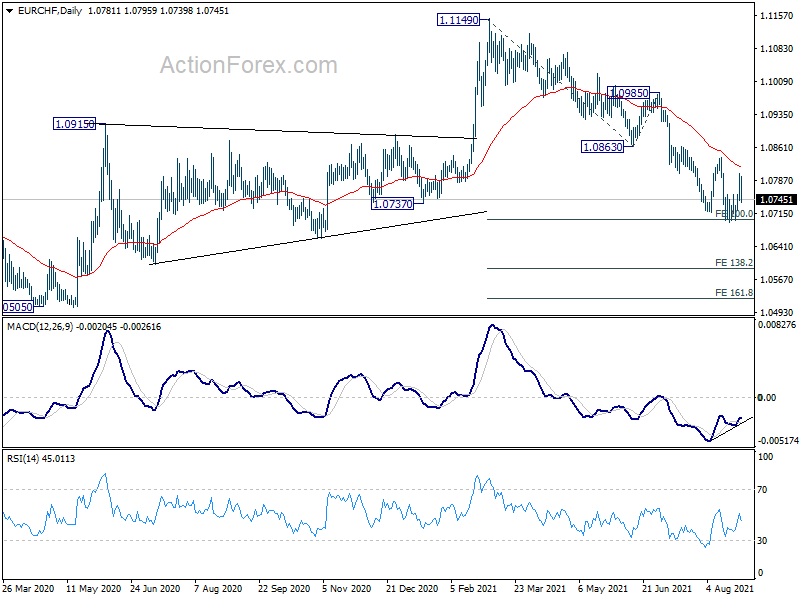
In the bigger picture, rebound from 1.0505 (2020 low) should have completed at 1.1149 already. The three-wave corrective structure argues that the downtrend from 1.2004 (2018 high) is not over yet. Medium term outlook will now stay bearish as long as 55 week EMA (now at 1.0859) holds. Break of 1.0505 low would be seen at a later stage.
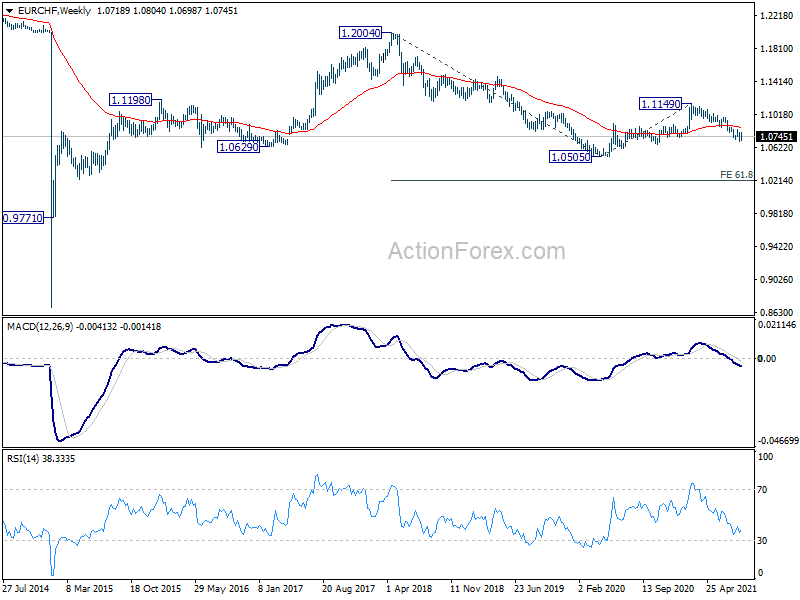
In the long term picture, rejection by 55 month EMA (now at 1.1056) retains long term bearishness. Break of 1.0505 low will resume down trend to 61.8% projection of 1.2004 to 1.0505 to 1.1149 at 1.0223.
Stocks at New Record, Dollar Plummeted, Aussie Turning Around
Fed Chair Jerome Powell's speech at the Jackson Hole Symposium didn't disappoint. He did what the markets expected, affirming the openness for beginning tapering this year, without indicating the need for an imminent start. Just as Philadelphia Fed President Patrick Harker described, Powell laid out where the center of the FOMC is in terms of policy. US stocks cheered the speech with S&P 500 and NASDAQ closing at record highs.
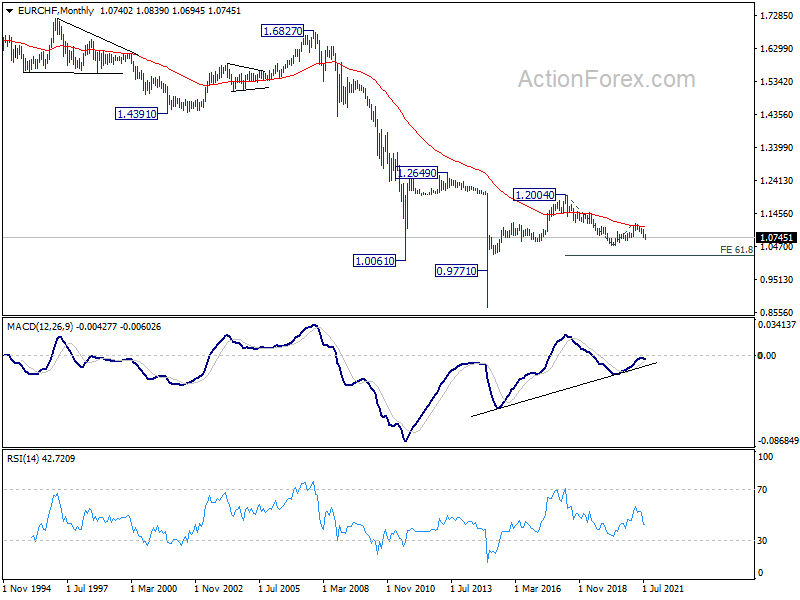
In the currency markets, Dollar was sold off notably after Powell and end the week as the second worst performer. Yen was the weakest following rebound in major global yields, while Swiss Franc was third. On the other hand, commodity currencies closed as the strongest ones, led by New Zealand Dollar.
Development in Gold suggests that more downside in now in favor in the greenback. We'd like to see break of 1.1804 resistance in EUR/USD and 1.3785 resistance in GBP/USD very soon to affirm this case. Meanwhile, Aussie has the potential to outperform ahead, given that vaccination is speed up and investors are starting to look through the current lockdowns.
NASDAQ and S&P closed at new record highs, more upside ahead
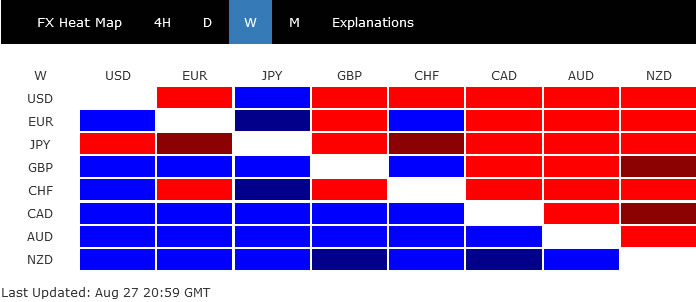
After some initial hesitation, NASDAQ surged on Friday to close at new record high at 15129.50 last week. Most importantly, it managed to close well above 15000 handle, as well as 61.8% projection of 10822.57 to 14175.11 from 13002.53 at 15074.39. Daily MACD is trending up, suggesting there might be some upside acceleration ahead.
In any case, near term outlook will stay bullish as long as last week's low as 14776.98 holds. We might see NASDAQ picking up momentum further and target 100% projection at 16355.07 next.
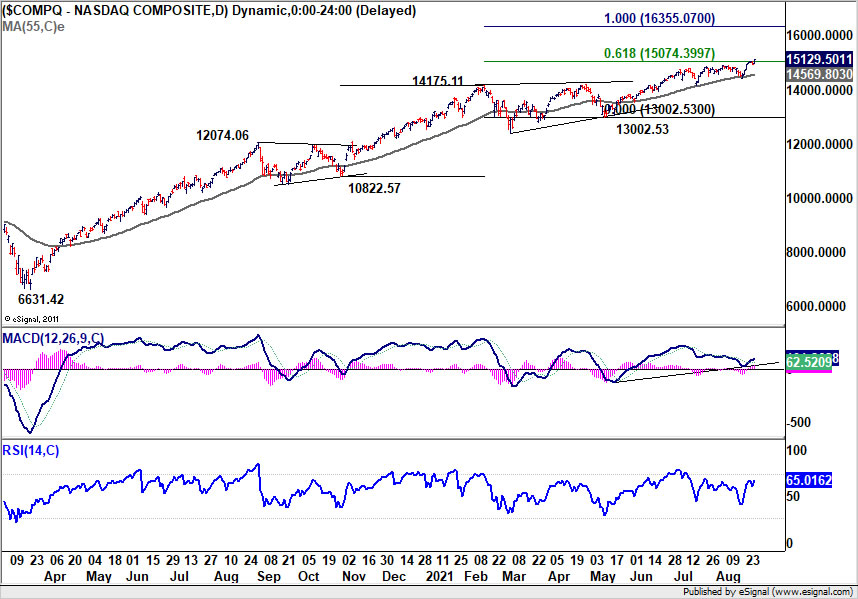
S&P 500 also closed at 4509.37 record high, and above 4500 handle. Near term outlook will also stay bullish as long as last week's low at 4450.29 holds. It's on track to next target at 100% projection of 2191.86 to 3588.11 from 3233.94 at 4630.19.
10-year yield failed 55 day EMA again, to extend sideway trading
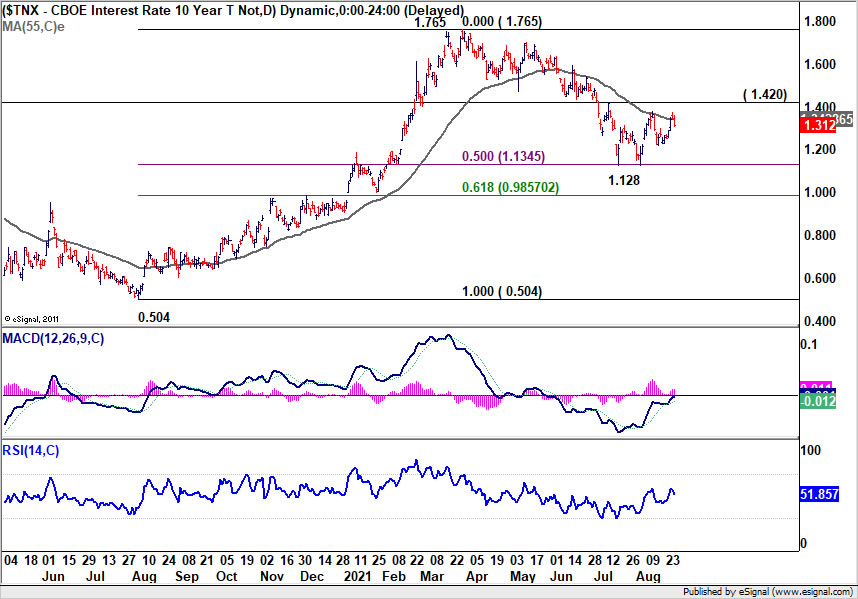
10-year yield tried to rally last week but again failed to sustain above 55 day EMA. Near term outlook is mixed for the moment. 50 % retracement of 0.504 to 1.765 at 1.134 should provide a solid floor in case of another decline, unless we have something drastic happening. However, TNX will still need to sustain above 55 day EMA, and break through 1.142 resistance decisively, to confirm completion of correction of 1.765. Otherwise, more sideway trading is likely, suggesting some relative indecisiveness among investors.
Focus back on 92.47 near term support in DXY after decline
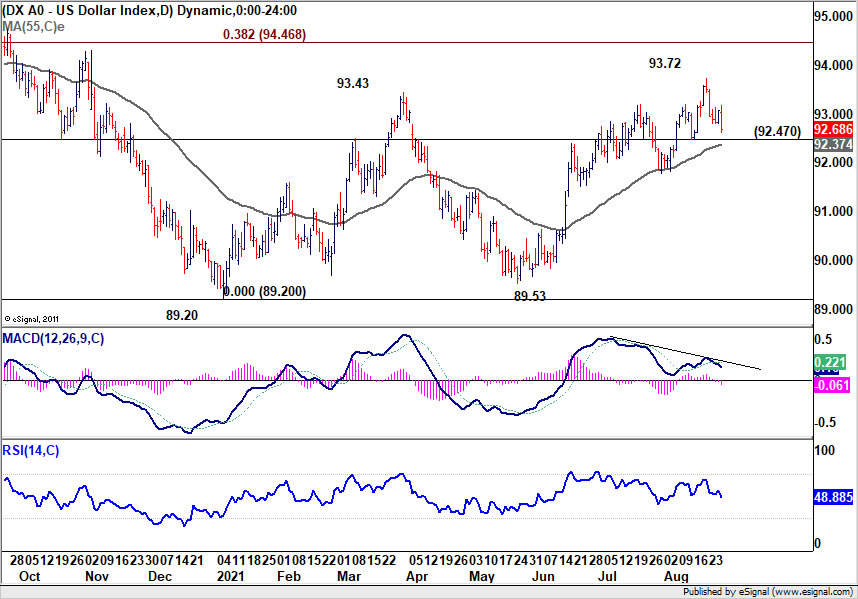
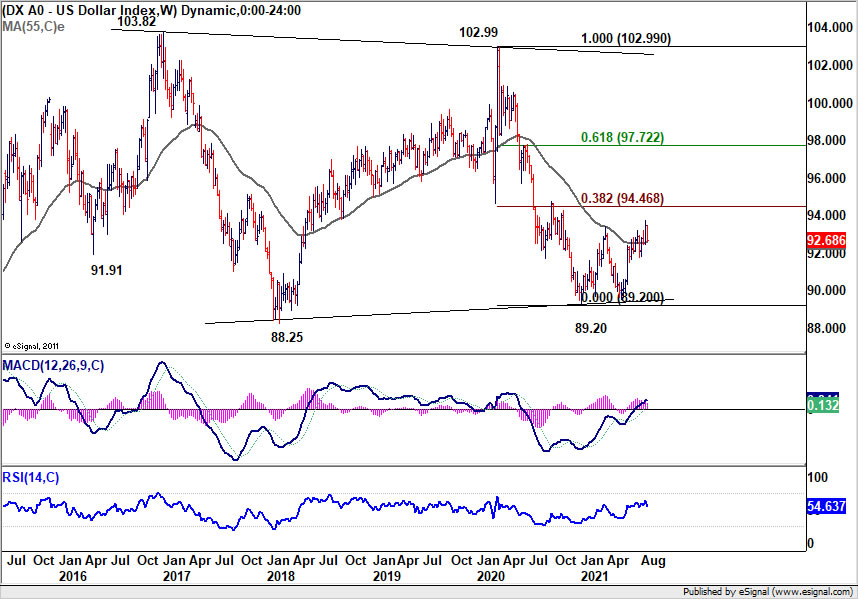
Focus in the Dollar index is back to 92.47 near term support after last week's decline. Firm break there, and sustained trading below 55 day EMA (now at 92.37), will argue that rise from 89.53 might be completed at 93.72 already. More importantly, that should be an early sign that whole consolidative pattern from 89.20 has completed, after failing 38.2% retracement of 102.99 to 89.20 at 94.46. Further break of 91.78 support will pave the way back to 89.20/53 support zone.
Gold closed above 55 day EMA, eyeing 1832.47 resistance next
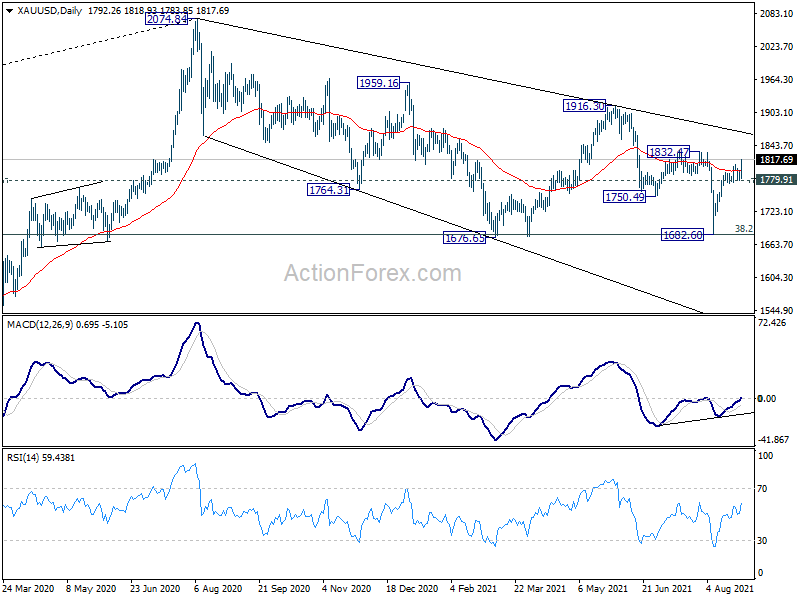
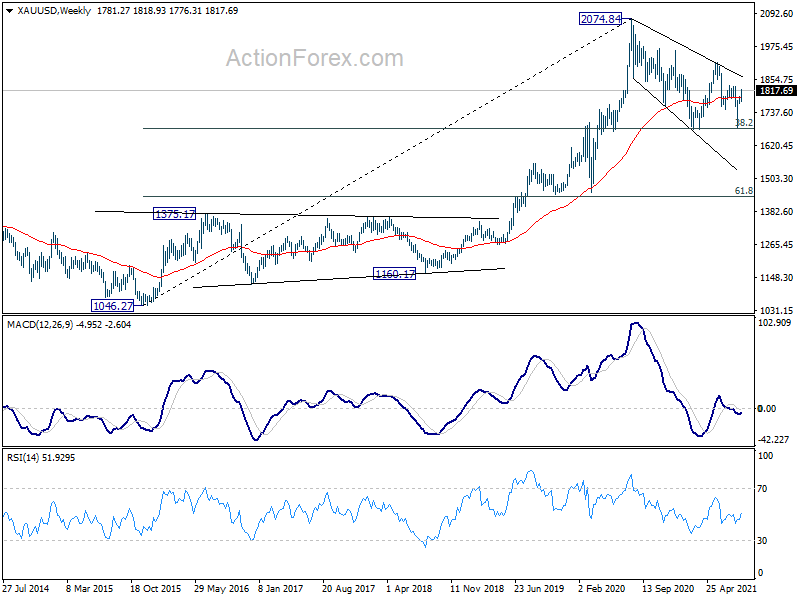
Gold extended the rebound from 1682.60 last week. More importantly, it managed to close above 1800 handle as well as 55 day EMA. Further rise is now expected as long as 1799.91 minor support holds. Firm break of 1832.47 resistance will firstly add to the case the fall from 1916.30 has completed at 1682.60 already. Secondly, that would be an early sign that whole correction from 2074.84 has completed, after drawing support from 38.2% retracement of 1046.27 to 2074.84 at 1681.92. Further rise should be seen to retest 1916.30 resistance at least. Such development would be inline with more Dollar selloff ahead.
The tide for Aussie could have turned, a look at EUR/AUD and AUD/CAD
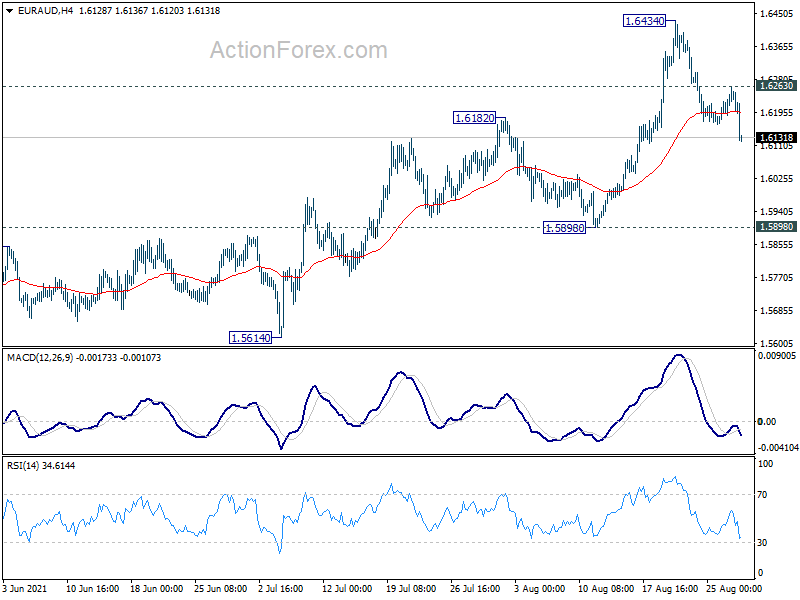
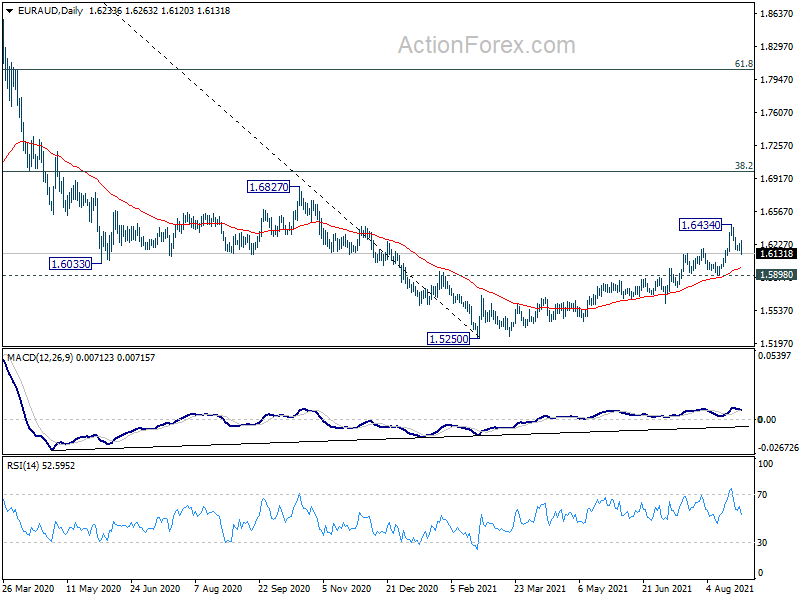
We've noted a few weeks ago that Aussie should be avoided in selling Dollar. But the tide for Aussie could have turned, even though it's still a bit early to confirm. EUR/AUD's break of 1.6182 resistance turned support firstly indicates short term topping at 1.6434 already. More importantly, that's an early sign that choppy rise from 1.5250 has finished too. Deeper fall is now in favor as long as 1.6263 resistance holds, towards 1.5898 structural support. Sustained break there will confirm this bearish case and target a retest on 1.5250 low.
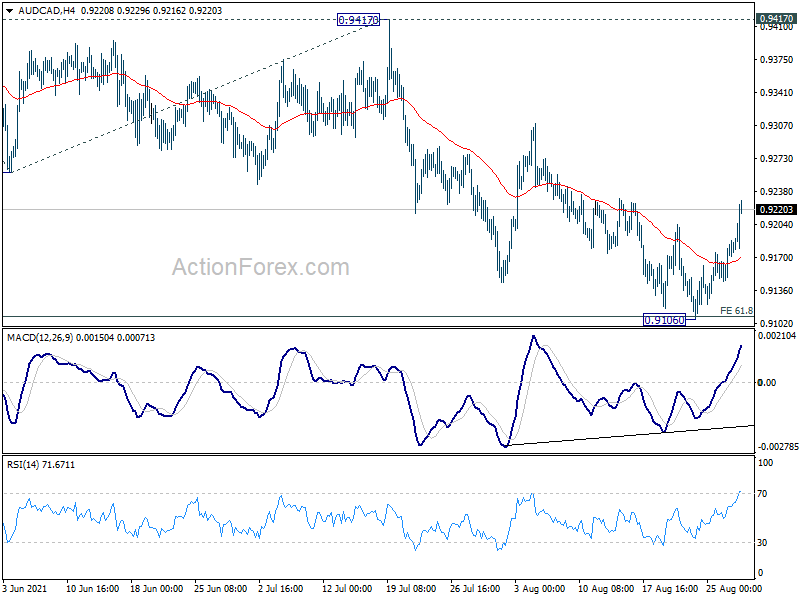
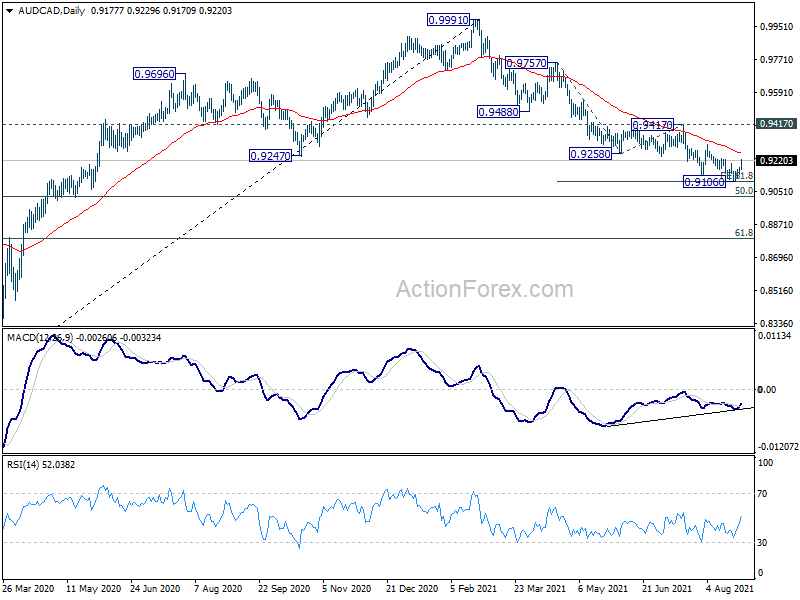
Considering bullish convergence condition in 4 hour MACD, a short term bottom should be formed at 0.9106 in AUD/CAD. That came after hitting 61.8% projection of 0.9757 to 0.9258 from 0.9417 at 0.9109. Immediate focus will now be on 55 day EMA (now at 0.9261) this week. Sustained break there would raise the chance that whole decline from 0.9991 has completed, and bring stronger rise to 0.9417 resistance for confirmation.
EUR/USD Weekly Outlook
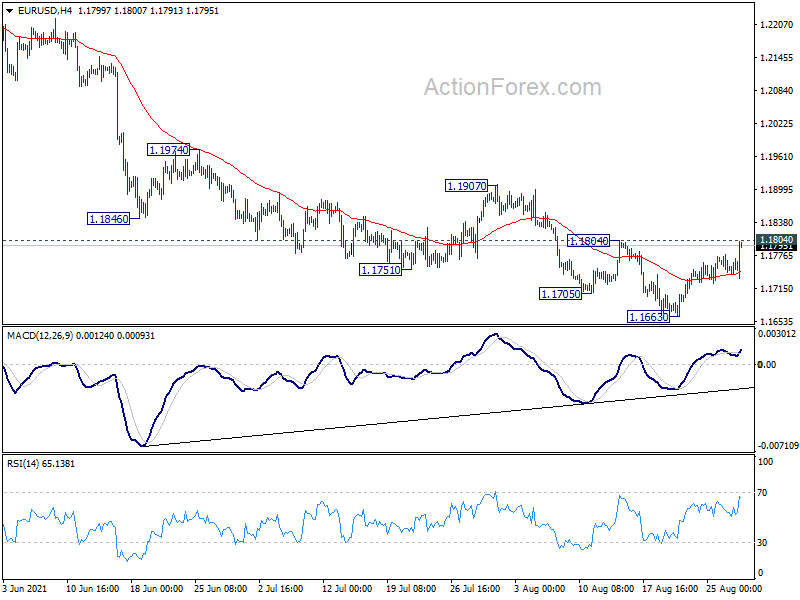
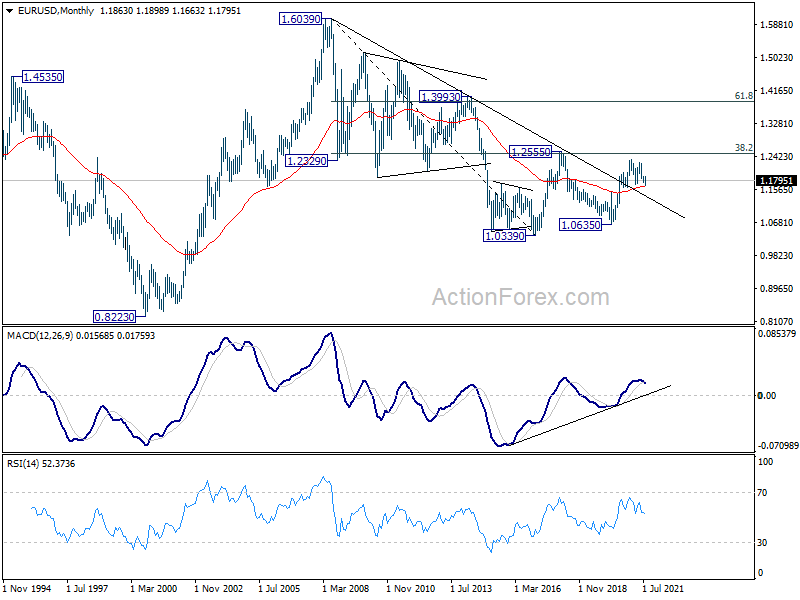
EUR/USD's recovery from 1.1663 extended higher last week but stays below 1.1804 resistance. Initial bias is neutral this week first with immediate focus on 1.1804 resistance. Break there will bring stronger rise to 1.1907 resistance first. Firm break there will indicate that fall from 1.2265, as well as the consolidation pattern from 1.2348, have completed. Near term outlook will be turned bullish for 1.2265/2348 resistance holds. In case of another fall, we'd continue to look for strong support from 1.1602/1703 key support zone to bring rebound.
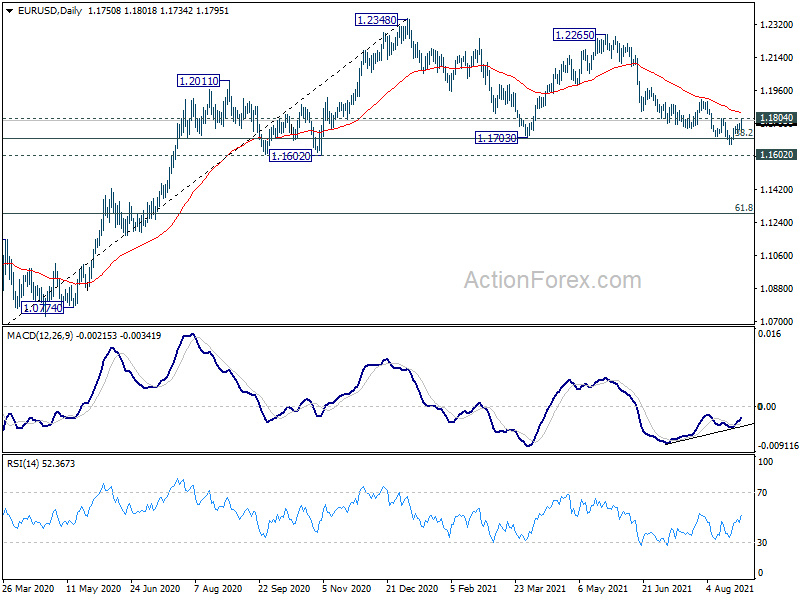
In the bigger picture, rise from 1.0635 is seen as the third leg of the pattern from 1.0339 (2017 low). Further rally remains in favors long as 1.1602 support holds, to cluster resistance at 1.2555 next, (38.2% retracement of 1.6039 to 1.0339 at 1.2516). However sustained break of 1.1602 will argue that the rise from 1.0635 is over, and turn medium term outlook bearish again. Deeper fall would be seen to 61.8% retracement of 1.0635 to 1.2348 at 1.1289 and below.
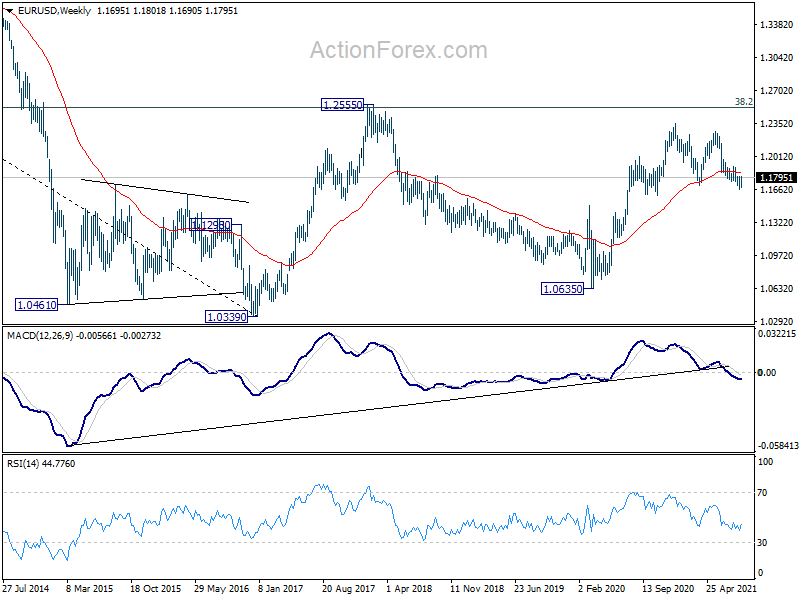
In the long term picture, focus remains on 1.2555 cluster resistance (38.2% retracement of 1.6039 to 1.0339 at 1.2516). Sustained break there should confirm long term bullish reversal and target 61.8% retracement at 1.3862 and above. However, rejection by 1.2555 will keep long term outlook neutral first, and raise the prospect of down trend resumption at a later stage.
Summary 8/30 – 9/3
Monday, Aug 30, 2021
[php_everywhere instance="1"]
Tuesday, Aug 31, 2021
[php_everywhere instance="2"]
Wednesday, Sep 1, 2021
[php_everywhere instance="3"]
Thursday, Sep 2, 2021
[php_everywhere instance="4"]
Friday, Sep 3, 2021
[php_everywhere instance="5"]
Weekly Economic & Financial Commentary: Powell Keeps an Open Mind to Tapering
Summary
United States: Output Continues to Ramp Up as COVID Surges Higher
- Output continues to ramp up across the U.S., even as the resurgence in COVID cases is leading to some pullback in consumer engagement. The need to rebuild inventories should keep production rising, even if consumer spending moderates a bit further. Housing is already beginning to move into better balance, with rising inventories of existing homes beginning to moderate soaring home prices. Inventories of new homes have also increased, although most of the gain is in developed lots and homes under construction.
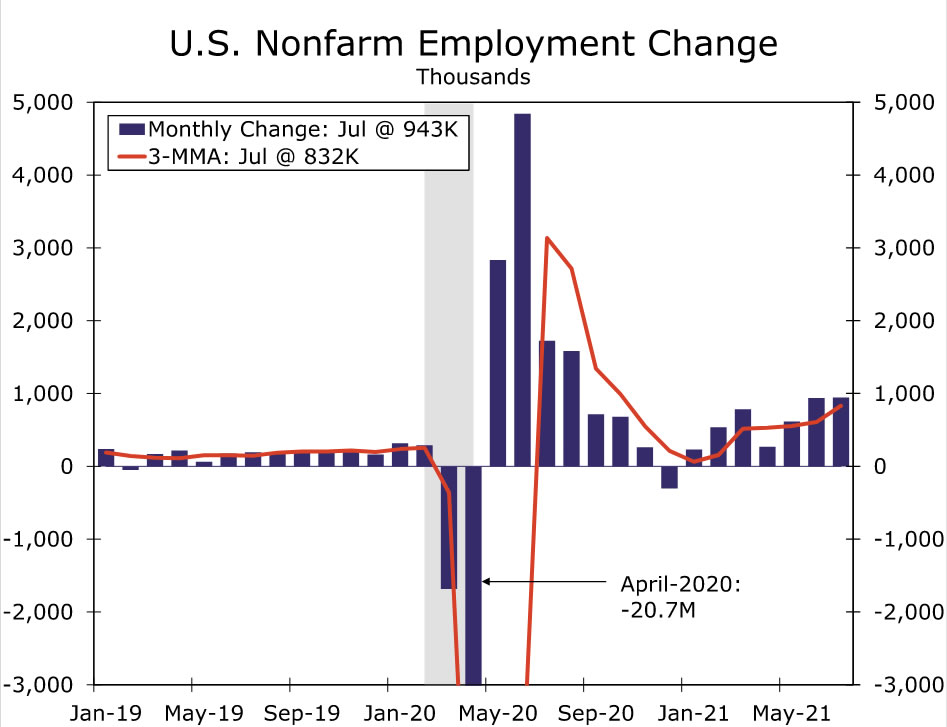
- Next week: Construction Spending (Wed), ISM Manufacturing (Wed), Employment (Fri)
International: Eurozone Economy Still Showing Solid Momentum
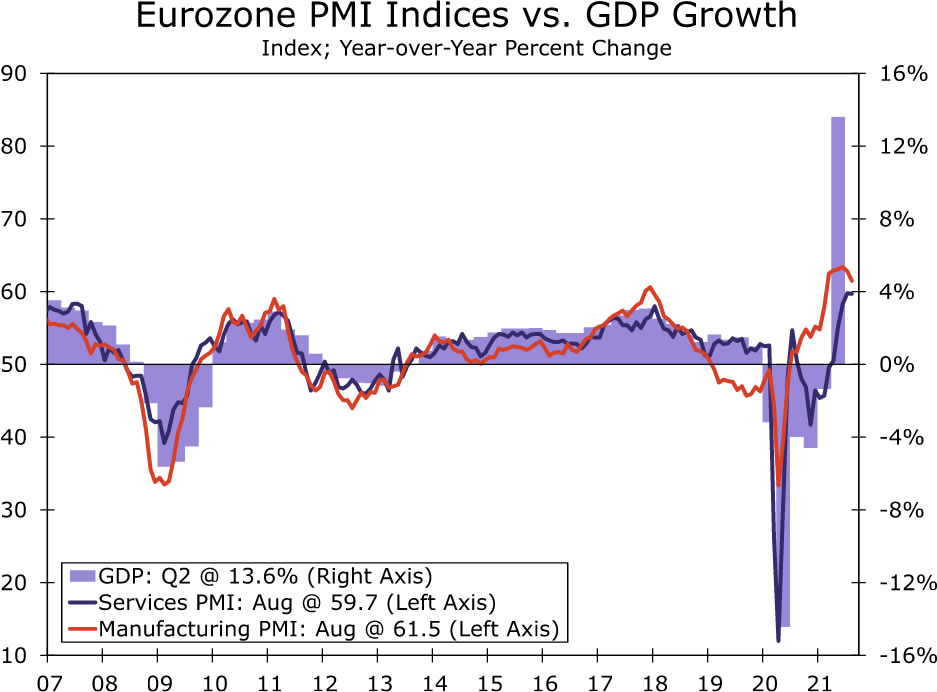
- After the Eurozone economy enjoyed solid growth in Q2, August PMI data indicate that momentum has carried into Q3. The services PMI was virtually unchanged at 59.7, still a historically elevated level, while the manufacturing PMI fell to 61.5. We expect Eurozone Q3 GDP to rise 2.5% quarter-over-quarter, even stronger than the Q2 gain.
- Next week: China PMIs (Tues), Eurozone CPI (Tues), Canada GDP (Tues)
Interest Rate Watch: Powell Keeps an Open Mind to Tapering
- It does not seem that the Fed chair has made up his mind yet about when to taper, and he will continue to watch incoming data. The labor market report for August, which is slated for release on Friday, September 3, will be an important marker for the beginning of tapering.
Credit Market Insights: Red-Hot CLO Market
- This past year has been a banner year for fundraising and deal activity, with demand booming for collateralized loan obligations (CLOs). The low interest rate environment has supported record-breaking deal flow as firms have been able to borrow cheaply coming out of the pandemic.
Topic of the Week: The Economics of College Football: Season III
- We are again publishing our series on college football this year. Each week of the season, we will be highlighting a key matchup, covering the history behind each university's football program, local economy and school community, and of course, giving predictions about the upcoming game.
U.S. Review
Moving Back into Balance
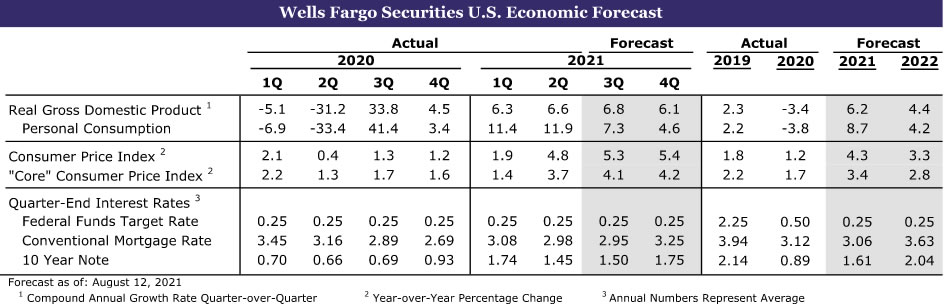
Shortages, supply-chain bottlenecks and higher prices have been a hallmark of this economic recovery, with some of the most notable shortages and price hikes occurring in housing and motor vehicles. This week's economic data provide some hints that the economy is moving toward some sense of better balance, with the rise in COVID infections causing consumers to tap the brakes and allow production to catch up with consumption. Many forecasters have slashed their estimates for third quarter economic growth due to the recent slide in consumer sentiment and some moderation in the high-frequency data that focus on consumer spending and economic engagement. Real GDP measures the production of goods and services, however, which appears to be less affected by the resurgence in COVID infections. The revised Q2 GDP data also show that inventories fell even more than previously reported, which likely sets up an even larger swing back in Q3.
Consumers took a breather in July, with today's personal income and spending data showing a 0.1% drop in real personal consumption outlays for the month. Real outlays for durable goods fell 2.6%. Spending on motor vehicles and parts fell 3.7%, largely due to the lack of cars and SUVs available for sale. Dealer lots are nearly empty, with several dealerships down to just a handful of cars on their lots. New cars are also selling at a premium. Consumers certainly have the ability to continue spending. Personal income rose 1.1% in July, with wages and salaries climbing 1.0%. With income rising faster than outlays, the saving rate rose 0.8 percentage point to 9.6%. Consumers are also still sitting on a mountain of savings built up during the pandemic, estimated around $2.3 trillion above where it would have been under its pre-pandemic trend. Consumer sentiment for the month of August affirmed the 11-point plunge reported in the preliminary report earlier in the month. The final Consumer Sentiment index for August rose 0.1 from its preliminary level and shows essentially the same large, nearly 14-point drop in consumer expectations, likely reflecting concerns about the rising number of COVID infections tied to the particularly contagious Delta variant.
The moderation in consumer spending on goods should allow for production to begin to catch up with consumption. While headline advance orders for capital goods fell 0.1%, the core nondefense capital goods orders, excluding aircraft, were flat, while orders for motor vehicles and parts surged 5.8%. Core shipments of capital goods, which is a good proxy for business fixed investment, rose a solid 1.0% in July and are up at a solid 13% annual rate. Inventories also increased, climbing 0.6% in July.
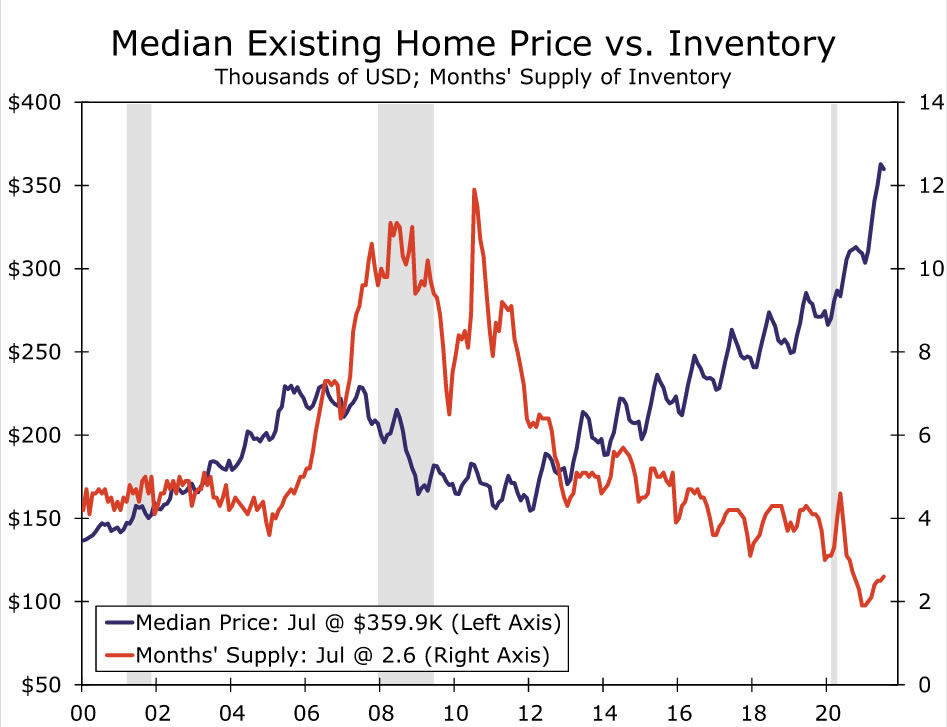
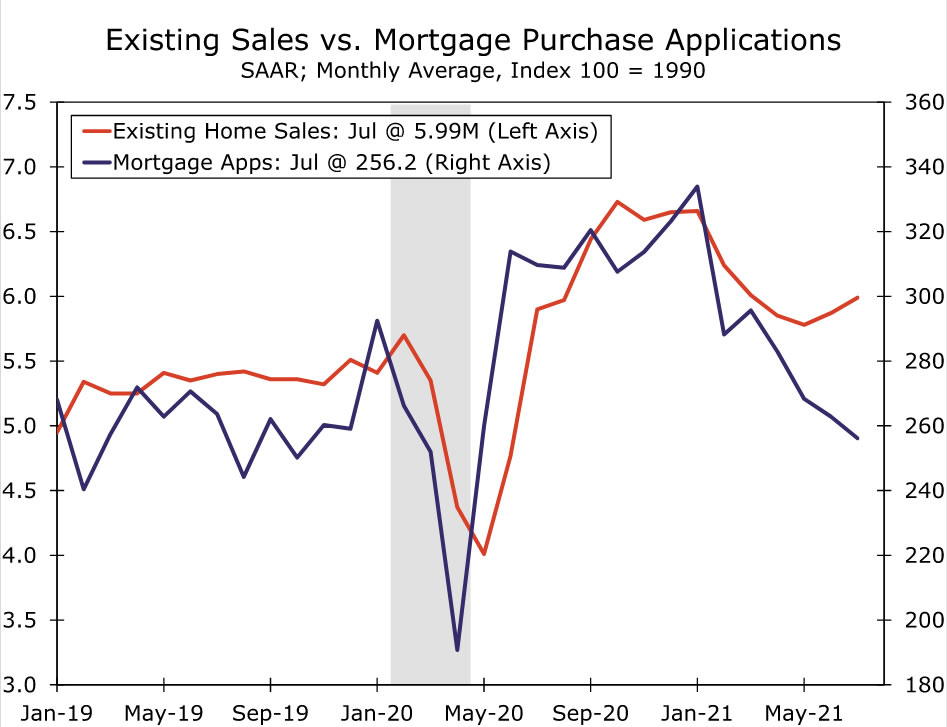
This past month's housing data suggest the market is beginning to move back into balance. To be certain, inventories of existing homes are still exceptionally low and homes are selling quickly and often above asking price. The earlier surge in home prices has brought out more sellers, however. The inventory of existing homes has been gradually trending higher since February and now sits at a 2.6-month supply. A 5.5-month supply has typically been considered the norm, although innovations in mortgage finance and the rise of cash buyers have probably reduced that by a month or two. Sales of existing homes slightly topped consensus expectations this past month, rising 2% to a 5.99-million unit pace. Sales of single-family homes rose 2.7% and accounted for all the overall gain. The median price of an existing home declined slightly from the prior month, on a non-seasonally adjusted basis, to $359,900. That still leaves the median price 17.8% above its year ago level. The pace of price appreciation appears to have peaked in May at 23.6%.
Sales of new homes rose 1.0% to a 708,000-unit pace, ending a three-month string of declines. Home buying activity has cooled off in recent months alongside soaring prices and shrinking inventories. Sales in June were also revised slightly higher and now show a 2.6% drop, compared to a 6.6% drop reported earlier. Low inventories and the rapid run-up in prices have led prospective buyers to put their home-buying plans on hold, which explains a softer pace of sales in recent months. The pullback also makes sense considering the extremely low inventories of completed homes available for sale and continuing supply chain disruptions that have led to project delays. Sales of homes where construction has not started rose 19% during July, while sales of homes under construction fell 13% to the lowest level since May 2020.
The inventory picture appears to be improving slightly. The number of new homes for sale rose 5.5% to 367,000 in July. At the current sales pace, all the current inventory on the market would be sold in 6.2 months, up from six months in June and 3.6 months in July 2020. While the number of homes for sale rose at every stage of construction, most of the recent improvement in inventories has been for homes that have not yet started construction.
U.S. Outlook
Construction Spending • Wednesday
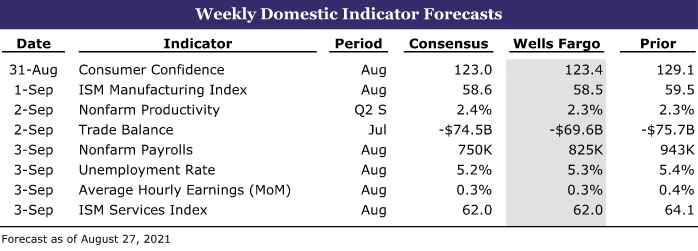
During June, total construction spending edged up 0.1%. Again, nearly all of the gain occurred in the residential sector, which rose 1.1% during the month. More time spent at home throughout the pandemic has induced a need for more space, which has bolstered single family and home improvement spending. By contrast, nonresidential outlays declined 0.9% during June, which reflects the seismic impact COVID continues to have on office, hotel and education construction projects.
Residential's momentum has been slowing over the past few months alongside sky-rocketing home prices and building material scarcities. Housing starts declined sharply during July, which adds to the evidence that home building has hit a near-term ceiling, in part due to supply constraints. Retail sales at building material stores also have pulled back recently, suggesting fast-rising input prices are also a headwind for home improvement spending. In terms of nonresidential spending, both the Architectural Billings Index and Dodge Momentum Index fell back during July as the Delta wave of COVID reintroduced uncertainty surrounding prospective tenant demand. We look for another modest gain for overall construction spending during July.
ISM Manufacturing • Wednesday
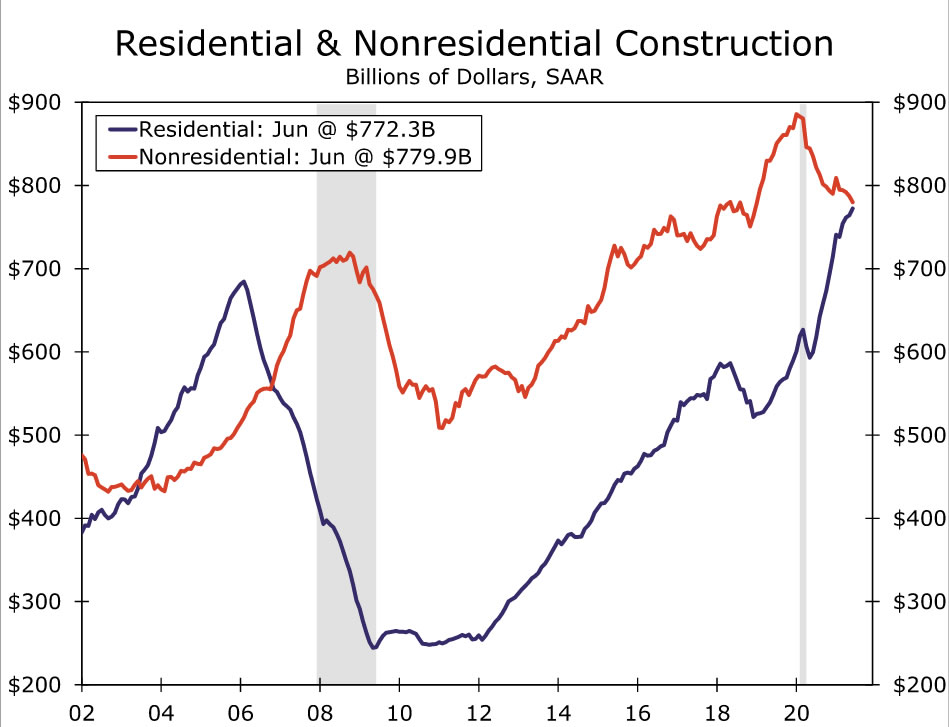
Pervasive supply chain bottlenecks continue to hamper otherwise strong activity in the factory sector. The ISM manufacturing index came in below expectations and slipped to 59.5 during July, the first reading below 60 since the start of the year. Most sub-components of the headline index deteriorated during the month, notably new orders, production and inventories. There were a few signs that procuring parts and labor was becoming less of an issue. The employment index crossed back into expansion territory, while the prices paid index fell back from the highly elevated levels seen recently. The supplier delivery index also fell to a five-month low of 72.5. These improvements no doubt come as welcome news to the manufacturing industry, which has been the epicenter of the supply chain dislocations affecting the entire economy. However, smooth functioning value chains still appear to be some ways off, as many indicators of global supply bottlenecks (as encapsulated by our “Pressure Gauge”)remain heightened. Bearing this in mind, as well as the softer-than-expected results from most of the Fed's regional survey's of manufacturing activity, we expect another modest decline in the manufacturing ISM during August.
Employment • Friday
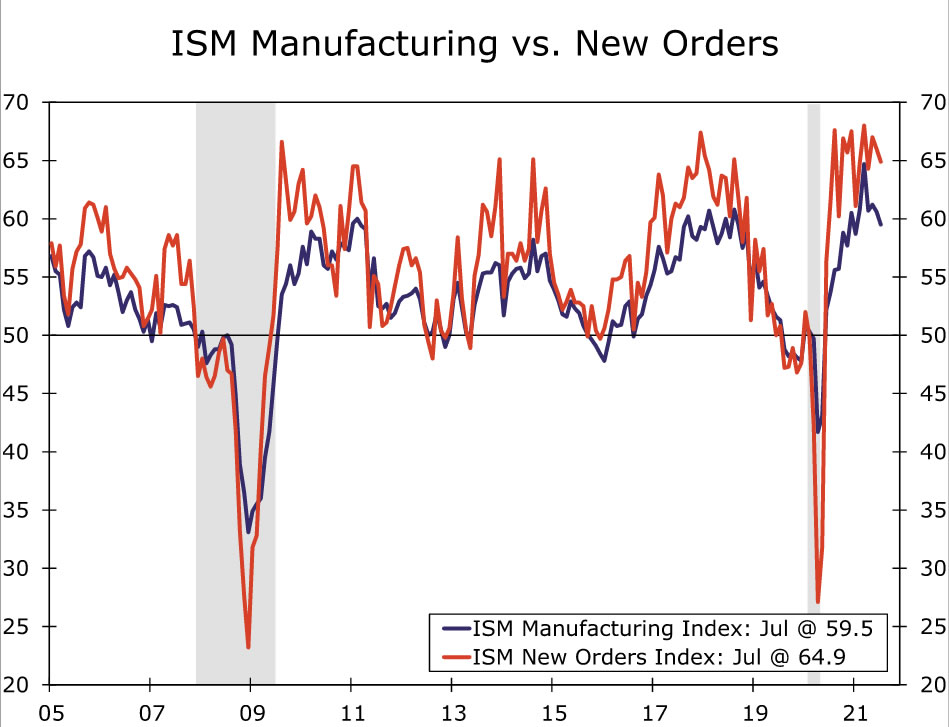
The labor market recovery appears to be gaining speed. Employers added 943K jobs during July, bringing the three-month moving average to 832K, the fastest pace since October of last year. Meanwhile, the unemployment rate fell sharply to 5.4% from 5.9%. Employers still appear to be having trouble staffing open positions, which is keeping pressure on wage growth. Average hourly earnings rose 0.4% during July, bringing the three-month annualized pace to 5.0%.
We expect another robust gain in payrolls for August. That said, the increase may fall slightly short of July's enormous addition. For one, payrolls in July were flattered by a 221K gain in local government education jobs, a result that was likely overstated by the seasonal adjustment process, which has been flummoxed by the unusual hiring patterns in public education following the onset of the pandemic. On the other hand, the leisure & hospitality sector posted a solid gain in July, which demonstrates that labor supply constraints are beginning to ease. Many states have now exited the federal pandemic unemployment benefit program, which could help add to the labor supply in the months ahead. That said, the surge in COVID cases driven by the highly transmissible Delta variant presents some downside risk, as fear of catching the virus is one factor keeping workers on the sidelines. Related to that, the FOMC is likely to again consider deteriorating public health conditions as a detriment to "substantial further progress," which removes some heft from the August employment report when it comes to determining the timing of potential tapering.
International Review
Eurozone Economy Still Showing Solid Momentum
After the Eurozone economy enjoyed a sizable 2.0% quarter-over-quarter gain in Q2, the August PMI figures indicated that sturdy momentum has carried into the third quarter. Of particular note, the services PMI was virtually unchanged at 59.7, still a historically elevated level, while the manufacturing PMI eased a bit, to 61.5. The details of the report showed only a mild softening of new orders and incoming new business. Overall, we expect Eurozone Q3 GDP growth of 2.5% quarter-over-quarter, even stronger than the gain in Q2. Meanwhile, the input and output price components of the PMI survey also remained at relatively high levels, indicative of inflation pressures, although these pressures have yet to show through in the Eurozone CPI to any meaningful extent.
Separately, Germany's August IFO business confidence also shows reasonable momentum for the Eurozone's largest economy, though possibly hinting at some slowing by late this year. The headline business climate index fell to 99.4. The current assessment component actually increased to 101.4, but the expectations component showed a perceptible decline, to 97.5.
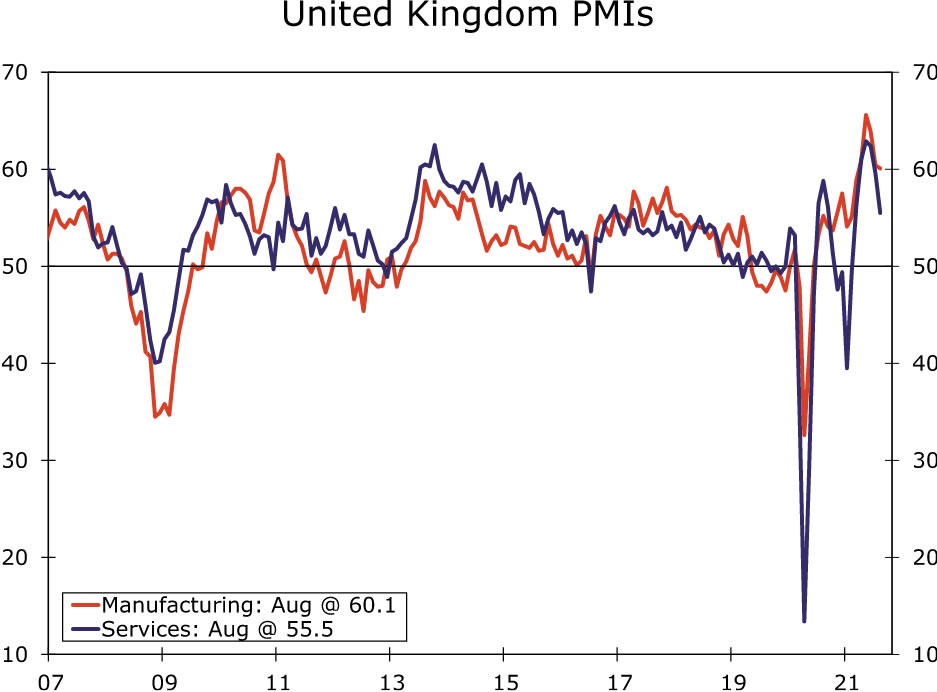
In contrast to the Eurozone, the August PMI surveys for the United Kingdom showed a more notable slowdown, although that was perhaps always to be expected after the U.K. economy enjoyed supercharged growth of 4.8% quarter-over-quarter in Q2. The August services PMI dropped to 55.5, the lowest level since February, while the manufacturing PMI eased to 60.1. The survey comes after a reported decline in July retail sales and suggests that while the service sector will likely continue to grow in Q3, it will probably be at a much slower pace than in Q2. As a result, we also expect slower growth in U.K. Q3 GDP, with our forecast 2.5% quarter-over-quarter gain only around half of the increase seen in Q2.
Finally, the Bank of Korea delivered a somewhat "dovish rate hike" at its monetary policy announcement this week. The Bank of Korea raised its policy rate 25 bps to 0.75%, surprising the (slight) majority of analysts who had expected the central bank to hold rates steady. The decision to raise interest rates was not unanimous, with one policymaker voting to hold interest rates steady. The Bank of Korea also will “gradually adjust” the degree of support for the economy, taking into account COVID developments and financial imbalances, among other factors. Meanwhile, the Bank of Korea kept its GDP forecasts unchanged, while raising its CPI inflation forecasts. Still, Central Bank Governor Lee described interest rates as still accommodative after the move, and the majority of economists expect one more rate hike before he steps down as central bank governor in March.
International Outlook
China PMIs • Tuesday
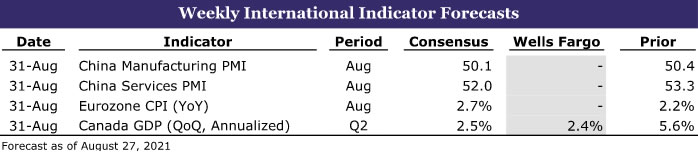
China's economy has slowed recent months, in part due to COVID-related restrictions and regulatory changes. Localized outbreaks of COVID cases have seen some restrictions on tourist events and sites, and have affected air travel. Meanwhile, regulatory changes, including measures to curb pollution, are potentially affecting industrial activity.
Against this backdrop, the consensus forecast is for a further decline in China's official PMIs for August. The manufacturing PMI is expected to ease to 50.2 while, more notably, the services PMI is expected to fall to 52.0. The Caixin PMIs, also due next week, are expected to show a dip in the manufacturing PMI to 50.1 and a decline in the services PMI to 52.0. While we have downgraded our 2021 GDP growth forecast for China over the course of this year, the risks around that forecast are likely still tilted to the downside.
Eurozone CPI • Tuesday
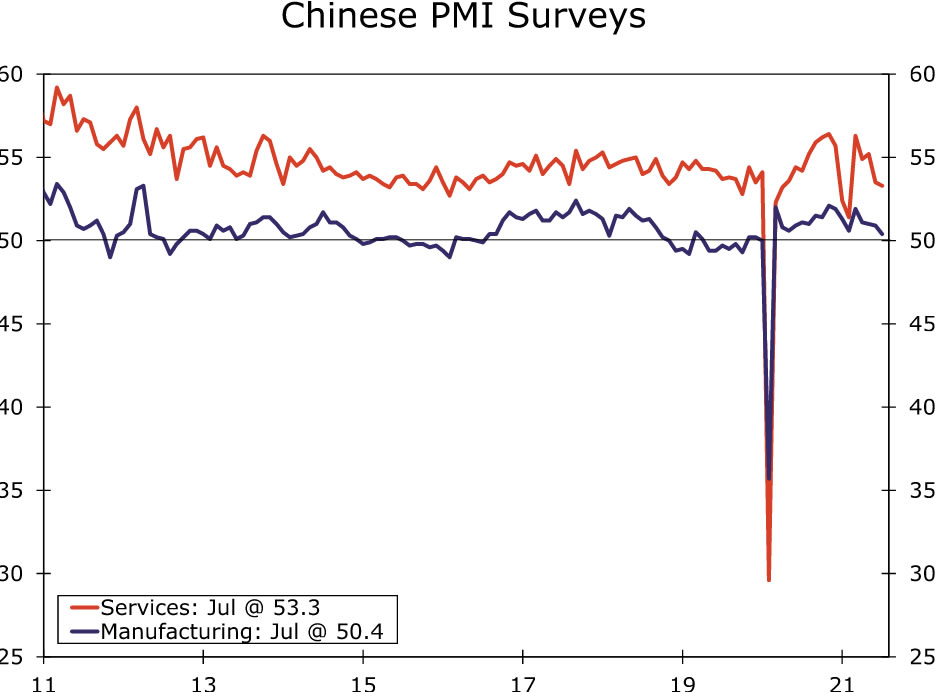
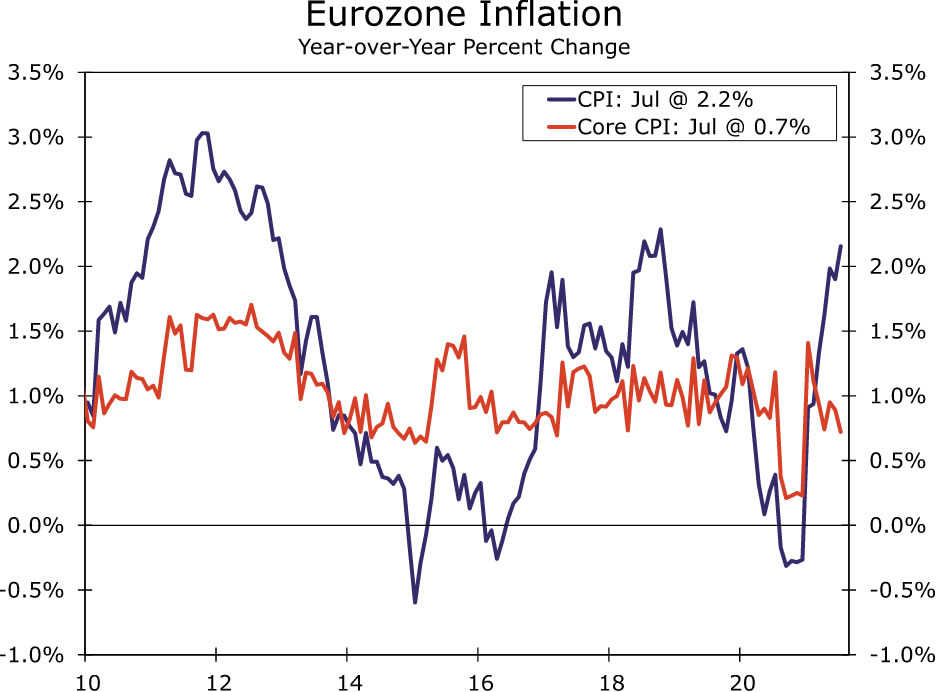
Next week's August CPI figures for the Eurozone are expected to show some acceleration of inflation. While some of that might reflect some firming in underlying price pressures, base effects are also expected to contribute to faster inflation.
There are some nascent inflation pressures, most clearly reflected in the Eurozone PMI surveys, where the input and output price components are at historically elevated levels. That said, the pass-through to the CPI has been limited so far. For August, the headline CPI is expected to quicken to 2.7% year-over-year, from 2.2% in July. Core CPI inflation is expected to double to 1.4% in August, from 0.7% in July.
However, much of that pickup of inflation stems from price declines, and temporary VAT tax reductions, that took place in Germany in the middle of last year. For example, focusing on the core CPI and adjusting the series for seasonal influences, the consensus forecast of 1.4% for August would equate to an annualized pace of core CPI inflation over the past six months of around just 0.4%. That is, we would not view a spike in August inflation as a harbinger of inflationary pressures to come, and we doubt the European Central Bank would either.
Canada GDP • Tuesday
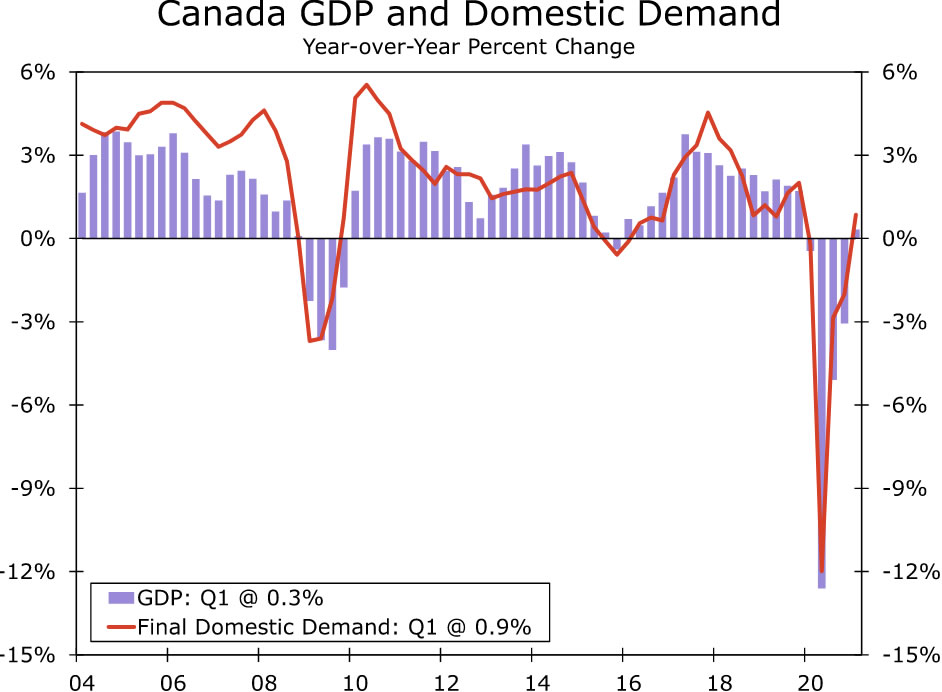
Canada's GDP data are released next week and should show slower, but still respectable, growth for the economy in Q2. We forecast Q2 GDP growth of 2.4% quarter-over-quarter annualized, very close to the consensus forecast of 2.5%, but well below the 5.6% growth seen in Q1.
Still, given the renewed spread of COVID cases and associated restrictions, that would still represent a decent pace of growth for the Q2. For example, the early part of the quarter saw significant declines in employment and retail sales, before some recovery in June. As a result, we suspect growth in final domestic demand for Q2 might not be quite as strong as the headline GDP. That said, with the economy proving resilient in the face of COVID restrictions, we expect the Bank of Canada to view the growth slowdown as temporary, and we believe the central bank will continue along the path of less accommodative monetary policy in the months and quarters ahead.
Interest Rate Watch
Powell Keeps an Open Mind to Tapering
The topic of "tapering" by the Federal Reserve has been very much front and center in financial markets in recent weeks. In an effort to provide monetary accommodation to the economy, the Fed has been making monthly purchases that total $80 billion of Treasury securities and $40 billion of mortgage-backed securities (MBS) for more than a year. The minutes of the past two FOMC meetings show that the committee has been discussing the conditions under which the Federal Reserve would pare back (i.e., "taper") its extraordinary pace of asset purchases, and a number of FOMC members have been saying publicly that the Fed should start to taper soon. So all eyes were on Fed Chairman Powell when he addressed the Jackson Hole Economic Policy Symposium today.
In our view, Chair Powell did not signal that tapering is imminent. He did acknowledge that he was of the view at the July 28 FOMC meeting, as were most of the other committee members, that "if the economy evolved broadly as anticipated, it could be appropriate to start reducing the pace of asset purchases this year." However, the intervening month has brought mixed news. The good news is that employment growth was strong in July. On the other hand, risks to the economic outlook have risen due to the spread of the Delta variant. Powell stressed the benefits of strong levels of employment, and he continued to articulate his view that the sharp increase in inflation this year will be transitory. In short, it does not seem that the Fed Chair has made up his mind yet about when to taper, and he will continue to watch incoming data. The labor market report for August, which is slated for release on Friday, September 3, will be an important marker for the beginning of tapering.
Even when tapering commences, financial conditions will remain accommodative. The Fed will continue to buy Treasury securities and MBS, just at a slower pace. So a sharp backup in long-term interest rates does not seem likely in the foreseeable future, unless economic growth turns out to be stronger and/or inflation comes in higher than most market participants currently expect. Once the Federal Reserve completes its tapering process, focus will then turn to the first rate hikes. In our view, the FOMC will maintain the federal funds rate in its current target range of 0.00% to 0.25% through at least the end of 2022.
Credit Market Insights
Red-Hot CLO Market
This past year has been a banner year for fundraising and deal activity. The low interest rate environment has supported record-breaking deal flow as firms have been able to borrow cheaply to reposition themselves coming out of the pandemic. Booming demand for collateralized loan obligations (CLOs) in particular has been a standout. CLO sales have fully recovered from last year's trough and are rising at a record clip in the United States, according to S&P Global Market Intelligence. Globally, the market for CLOs recently surpassed $1 trillion.
CLOs are securities typically backed by pools of low-rated corporate loans. With a CLO, the investor gets scheduled debt payments from the underlying loans, assuming most of the risk in the event that borrowers default. In exchange for taking on the default risk, investors are offered the potential for higher-than-average returns. The CLO market is often used as a conduit for large institutional investors to lend to non-investment grade borrowers. Greater CLO issuance typically means more dry powder to support debt financing for private equity buyouts and M&A deals.
CLOs have historically offered a yield premium over other corporate credit instruments of an equivalent rating. That said, the market's structure and volatility tamed investor interest following the financial crisis. After the crash, many investors steered clear of credit derivative products after having to repay loans on securities for which value had fallen. Over the past few years, however, investors have become more comfortable with CLOs, and issuance has improved. New interest from insurance companies and pension funds have also helped to deepen the market's institutional buyer base. With many buyouts currently under way, the record pace of CLO formation should support financing in the months ahead.
Topic of the Week
The Economics of College Football: Season III
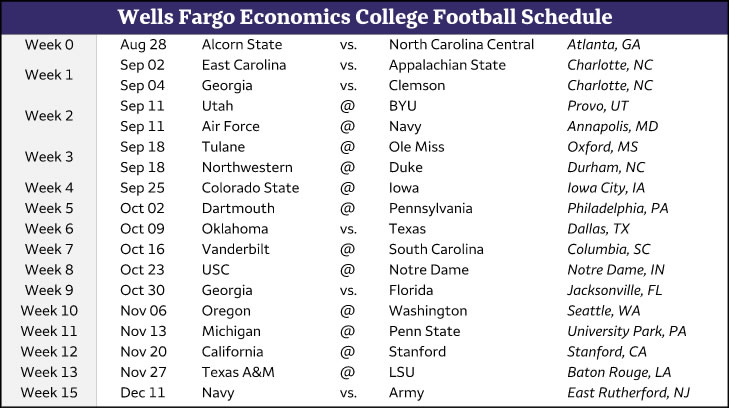
With the summer winding down and schools reopening to in-person instruction, college football games are rapidly approaching. Each week of the season, we will release one or two reports highlighting a key matchup, covering some of the history behind each university's football program, local economy and/or school community, and of course, some predictions about the upcoming game.
The biggest changes in college football this year deal with financial issues. After a series of moves by state legislatures and a major Supreme Court decision, the NCAA has changed its rules to allow college athletes to earn money by selling the rights to their name, image and likeness (NIL). The impact is likely to be greatest for athletes at major schools who play in nationally televised games. Schools that are close to major media markets would also appear to have a greater competitive advantage, which may make schools like UCLA and USC more popular destinations for top talent. Major media centers like Atlanta, Miami, Dallas and Nashville would also like to further cement the competitive position for the SEC, while the Big Ten should have plenty of access to the media in Chicago.
Securing a steady stream of big games and TV deals is believed to be the driving force behind the other major off-season changes, including the move by the University of Texas and the University of Oklahoma out of the Big 12 and into the SEC. Texas and Oklahoma are not scheduled to move until after the 2024 season, which is when the Big 12's current television contact runs out. The prospect of even more must-see SEC college football games has raised concerns about the SEC's growing clout. An alliance between the Big Ten, Pac-12 and ACC was announced this past week. Few details are available so far, but the agreement appears to be an attempt to gain some leverage in negotiating television deals and might also result in some marquee inter-conference matchups.
While one of the purposes behind the recent alliance between the ACC, Big Ten and Pac-12 is to eliminate any poaching of each other's teams, we doubt we have seen the end of conference realignment. The growing importance of media rights, which account for 30% of Division 1 football program revenues, will likely drive more up-and-coming programs to seek membership in one of the Power Five conferences. Schools from rapidly growing markets will be of particular interest and conferences will likely be interested in broadening their geographic reach to include large new media markets where it makes sense. This would make more conference games attractive to the major networks.
We have an aggressive schedule of games that we plan to feature in our weekly college football economic outlook series. The reports are a fun way to discuss state and local economies and provide some perspective of college football. The start of this year's college football season is being met with a bit more trepidation than most. College football is unique, because most teams can only afford one slip up, at most, if they hope to compete for the national title. This makes almost every game a big game for most teams. COVID also continues to hang over the sport. Will fans return to stadiums in full force? We will find out soon, as the season begins this Saturday and a full slate of games is scheduled for the extended Labor Day weekend, beginning on Thursday, September 2.
The Weekly Bottom Line: Delta Variant Dims The Outlook
U.S. Highlights
- Markets had to wait until Friday for the main event, Fed Chair Powell’s Jackson Hole remarks. In his speech, he provided a clear signal that as long as the economy continues to make progress, the Fed will begin tapering asset purchases before the end of this year.
- Economic data this week was supportive of economic resilience in the face of the Delta-driven surge in Covid-19 cases. Demand for housing solidified, and personal income growth picked up.
- Should consumer caution see spending trends deteriorate further in the coming months, we could see slower growth in outlays in the fourth quarter, but we expect the lull to be temporary.
Canadian Highlights
- This was a relatively quiet week in Canada, but the data flow is expected to pick up next week with June’s GDP report on the docket. It is expected to show economic activity bouncing back strongly as restrictions began to ease.
- How long the good times will roll depends on the virus. New cases are rising, while more provinces and businesses are implementing measures such as vaccine passports and mandatory vaccination requirements in order to avoid lockdowns.
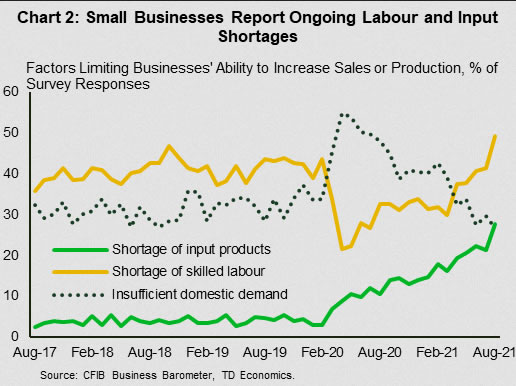
- Ongoing supply chain disruptions and labour shortages are weighing on businesses’ ability to scale up sales and production. This week’s CFIB business barometer survey showed that both of these issues intensified in August.
U.S. - Powell Ready to Taper QE by Year-End
In a relatively quiet week for economic data, markets had to be patient until Friday for the main event: Fed Chair Powell’s remarks from the Jackson Hole symposium. The event itself has been impacted by the rise in Delta variant cases, going online at the last minute. Powell’s remarks provided a clear signal that as long as the economy continues to make progress in the coming months, as we expect, the Fed will begin tapering its asset purchases before year-end.
The economic backdrop to the speech has been pretty good. Existing home sales rose 2% in July, showing that underlying demand for housing is solid, and that the pullback in sales from the post-lockdown surge has run its course. The second release of the GDP data showed that the U.S. economy was very slightly stronger in the second quarter than previously reported. Sitting more than halfway through the third quarter though, the real question is how well spending will hold up against the Delta wave.
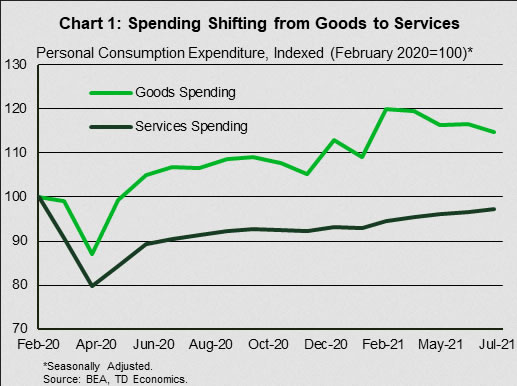
There weren’t too many signs of Delta-related caution in the July spending data. Spending on close contact services grew about 1% month-on-month in July, matching June’s pace. Since the initial re-opening stage in 2020, goods spending has surged (and durable goods specifically), supported by generous government supports and restrictions on services spending (Chart 1). But there are only so many iPads and TVs people need. Spending on these durable goods has been declining since March, while services spending is making steady gains. This correction in goods spending is expected to hold consumer spending below 2% in the third quarter, even before caution related to the Delta variant is incorporated in the forecast.
If we do see slowing in these close-contact services through August and September, consumer spending growth could slow further. Still, we don’t expect it to be derailed for a few reasons. For starters, U.S. households have amassed over $2.5 trillion in excess savings over the course of the pandemic. Even if unevenly distributed, this provides a substantial cushion against a temporary slowing in momentum. Second, labor shortages, which appear relatively widespread across regions and industries, may lead employers to hold on to workers, rather than lay them off due to a temporary lull in demand, helping to keep the labor market resilient.
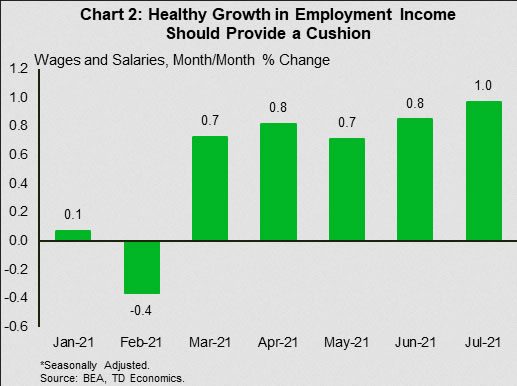
Finally, while headline personal income growth is being buffeted by swings in government support programs, underlying growth in wages and salaries has been solid (Chart 2). Indeed, wages and salaries rose 1% in July alone, and are up 10.6% annualized pace over the past three months. Solid income gains should support consumer spending in the months ahead.
Powell’s remarks took a deep dive on recent inflation trends, and defended his view that much of the recent surge in inflation is transitory. He highlighted the clear improvement in the labor market, while acknowledging the risks posed by the Delta variant. Overall, his remarks were consistent with our view that asset purchases will be tapered this year, given the economy’s expected resilience to the Delta wave.
Canada - Delta Variant Dims The Outlook
It was a quiet week in terms of economic data. The federal election continued to make headlines as parties released details of their election platforms. In a nice reversal to last week's sell-off, equity markets were upbeat, more than recovering last week's losses. Ditto for the WTI oil price, which rebounded on the week, giving a lift to the Canadian dollar vis-à-vis the greenback.
The economic data flow will pick up next week, with June's GDP report expected to show economic activity bouncing back strongly as restrictions began to ease. This should provide a solid handoff for the third quarter, when further easing of containment measures over the summer is expected to usher a strong bounce back in real GDP growth.
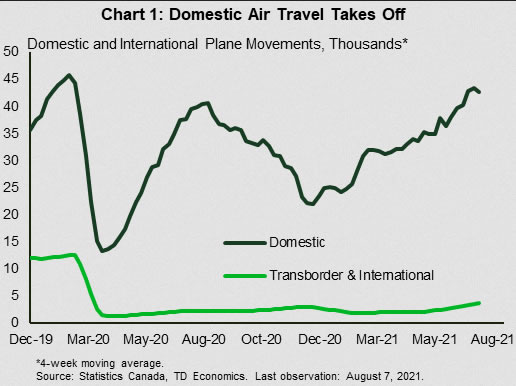
Indeed, economic activity continued to broaden and gather pace during the summer months, allowing the labour market recovery to gain momentum. Spending has picked up in areas most directly impacted by the pandemic such as travel, dining out and recreation. While international tourism remains challenged by the pandemic, Canadians have embraced domestic travel. Data shows that in July, domestic plane traffic was nearly on par with pre-pandemic level (Chart 1). Restaurant reservations data from OpenTable show similar progress.
How long the good times will roll will depend on the virus. As we note this week in our updated COVID-19 Economic Tracker, cases are on the rise across most developed countries. Canada too has witnessed an uptick in COVID-19 cases in all regions in recent weeks, led by Western provinces. Canada’s vaccination rate is among the highest in the world with over 74% of its adults fully vaccinated, which gives some hope that strict containment measures will be avoided. Canada's already-high vaccination rate could be boosted further still. A number of provinces (QC, BC, PEI, MB) have introduced vaccine passports, and a growing list of companies are announcing mandatory vaccination for in-person working arrangements. This could spur more people to get vaccinated.
So far, the high vaccination rate has kept hospitalization and death rates low relative to cases. Still, cases and hospitalization are rising swiftly among the non-vaccinated population, and there are breakthrough cases among the vaccinated. Past waves have shown that Canada has a much lower tolerance toward hospitalization thresholds relative to other countries. This poses a downside risk to the outlook, as the pace of reopening might be paused or scaled back.
Economic growth could also be restrained by ongoing supply chain disruptions, and labour shortages. Responses from this week's CFIB Business Barometer Survey showed these issues intensified in August (Chart 2). Nearly half of respondents cited a shortage of skilled labour and a record 27.6% of firms reported shortage of input products as an impediment to growth in sales or production. Given that many emerging economies, where many of the goods are being manufactured, are dealing with Delta outbreaks of their own, these supply chain bottlenecks are unlikely to ease in the near term.