Sample Category Title
GBP/USD Breaks Resistance
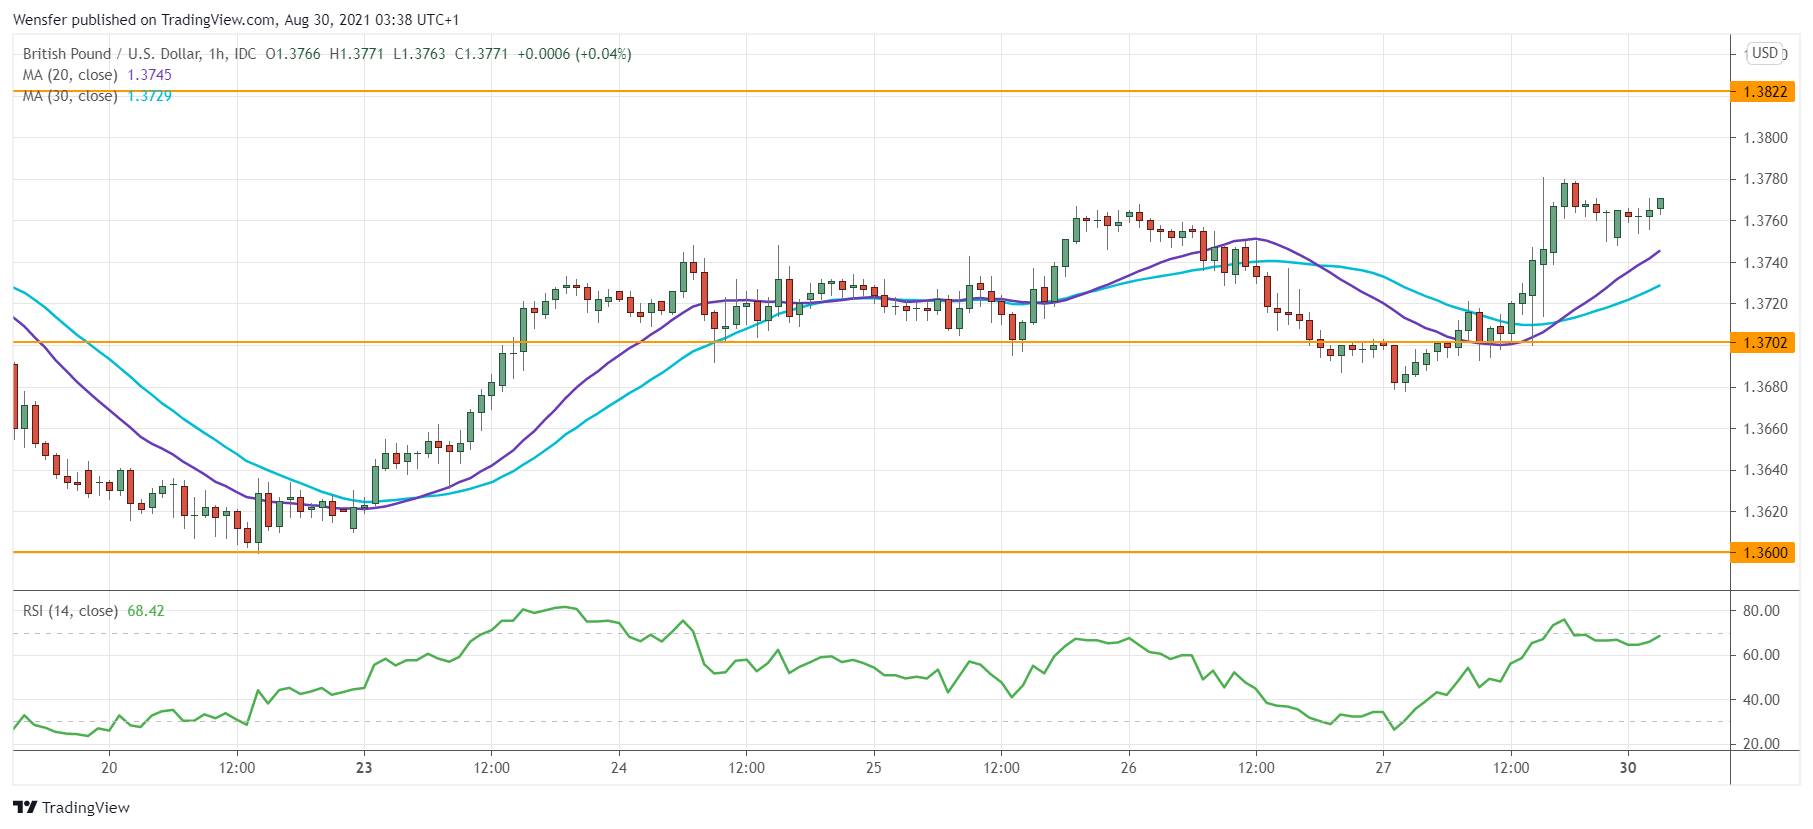
The US dollar tumbled after Fed Chairman Jerome Powell said it was too early to withdraw support. The pair has seen solid buying interest at the daily support (1.3600).
After a short-lived consolidation below the key resistance at 1.3770, a bullish breakout is a sign of commitment from the buy-side. An overbought RSI may cause a limited pullback with buyers expected around 1.3700.
As sellers reverse their positions, 1.3820 would be the next target and its breach could open the door to July’s peak at 1.3980.
Powell Causes Dollar Retreat But Didn’t Cross The Line
At the end of the week, Powell's speech removed fears of rapid stimulus cuts and interest rate hikes from the markets. The Fed Chairman reiterated that most of the conditions for starting QE cuts have been met, but the bar is higher for starting a rate hike. This bar has not yet been met, and these are not events that come one after the other.
Powell's statements supported purchases of risky assets and put pressure on the dollar. The move was not particularly strong, taking 0.4% away from the DXY, returning the dollar to a critical support level in the form of the 50-day moving average and former converging trading range resistance.
Powell's comments delayed the acceleration of the dollar's rally, but as long as the DXY remains above 92.50, a bullish scenario for the dollar remains in play. The muted response from the US currency suggests that the dollar bears have not heard what is essential for them to move into action.
Indeed, Powell agreed that conditions are ripe for QE purchases to be cut, confirming the fundamentals behind the dollar's strength since June, such as high inflationary pressures and a strong labour market, as a reflection of the booming recovery in the economy.
Simply put, Powell's comments slowed the dollar's upward movement and maintained the status quo in stock markets, where investors continue to roll the rock uphill.
Those tuning in to the rising volatility in the currency and stock markets are now waiting with increased focus for Friday's US labour market data and other indicators of consumer activity to gauge the chances of a wind-down announcement in late September, or if it will be in November or December.
Strong data and optimism from companies and Americans could spur new trade ideas in the markets after the summer lull. And, as is often the case, if it is a rising dollar, it promises to be quite sharp. If it is a pessimistic scenario for the dollar, however, it will be a smooth slide.
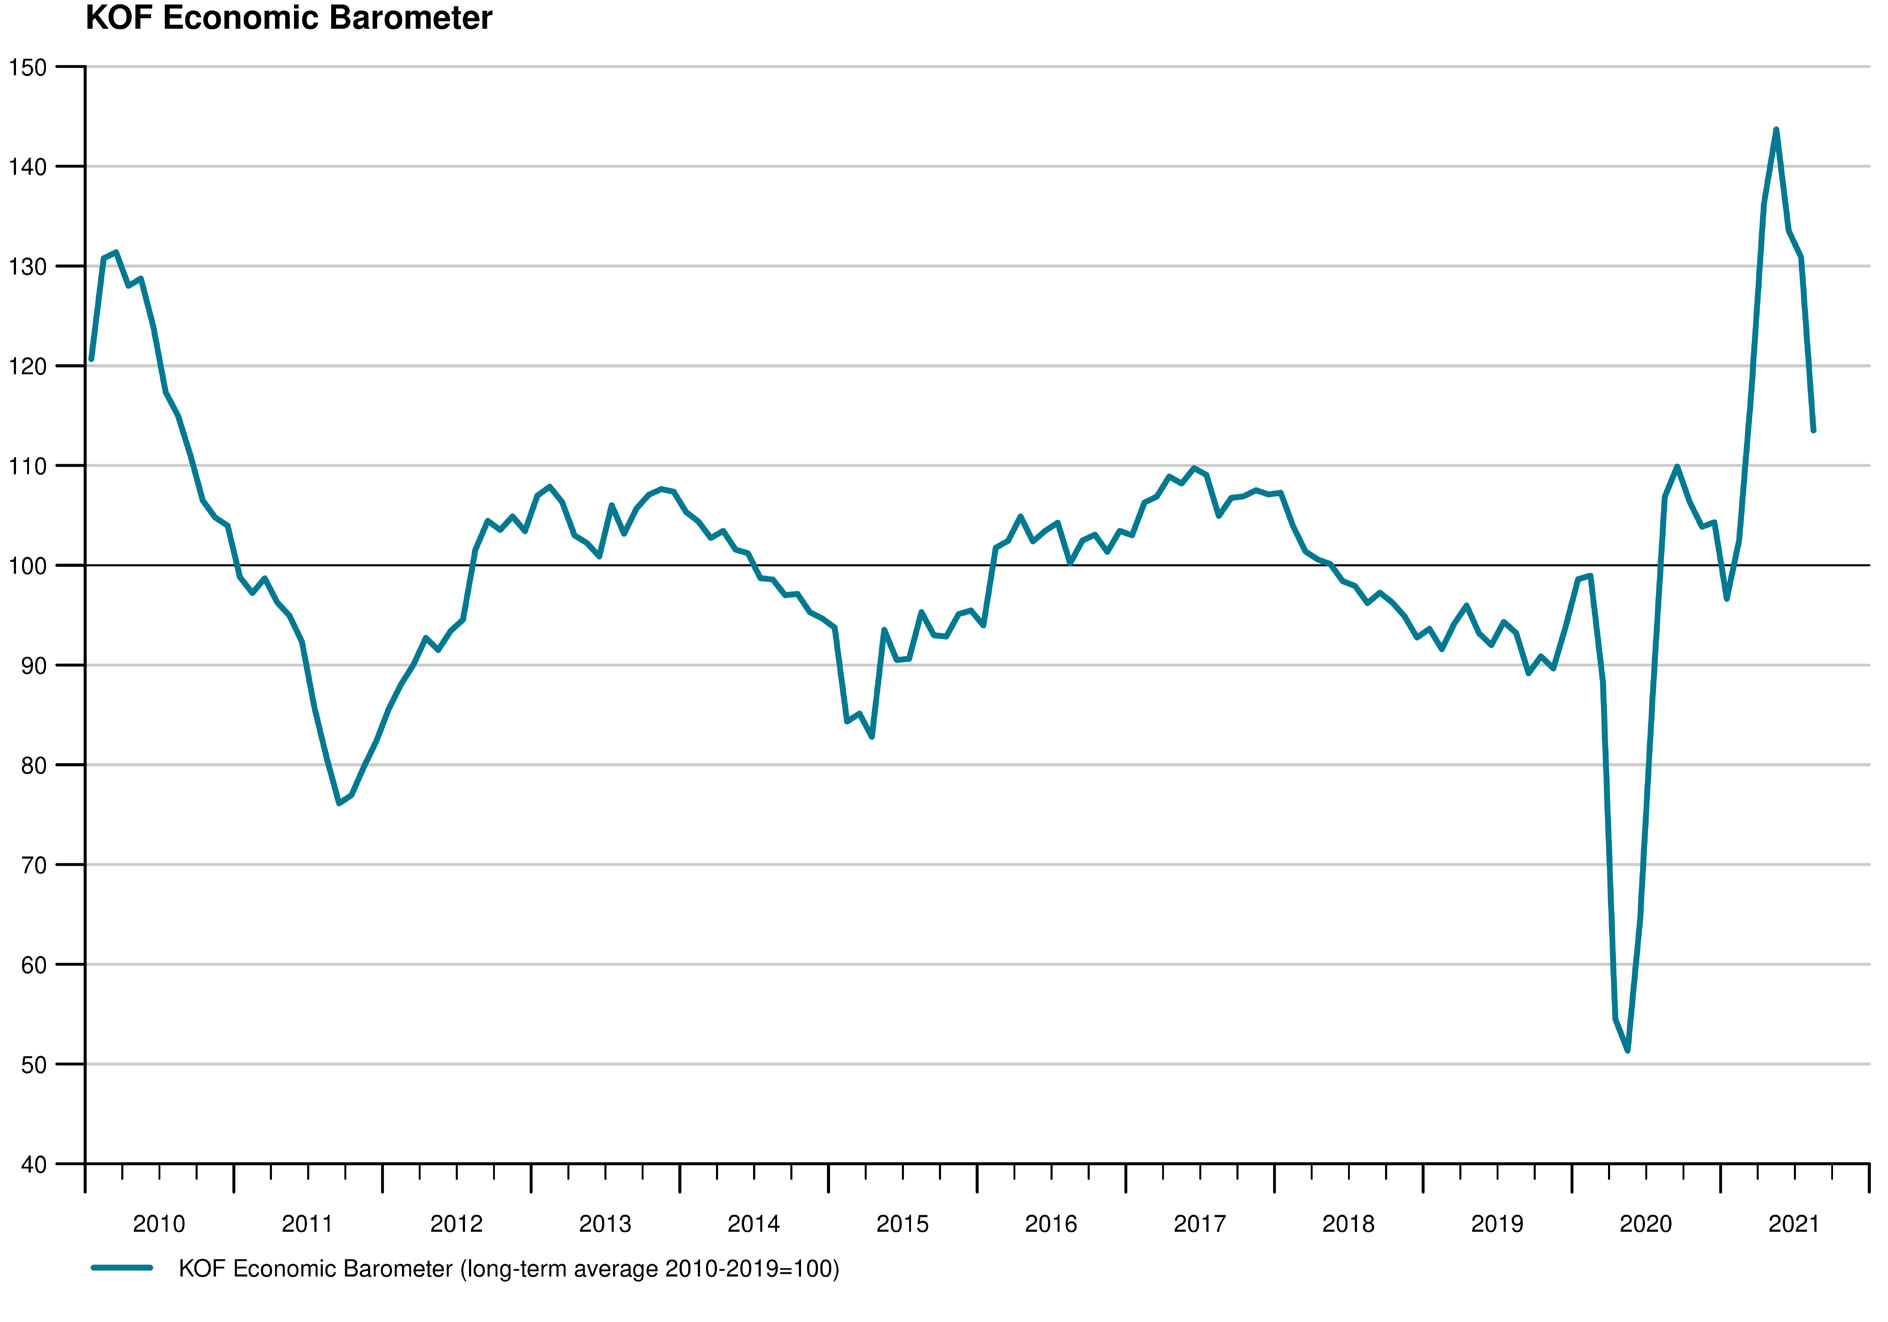
Swiss KOF dropped to 113.5, 4th wave of pandemic fueling doubts on economy
Swiss KOF Economic Barometer dropped for the third month in a row to 113.5 in August, below expectation of 126.3. However, it';s still well above it's average value of 100. KOF said, "the fourth wave of the pandemic, which is now becoming increasingly clear, is apparently fueling doubts about largely unhindered economic activity in the near future."
USD/CAD Decline Could Continue
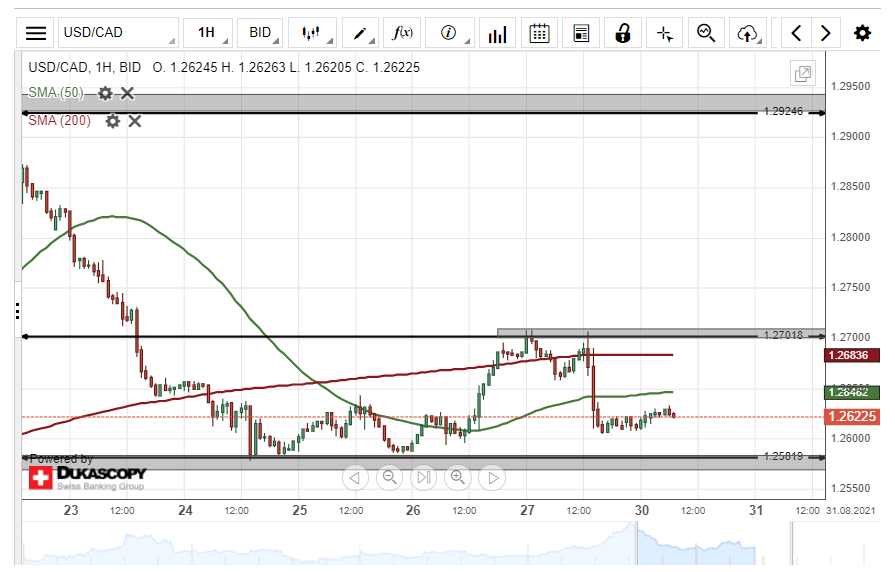
On Friday, the US Dollar declined by 92 pips or 0.72% against the Canadian Dollar. The currency pair breached the 50– and 200– hour simple moving averages during Friday's trading session.
Technical indicators suggest selling signals on the 4H time-frame chart. Therefore, the USD/CAD exchange rate could continue to edge lower during the following trading session.
However, sellers could encounter support at the 1.2518 level within Monday's trading session.
GBP/JPY Could Edge Higher
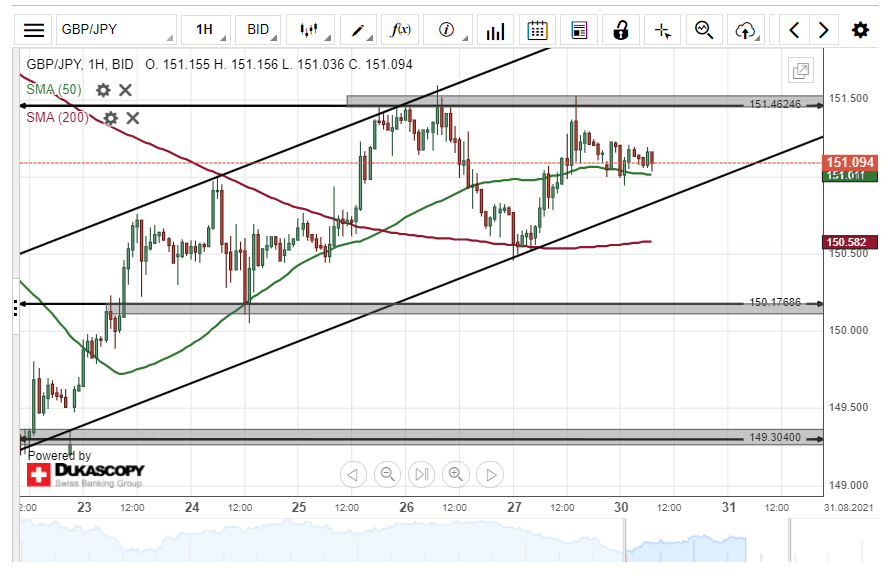
The GBP/JPY currency pair bounced off a support level formed by the 200– hour simple moving average at 150.57 on Friday. As a result, the British Pound rose by 89 pips or 0.59% against the Japanese Yen during Friday's trading session.
Technical indicators suggest that the exchange rate could continue to trend higher during the following trading session. The possible target for bullish traders will be near the 152.00 area.
However, the currency exchange rate could encounter a resistance level at 151.46 within this session.
AUD/USD Breaks Resistance At 0.7280
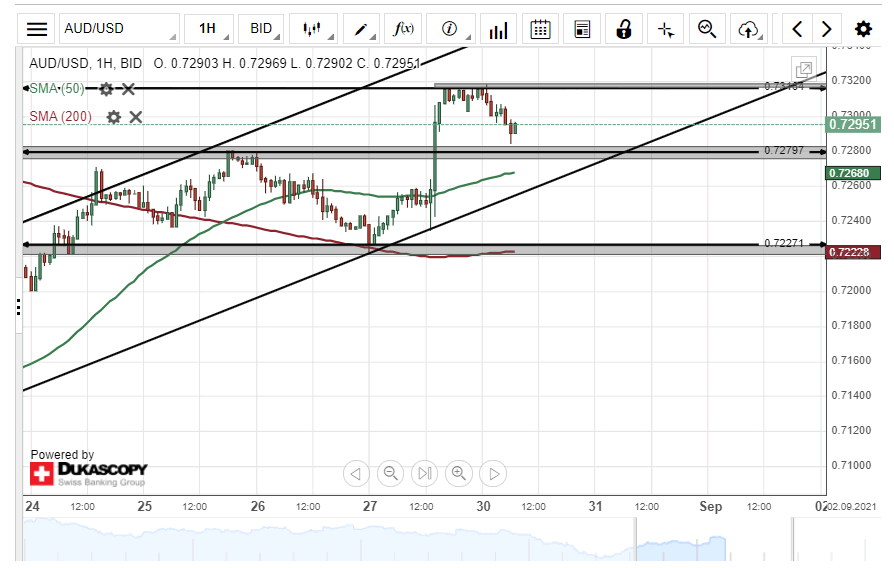
On Friday, the Australian Dollar edged higher by 90 pips or 1.25% against the US Dollar. The currency pair breached the resistance level at 0.7279 during Friday's trading session.
All things being equal, bullish traders are likely to continue to push the price of the AUD/USD pair higher during the following trading session. The potential target for buyers will be near the 0.7360 level.
However, the daily resistance level at 0.7320 could provide resistance for the currency exchange rate within this session.
EUR/JPY Remains Below 129.65
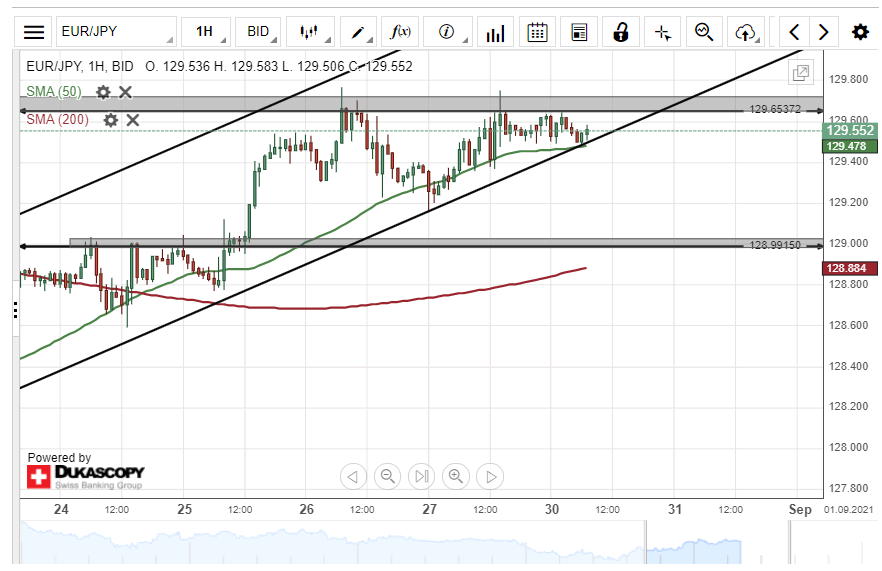
On Friday, the common European currency surged by 42 pips or 0.32% against the Japanese Yen. However, buyers encountered resistance at 129.65 during Friday's trading session.
Technical indicators suggest buying signals on the 4H time-frame chart. Most likely, bullish traders could push the exchange rate past the weekly resistance level at 129.65 within this session.
But, if the resistance line holds, a breakout through the lower boundary of an ascending channel pattern could occur today.
ECB Villeroy: No urgency to decide on asset purchases at Sep meeting
ECB Governing Council member, Bank of France Governor Francois Villeroy de Galhau told BFM Business radio that the economies in France and the euro zone should be back to pre-COVID levels in early 2022 or maybe earlier.
He added there is no risk of higher inflation at this stage, and there is no risk of a sustainable surge in inflation in the Eurozone. He expected PEPP purchases to be there until at least March 2022. There is no urgency to decide on asset purchases at the September meeting.
Daily Technical Analysis
EUR/USD
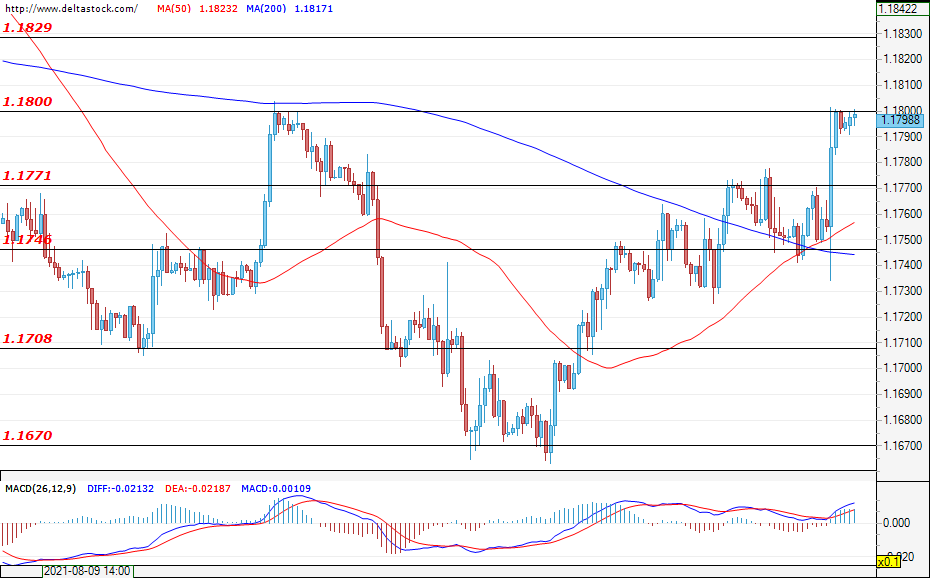
Current level - 1.1798
At the end of last week, the currency pair made yet another attempt at breaching the resistance level of 1.1770 which, this time around, proved to be successful. At the time of writing the analysis, the EUR/USD is headed towards a test of the next resistance and psychological level of 1.1800. If the bulls keep the momentum going and start the week with a confirmed breach of 1.1800, then we might see a test of 1.1830 and even one of 1.1890, which would be coming from the higher time frames. In the negative direction, the previously mentioned level of 1.1770 is now acting as a support. This week, investors' attention will be focused on the data on the non-farm payrolls change for the U.S. (Friday; 12:30 GMT), consumer price index for the euro area (Tuesday; 09:00 GMT) and on the data on the ADP non-farm employment change for the U.S. (Wednesday; 12:15 GMT).
| Resistance | Support | ||
| intraday | intraweek | intraday | intraweek |
| 1.1800 | 1.1890 | 1.1770 | 1.1670 |
| 1.1830 | 1.1890 | 1.1746 | 1.1600 |
USD/JPY
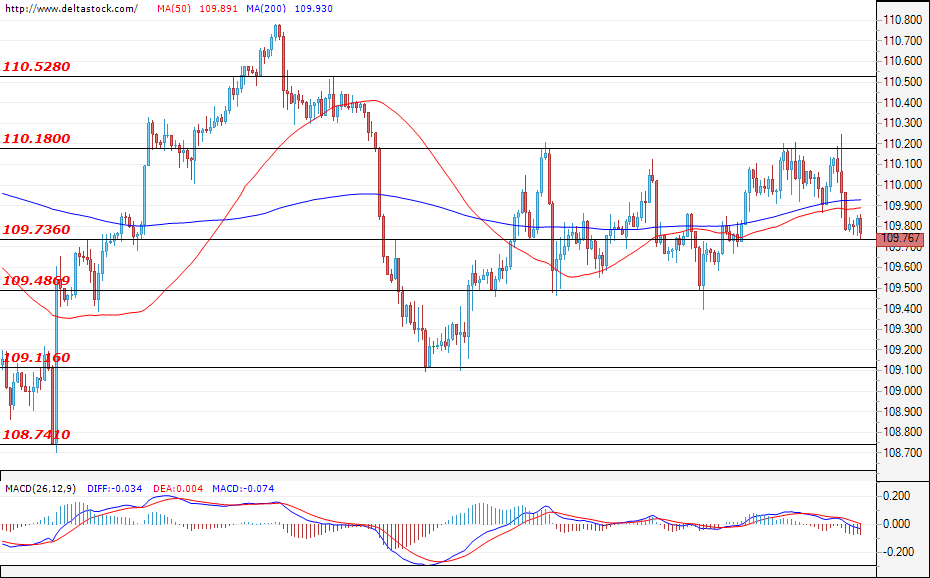
Current level - 109.76
The currency pair continues to trade in the narrow range between 109.48 and 110.18 and this might continue for a couple more days, before either of the borders is violated. At the time of writing, the most likely scenario is for the pair to test the bottom border of the range and approach the support level of 109.11.
| Resistance | Support | ||
| intraday | intraweek | intraday | intraweek |
| 110.18 | 110.52 | 109.73 | 109.11 |
| 110.52 | 111.00 | 109.48 | 108.74 |
GBP/USD
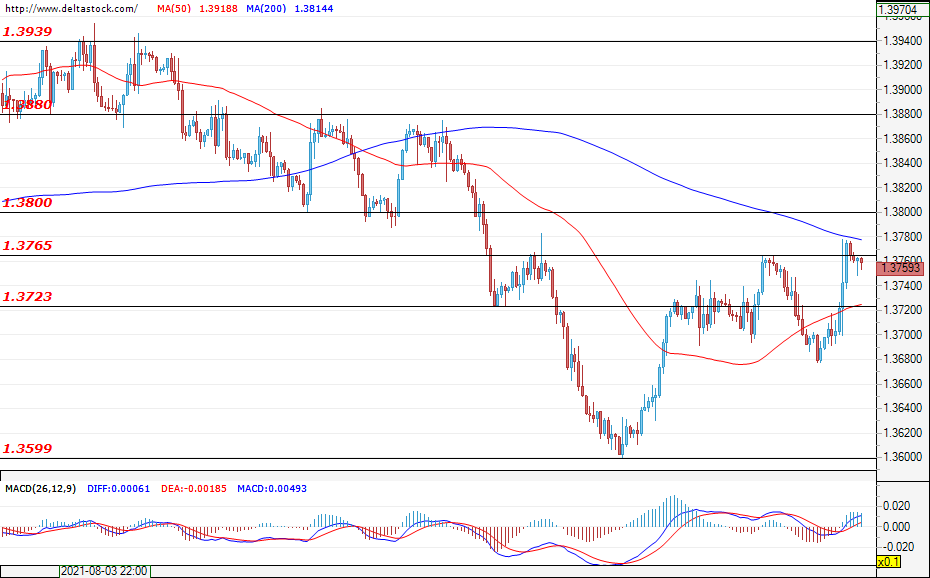
Current level - 1.3759
At the end of last week, the Cable re-tested the resistance level of 1.3765 and, this time, the test was successful. The forecast is for the dollar to depreciate against the sterling and for the pair to test the resistance level of 1.3800. In the negative direction, the closest support level is 1.3723, while the main support is found at 1.3600. During this week, the most important economic news that would affect the movement of the Cable is the data on the manufacturing PMI (Wednesday; 08:30 GMT) and the data on the services PMI (Friday; 08:30 GMT), both for the U.K.
| Resistance | Support | ||
| intraday | intraweek | intraday | intraweek |
| 1.3800 | 1.3880 | 1.3723 | 1.3567 |
| 1.3880 | 1.3939 | 1.3600 | 1.3508 |
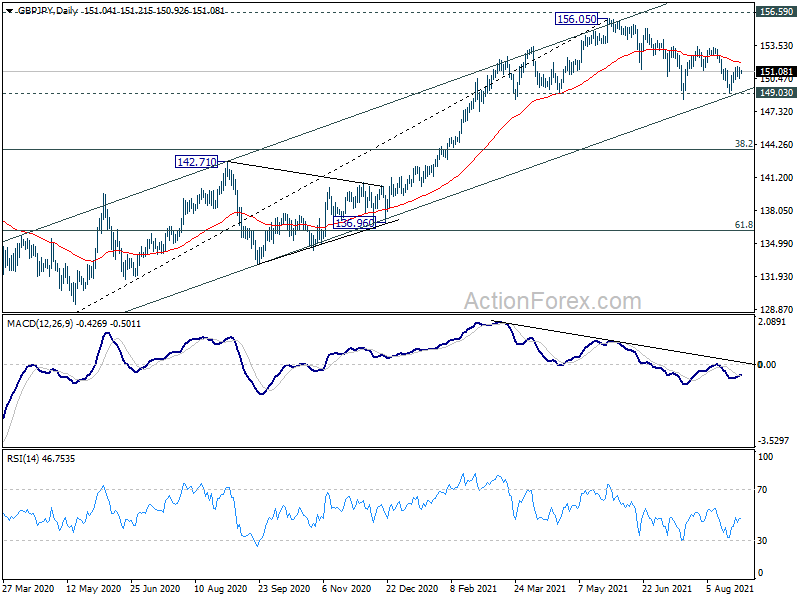
GBP/JPY Daily Outlook
Daily Pivots: (S1) 150.56; (P) 151.04; (R1) 151.61; More...
Intraday bias in GBP/JPY remains neutral at this point. On the upside, firm break of 151.38 will turn bias to the upside for 153.42 resistance first. Break there will argue that whole corrective pattern from 156.05 has completed, and bring retest of this high. On the downside, however, decisive break of 149.03 support will carry larger bearish implication and target 143.78 fibonacci level next.
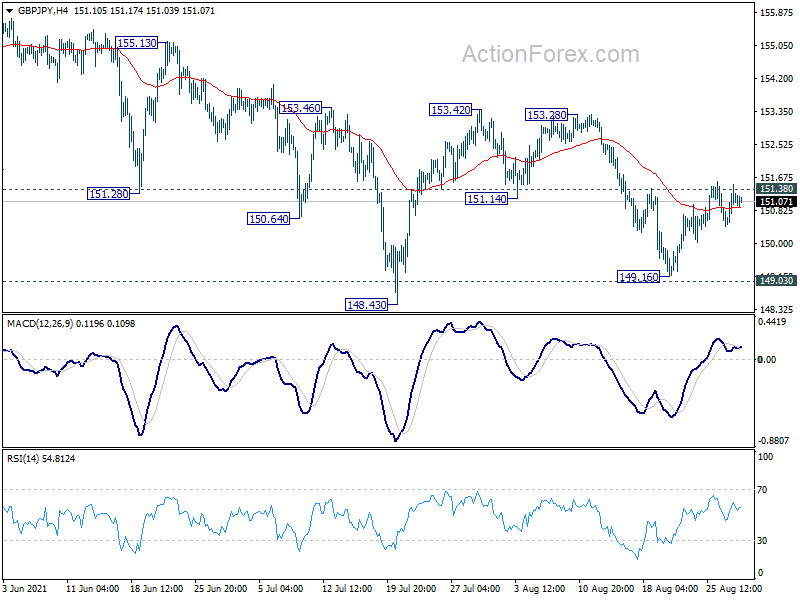
In the bigger picture, rise from 123.94 is seen as the third leg of the pattern from 122.75 (2016 low). As long as 149.03 support holds, such rise would still resume at a later stage. However, sustained break of 149.03 support will indicate rejection by 156.59. Fall from 156.05 would be at least correcting the whole rise from 123.94. Deeper fall would be seen back 38.2% retracement of 123.94 to 156.05 at 143.78 first.