

Sample Category Title
EUR/USD Daily Outlook
Daily Pivots: (S1) 1.1657; (P) 1.1687; (R1) 1.1707; More...
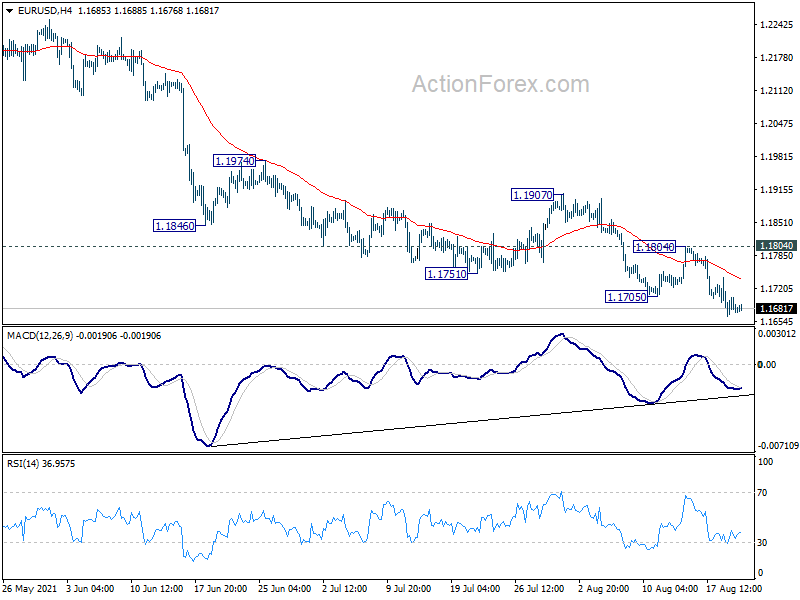
Intraday bias in EUR/USD remains on the downside for the moment. We'd continue to look for strong support from 1.1602/1703 support zone to bring rebound. On the upside, above 1.1804 resistance will turn bias back to the upside for 1.1907 resistance first. However, sustained break of 1.1602/1703 will carry larger bearish implication and pave the way to 1.1289 fibonacci support.
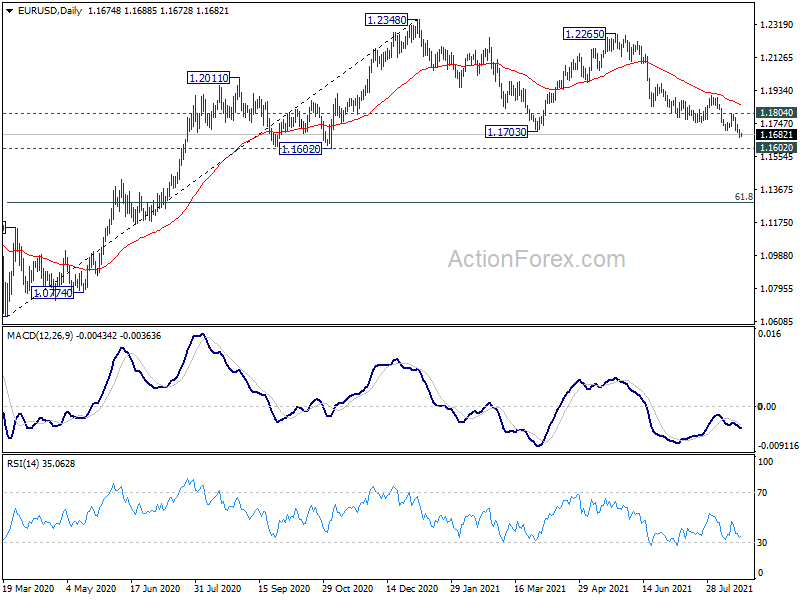
In the bigger picture, rise from 1.0635 is seen as the third leg of the pattern from 1.0339 (2017 low). Further rally remains in favors long as 1.1602 support holds, to cluster resistance at 1.2555 next, (38.2% retracement of 1.6039 to 1.0339 at 1.2516). Reaction from 1.2555 should reveal underlying long term momentum in the pair. However sustained break of 1.1602 will argue that the rise from 1.0635 is over, and turn medium term outlook bearish again. Deeper fall would be seen to 61.8% retracement of 1.0635 to 1.2348 at 1.1289 and below.
GBP/USD Daily Outlook
Daily Pivots: (S1) 1.3592; (P) 1.3675; (R1) 1.3717; More...
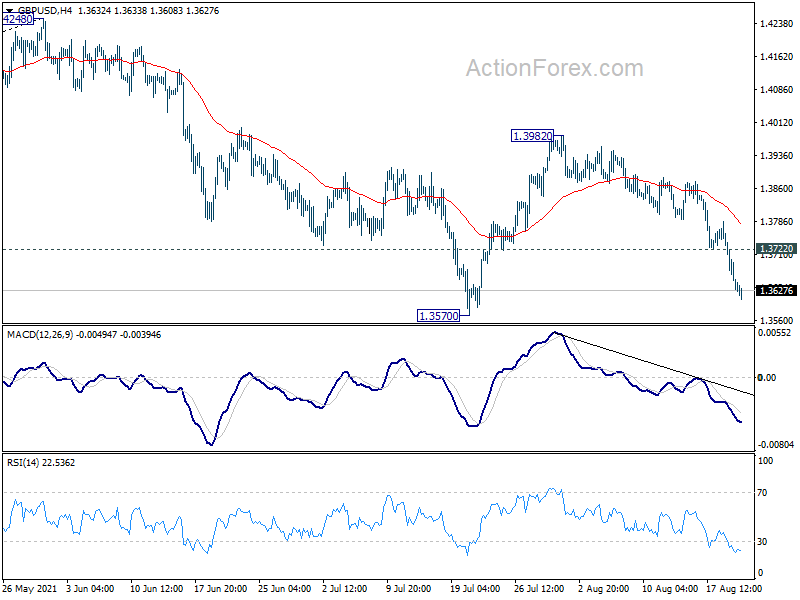
Intraday bias in GBP/USD remains on the downside for 1.3570 support first. Break there will resume the fall form 1.4248 to 1.3482 resistance turned support. Firm break there will carry larger bearish implication and target 38.2% retracement of 1.1409 to 1.4248 at 1.3164. On the upside, above 1.3722 minor resistance will mix up the near term outlook and turn intraday bias neutral first.
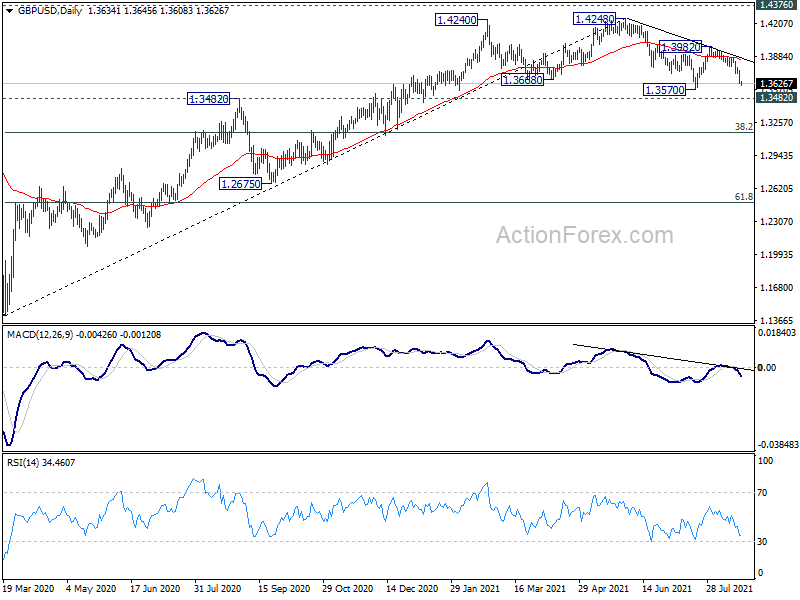
In the bigger picture, as long as 1.3482 resistance turned support holds, up trend from 1.1409 should still continue. Decisive break of 1.4376 resistance will carry larger bullish implications. However, firm break of 1.3482 will argue that the rise from 1.1409 has completed. GBP/USD would then be seen as in another leg of long term range pattern between 1.1409 and 1.4376. Deeper fall could then be seen to 61.8% retracement of 1.1409 to 1.4248 at 1.2493, and even below.
USD/CHF Daily Outlook
Daily Pivots: (S1) 0.9154; (P) 0.9180; (R1) 0.9215; More....
Intraday bias in USD/CHF remains neutral and outlook is unchanged. On the upside, break of 0.9241 resistance should resume the rise from 0.8925 through 0.9273. On the downside, break of 0.9098 will target 0.9017 support first. Further break there will likely resume the decline from 0.9471 through 0.8925 low.
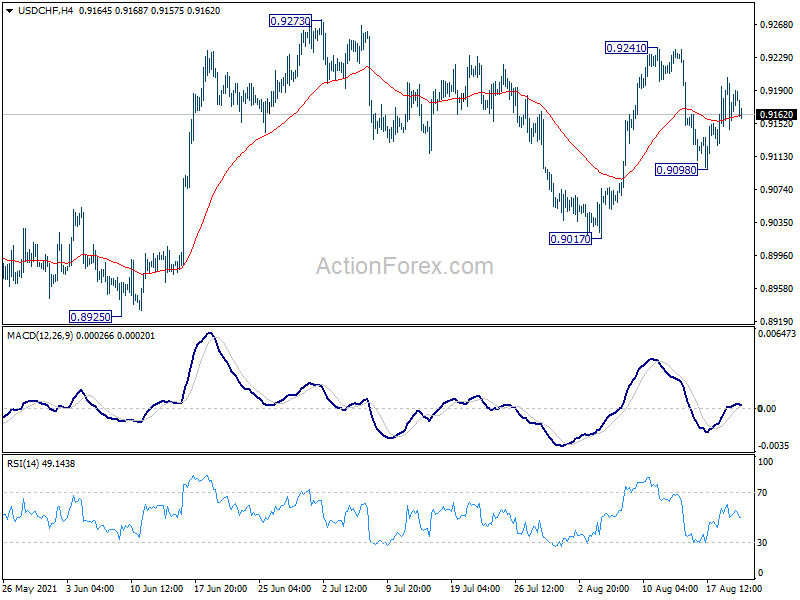
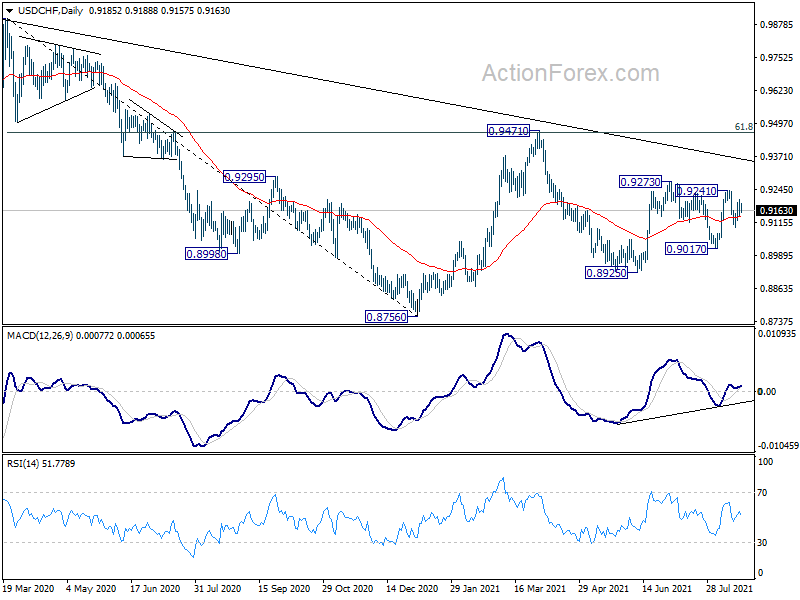
In the bigger picture, the failure to sustain above 55 week EMA (now at 0.9184) retains medium term bearish in USD/CHF. Break of 0.8925 support should resume the whole decline form 1.0342 (2016 high) through 0.8756 low. However, break of 0.9273 resistance and sustained trading above 55 week EMA will be an early sign of bullish trend reversal. Focus will then turn to 0.9471 resistance for confirmation.
WTI Oil Outlook: WTI Oil On Track For A Weekly Drop Of Over 5%
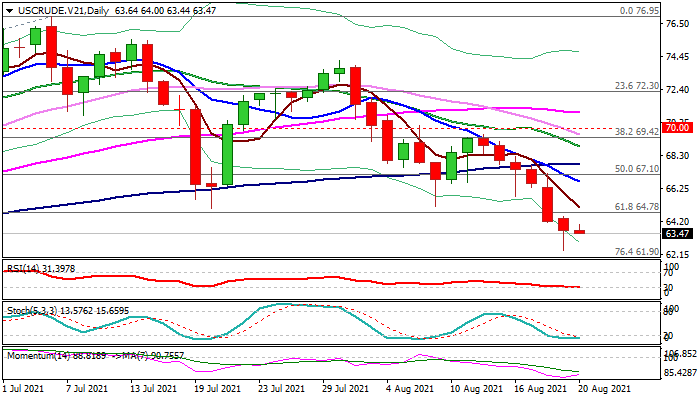
Bears are taking a breather and consolidating above three-month low ($62.39) in early Friday trading, following a steep fall in past six days.
The contract is on track for a weekly loss of over 5% as surging cases of Delta variant of coronavirus and new lockdowns in some countries, raised fears about slowdown in global demand and soured the sentiment, with fresh risk aversion in the market that pushed the dollar higher, also weighing on oil prices.
The recent drop retraced over 61.8% of the upleg from $57.25 (Mar 23 trough) to $76.95 (July 6 peak), marking the biggest correction in 2021 so far.
Daily studies are in bearish setup and favor further weakness after the correction, signaled by oversold conditions and fading bearish momentum, as well as expectations for profit-taking at the end of the week.
Strong barriers at $64.78 (broken Fibo 61.8%) and $65.02/12 (former double-bottom of July 20/Aug 9) should ideally cap upticks and keep bears intact, but stronger correction cannot be ruled out.
Falling 10DMA ($66.69) marks next significant obstacle, guarding 100DMA ($67.79) which is expected to limit extended upticks.
Res: 64.00, 64.78, 65.12, 66.00.
Sup: 63.00, 62.39, 61.90, 61.54.
UK retail sales dropped -2.5% mom in Jul, ex-fuel sales dropped -2.4% mom
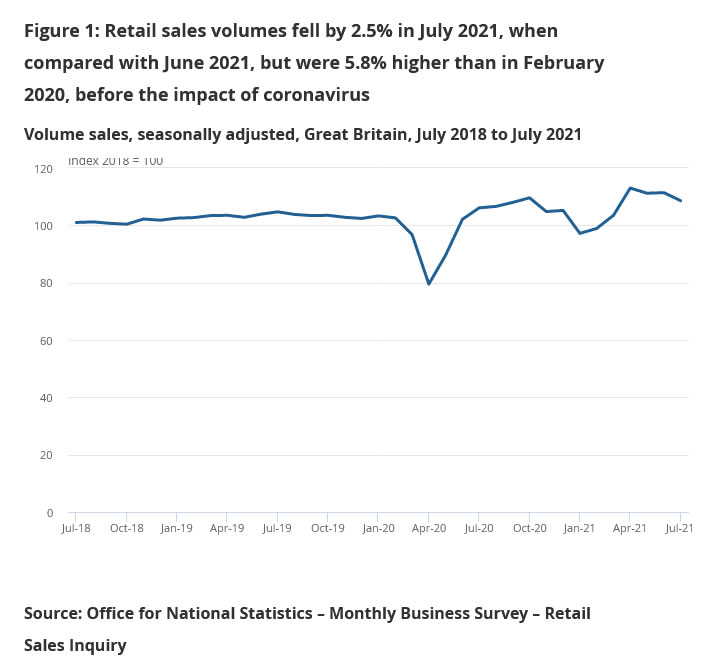
UK retail sales dropped -2.5% mom in July, well below expectation of 0.4% mom. Ex-fuel sales dropped -2.4% mom. Over the last 12 months, retail sales rose 2.4% yoy, below expectation of 6.4% yoy. Ex-fuel sales rose 1.8% yoy.
Retail sales volumes over the last three months were up 11.1% on a year earlier.
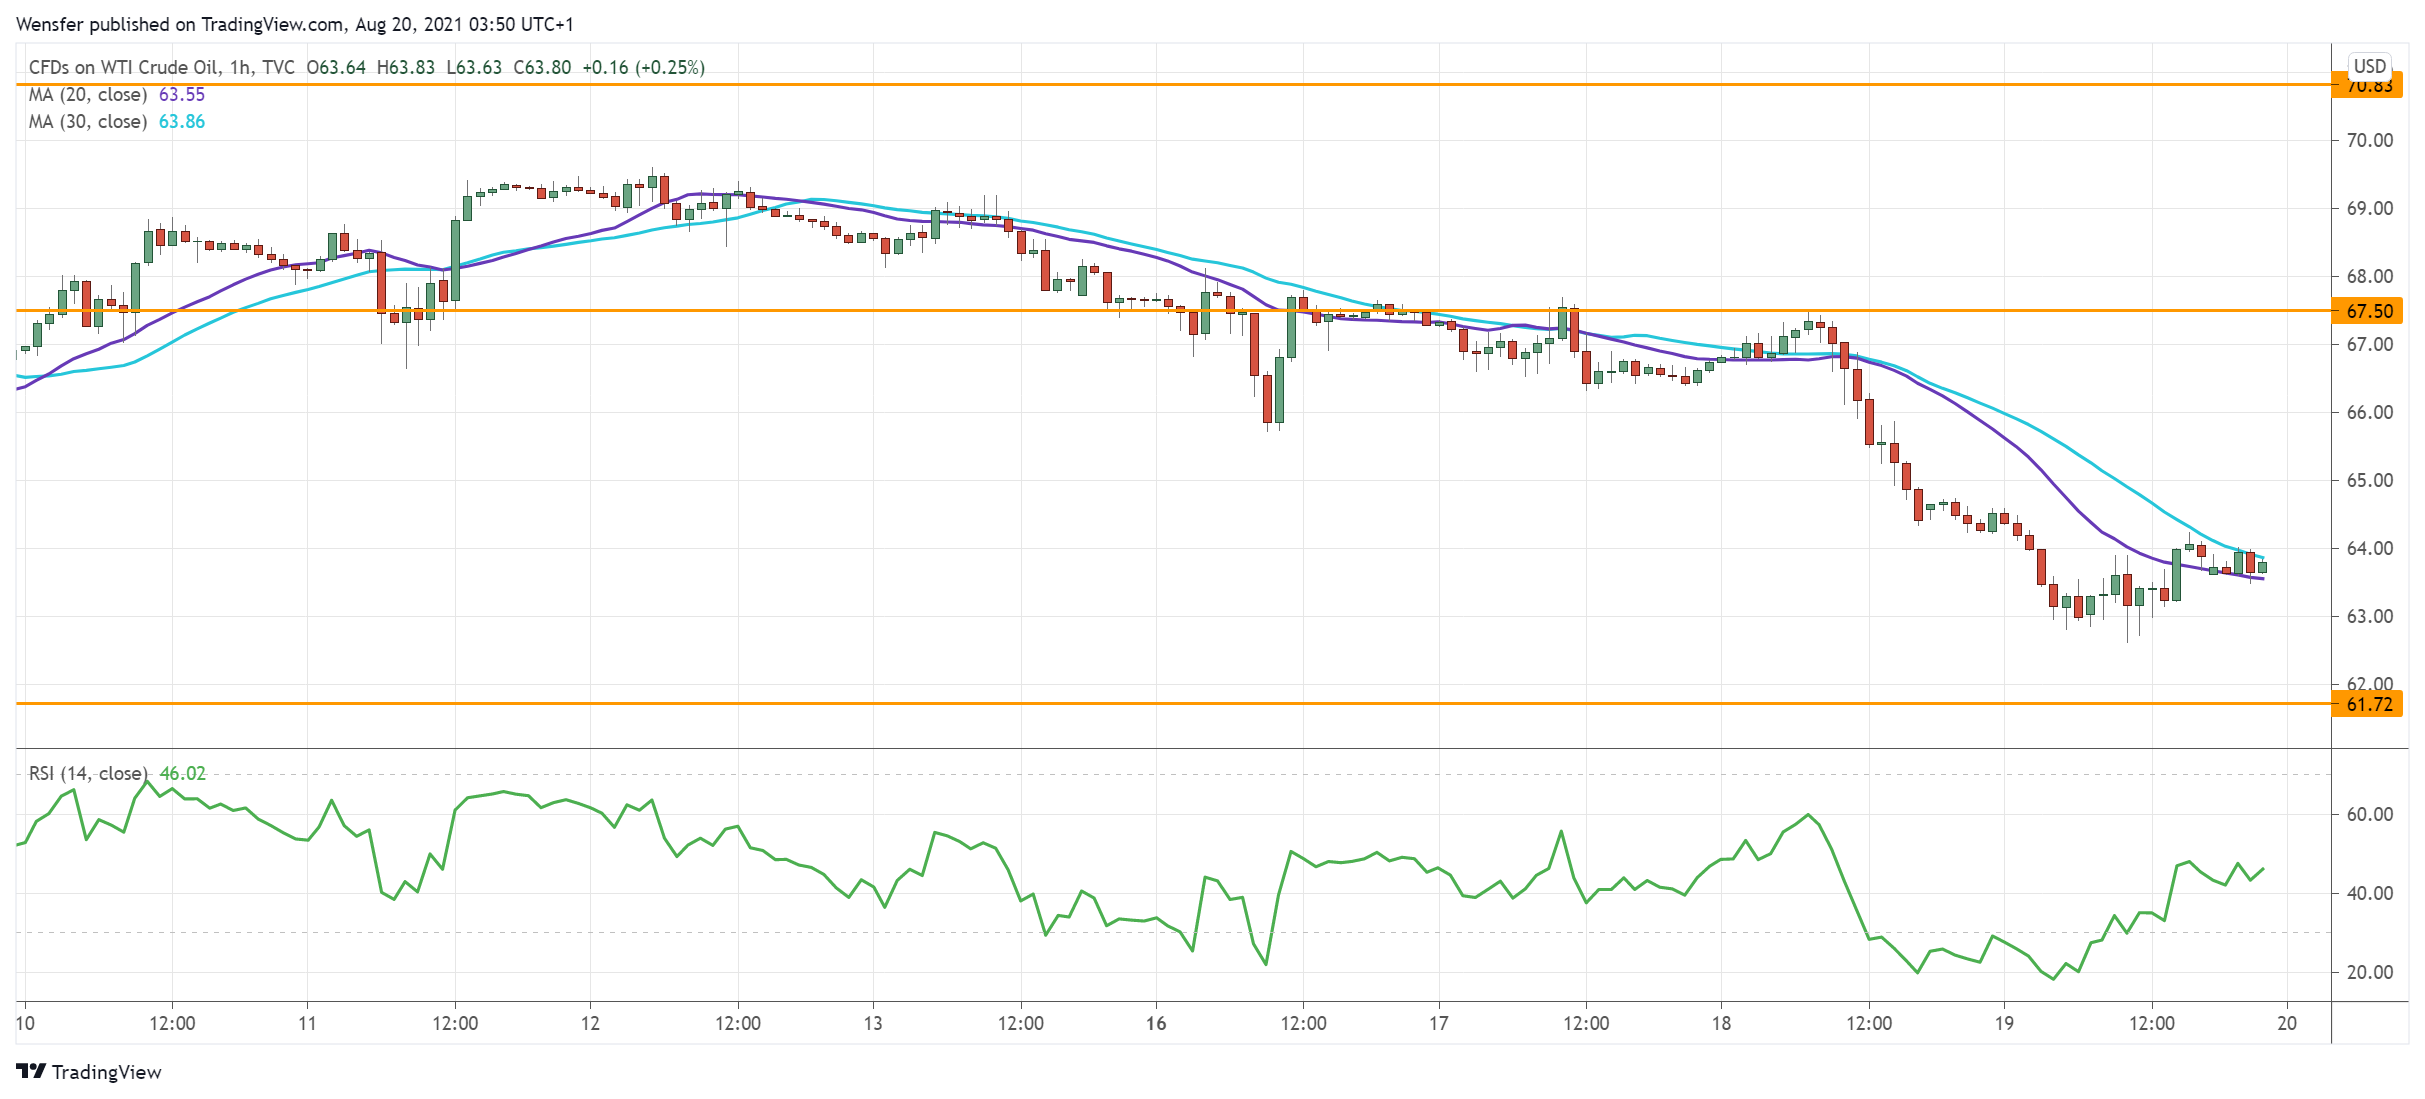
USOIL Drops To Daily Support
Oil prices plunge amid concerns over weaker demand and higher US inventories.
The downtrend picked up steam after WTI fell below the double bottom at 65.20. Last May’s low at 61.70 is major support from the daily time frame.
As the RSI recovers from an oversold situation, traders could be waiting to buy the dip in the demand zone. However, its breach could threaten the 16-month long rally.
On the upside, buyers will need to clear 67.50 before they could expect a meaningful rebound.
AUD/JPY Sees Limited Bounce
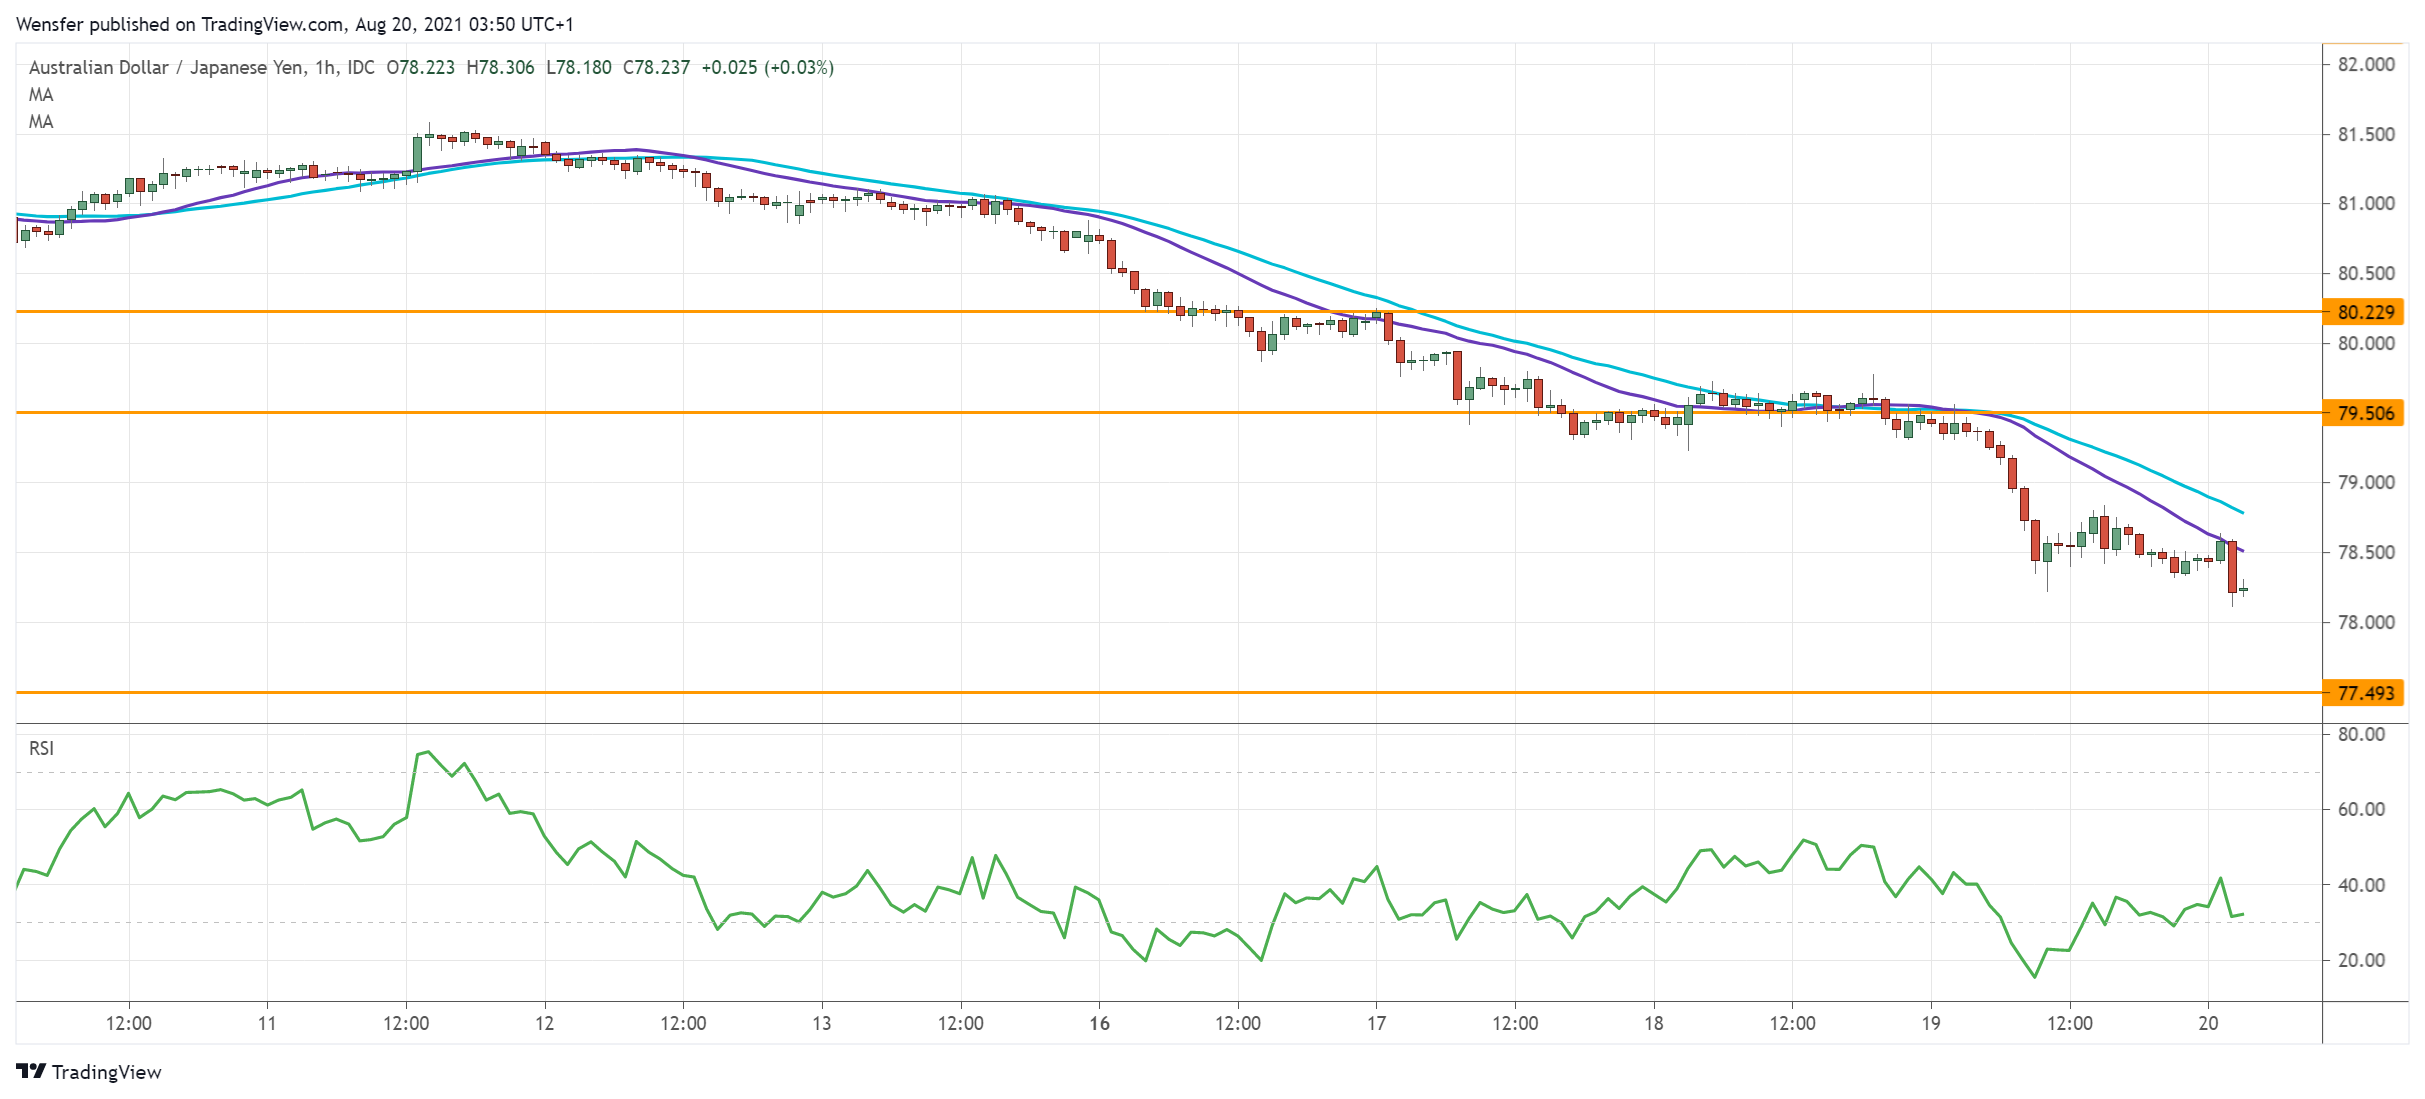
The Australian dollar struggles as jobs data suggest fewer people looking for work amid lockdowns.
The pair is heading towards 77.50 as momentum traders took over control of price action.
The divergence between the 20 and 30-hour moving averages suggests an increase in the sell-off. Sentiment would stay downbeat as long as the Aussie is below the averages.
Though a limited bounce is likely to let the RSI return to the neutrality area. The bears would be eager to add stakes near the resistance at 79.50.
NAS 100 Tests New Resistance
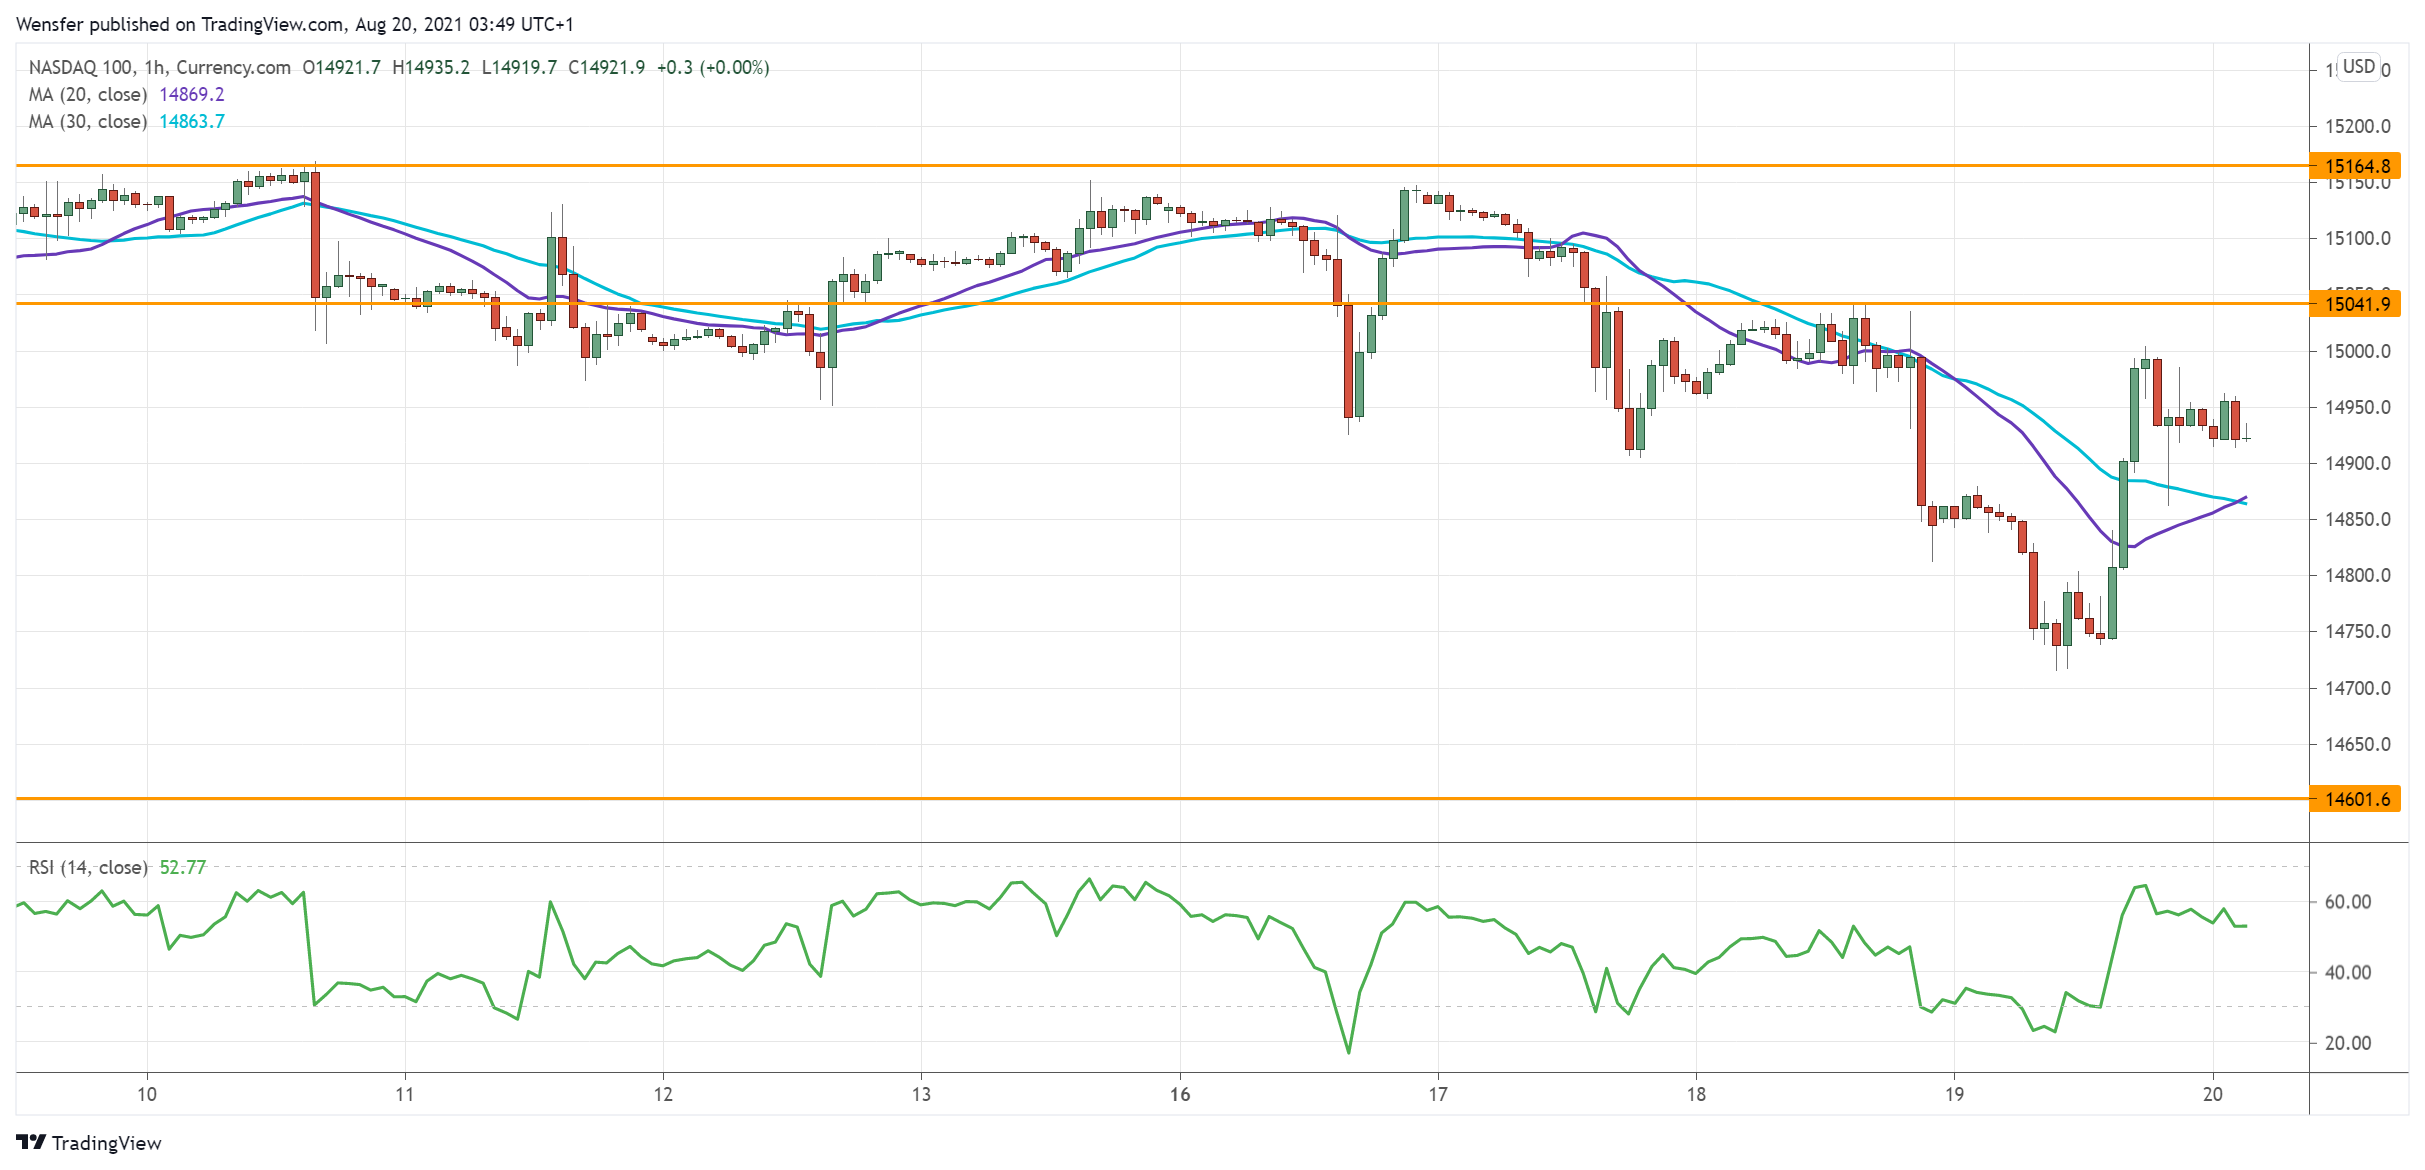
The Nasdaq 100 slipped after the Fed meeting minutes raised odds for tapering. The fall below 14880 has triggered strong bearish momentum as leveraged buyers were forced to close their positions.
The market remains cautious while the RSI rises back from an oversold situation. A rebound could be short-lived unless it lifts offers near 15040.
A lack of support may send the index to the critical support at 14600 on the daily chart. A breakout could trigger a bearish reversal in the medium term.
Will Powell Give The Official Go-Ahead For A September Tapering Announcement?
Markets
Wall Street’s Wednesday post-FOMC sell-off spilled into Asian and European trading yesterday. Main European indices lost over 1.5%. Car makers were amongst the underperformers following reports from Toyota and Ford that they would (partially) halt production in a couple of months because of the continued lack of semiconductor supply. Supply chain constraints remain a major issue which risk hitting other sectors too (construction?) and via higher prices turn consumers more cautious. It shouldn’t surprise that growth slows following record-breaking quarterly dynamics, but the spreading Delta-variant and its potential economic consequences add another layer. What would worry us the most is that consumption effectively grinds to a halt because of the inflation levy, resulting in a stagflationary rather than a reflationary world. For now, that’s a wildcard but not our base scenario.
Core bonds’ performance was rather disappointing given the amount of risk aversion. In the case of German Bunds, this lethargic trading pattern has been going on for some weeks now. In case of US Treasuries, underlying details show the combination of bottoming out US real yields with topping off inflation expectations. The latter suggests that Fed policy normalization at least balances growth fears for now. The US yield curve flattened in a daily perspective with yield changes ranging between +0.4 bps (2-yr) and -2.6 bps (30-yr). German yields lost 0.3 bps (2-yr) to 1.7 bps (30-yr), bull flattening the curve. The US dollar and the Japanese yen hang in the balance as star performer in the risk-off climate. The trade-weighted dollar in any case pierced through the previous YTD high (93.44), paving the way for the November top of 94.30. If confirmed today, it strengthens the break south in EUR/USD (1.1704/1.1695) as the single currency fails to strengthen its back. EUR/USD closed at 1.1675. Commodities and commodity-related currencies were amongst the underperformers yesterday.
Asian stock markets lose more ground this morning with China significantly underperforming (-2.5%) as the government broadens its regulatory grip once more (see below). Commodity markets tentatively recover from yesterday’s beating. The eco calendar is empty, giving way for risk sentiment to once more set the general trading tone. Apart from that, the countdown to next week’s Jackson Hole symposium (Aug 26-28) will intensify. Will Powell give the official go-ahead for a September tapering announcement?
News headlines
Japanese national CPI inflation fell -0.3% y/y in July. That’s less than the expected -0.4% but follows a huge revision of the June figure from 0.2% to -0.5%. This, however, is the result of a change in the base year (2020 instead of 2015) which weighed down all 2021 CPI readings from January to June. Core inflation fell -0.6% (-0.8% expected), a slower decline compared to the revised -0.9% the month before. Regardless of the statistical issues, CPI clearly remains well below the central bank’s 2% target, the Bank of Japan will need to maintain its very easy policy stance for the foreseeable future.
China further tightened the screws on big tech in order to curb their influence on society. The country has passed legislation that toughens rules for how companies handle user data. According to earlier drafts, tech firms would be required to get user consent to collect, use and share information while also providing a way for them to opt out. The new law goes into effect September 1st. The new privacy (and other recently approved) rules could severely hurt several online services offered by Chinese tech companies that rely on big data to target consumers and capture their (buying) behaviour. A strong selloff wave rolls over to Chinese (tech) stocks this morning.
Oil To Correct To $55 By End Of Year
Brent crude fell to $66, at one point yesterday falling below $65, the area of the May lows, bringing the decline since the start of August to $10 or 13%.
This week oil prices have fallen below last month’s local bottom, forming a sequence of declining highs and lows.
On more than one occasion in the history of crude oil, the price dynamics in the first and second half of the year have contrasted sharply: the strong rally of the first months of the year gave way to a persistent sell-off since July-September. This was the case in 2005-2008, in 2014-2015, and 2018. The same pattern seems to be repeating in 2021.
From a macroeconomic perspective, the situation is now like 2014, as in both cases, the Fed was on the verge of tapering. However, the critical difference is that back then, oil was already sideways for several years, against the rapid growth in our case.
At the same time, it is hardly worth betting on a long-term bear market for oil as the economy and, thus, consumption continues to expand. The chronic shortage of oil in recent months, together with ultra-soft monetary policy in developed markets, has pushed the price of oil up and now is the time to take away some overheating. But no more than that.
We are now seeing the start of the Dollar’s strength on expectations of an imminent Fed’s tapering. Policy changes often trigger this kind of market cooling, although one should bear in mind that fewer stimulus is not an economic crisis. Hence, volatility promises to remain limited and short-lived.
From a tech analysis perspective, the corrections nearest target is at $63 per barrel Brent. The 200-day MA and the 76.4% Fibonacci retracement from April 2020-July 2021 are near this price.
But probably the bears will stop there. A return to $55 before the end of the year is more likely. That is at the same time 61.8% of the recovery rally, the price level at the beginning of this year, and the centre of the most important pivot range of the last seven years ($53-57).
If such an adjustment in oil prices does not entail a new tightening of production quotas, it will contain inflationary pressures and allow the global economy to regain its acceleration. If so, the upward trend in oil prices will return as early as next year, and we will not see a repeat of the heavy bear market of 2008 or 2014.