Sample Category Title
GBP/JPY Daily Outlook
Daily Pivots: (S1) 149.14; (P) 150.18; (R1) 150.72; More...
Intraday bias in GBP/JPY remains on the downside for retesting 148.43 support. Decisive break there will carry larger bearish implication and target 143.78 fibonacci level next. On the upside, above 151.38 minor resistance will turn bias back to the upside for 153.42 resistance instead.
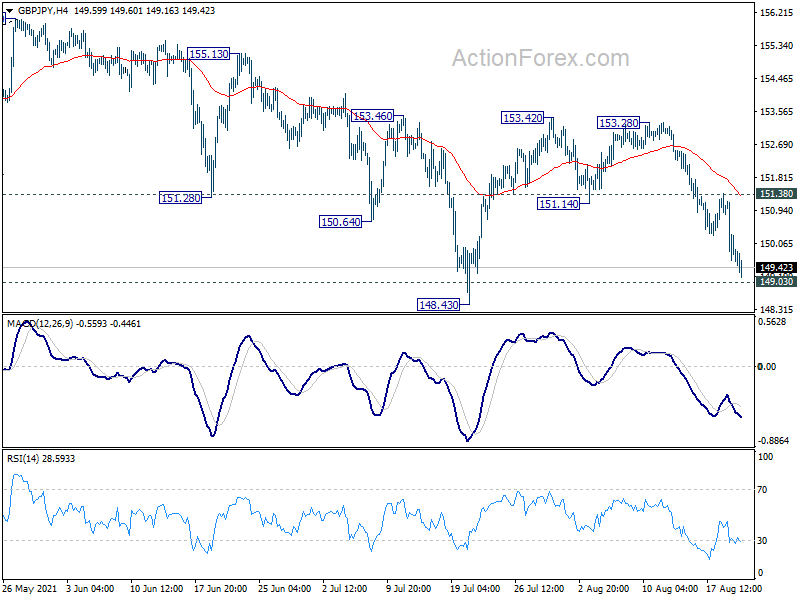
In the bigger picture, rise from 123.94 is seen as the third leg of the pattern from 122.75 (2016 low). As long as 149.03 support holds, such rise would still resume at a later stage. However, sustained break of 149.03 support will indicate rejection by 156.59. Fall from 156.05 would be at least correcting the whole rise from 123.94. Deeper fall would be seen back 38.2% retracement of 123.94 to 156.05 at 143.78 first.
EUR/JPY Daily Outlook
Daily Pivots: (S1) 127.86; (P) 128.28; (R1) 128.63; More....
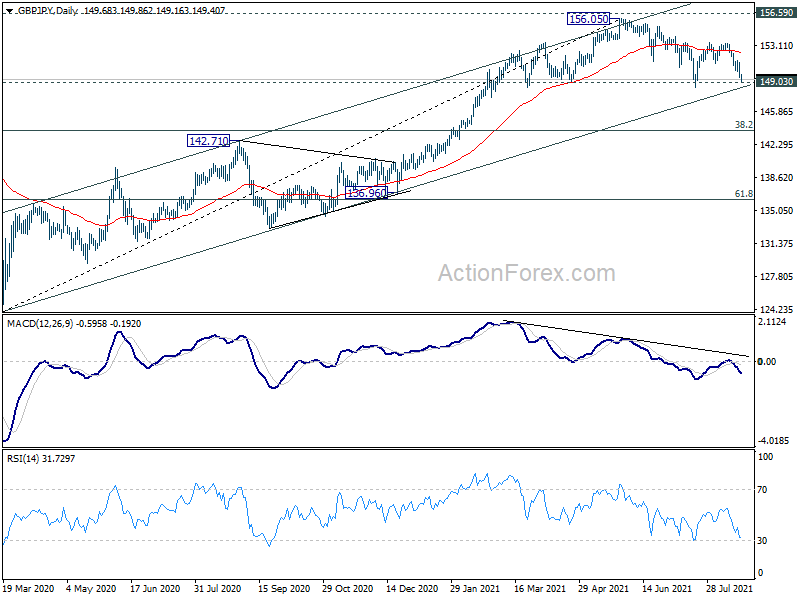
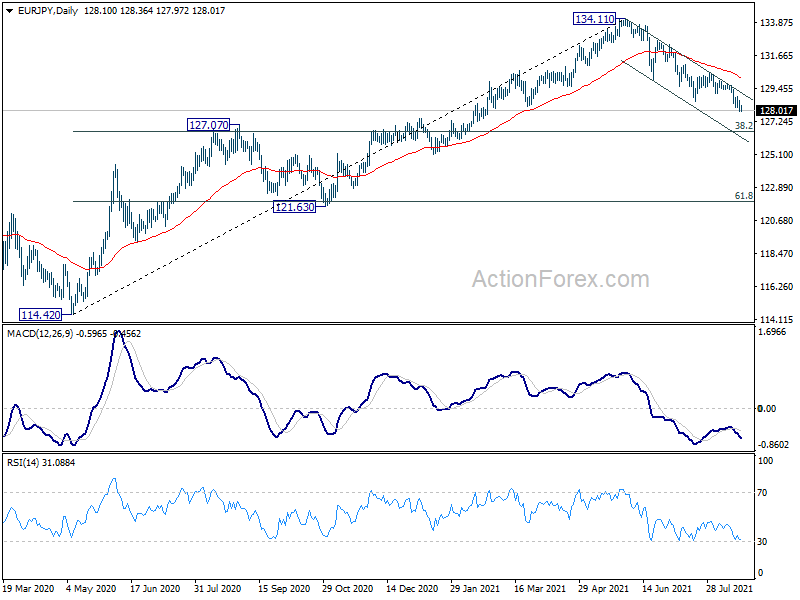
Intraday bias in EUR/JPY remains on the downside at this point. Current fall from 134.11 should continue to 127.07 resistance turned support. That is close to 38.2% retracement of 114.42 to 134.11 at 126.58. On the upside, above 128.93 minor resistance will turn intraday bias neutral first. But outlook will stay bearish as long as 130.54 resistance holds.
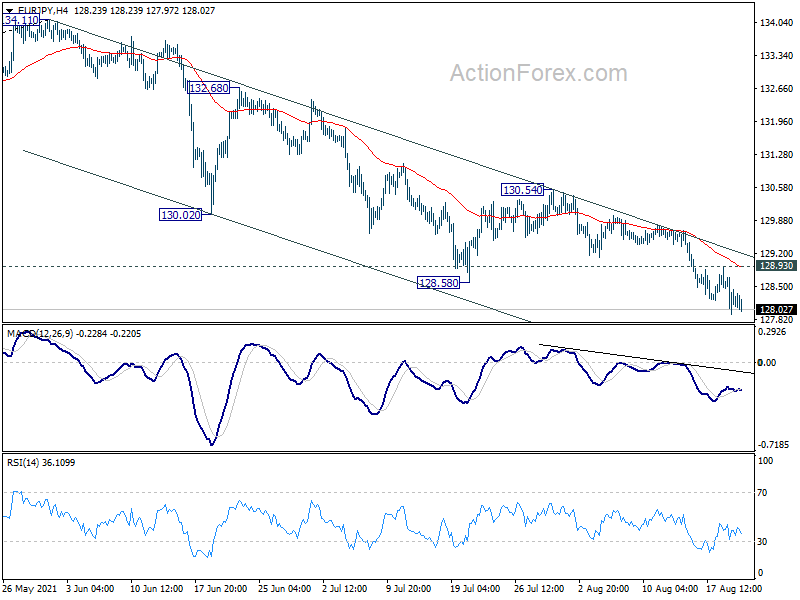
In the bigger picture, rise from 114.42 is seen as a medium term rising leg inside a long term sideway pattern. As long as 127.07 resistance turned support holds, further rise is still expected to retest 137.49 (2018 high). However, firm break of 127.07 will argue that the medium term trend has reversed, and open up the case for retesting 114.42.
EUR/GBP Daily Outlook
Daily Pivots: (S1) 0.8526; (P) 0.8545; (R1) 0.8585; More...
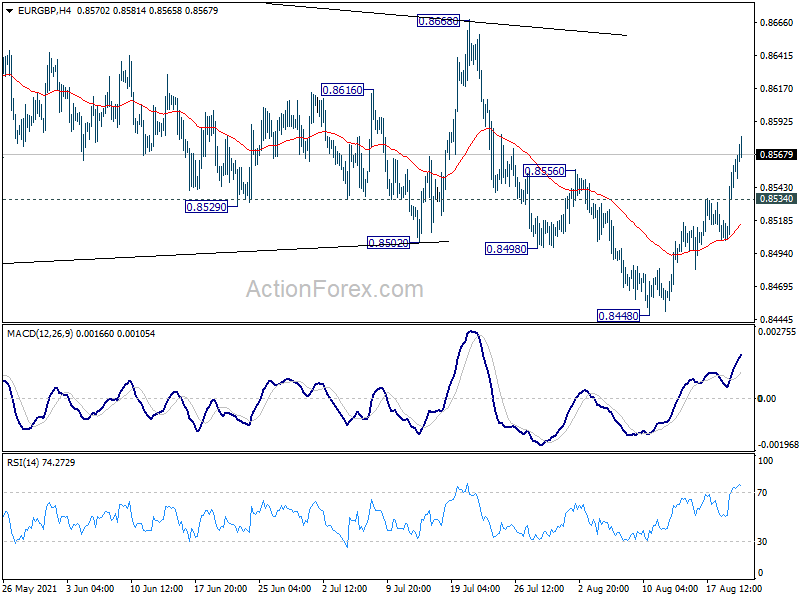
EUR/GBP's break of 0.8556 resistance suggests that fall form 0.8668 has completed at 0.8448 already. Intraday bias is back on the upside for 0.8668 resistance first. Decisive break there will be a strong sign of near term bullish reversal at least. On the downside, break of 0.8534 resistance turned support will mix up the near term outlook again and turn intraday bias neutral first.
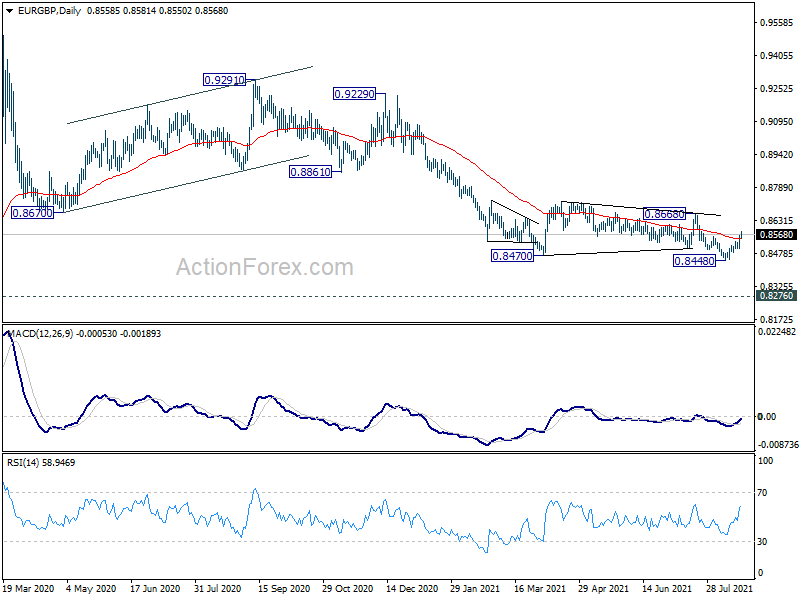
In the bigger picture, price actions from 0.9499 (2020 high) are still seen as developing into a corrective pattern. Deeper fall could be seen as long as 0.8718 resistance holds, towards long term support at 0.8276. However, firm break of 0.8668 resistance would argue that a medium term bottom was already formed. Stronger rise would be seen to 0.8861 support turned resistance to confirm completion of the corrective pattern.
EUR/AUD Daily Outlook
Daily Pivots: (S1) 1.6213; (P) 1.6284; (R1) 1.6406; More...
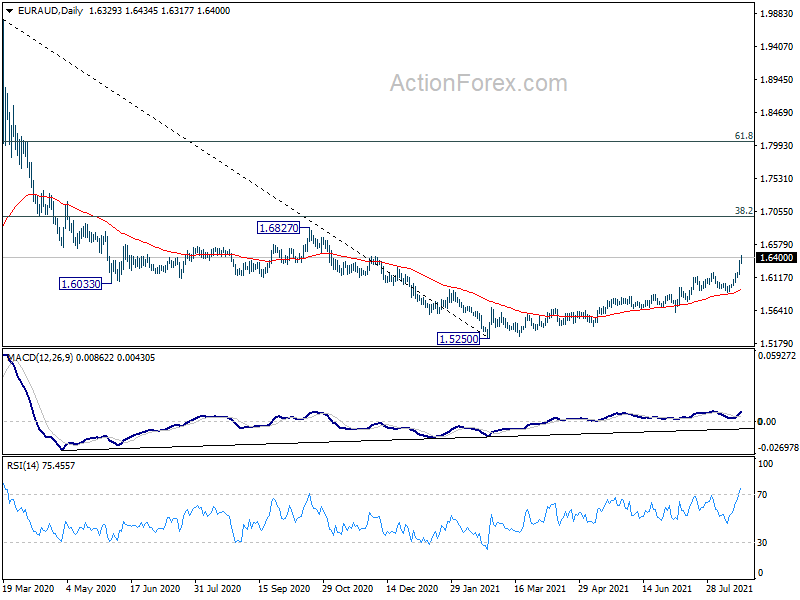
EUR/AUD rises to as high as 1.6434 so far today as rebound from 1.5250 is staying in an acceleration phase. Intraday bias stays on the upside for 1.6827 resistance next. On the downside, below 1.6284 minor support will turn intraday bias neutral and bring consolidations first. But outlook will stay bullish as long as 1.5898 support holds, in case of retreat.
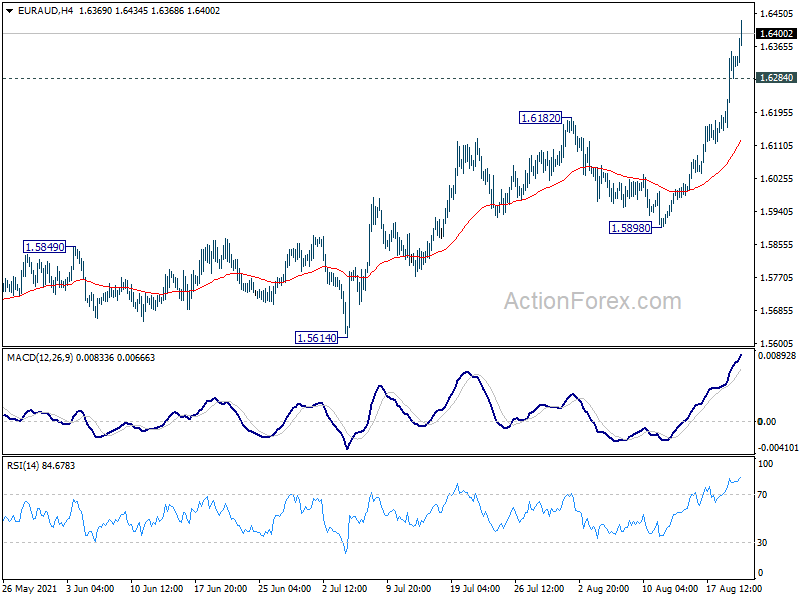
In the bigger picture, rise from 1.5250 medium term bottom is currently seen as a correction to the down trend from 1.9799 first. Stronger rise would be seen to 38.2% retracement of 1.9799 to 1.5250 at 1.6988 next. We'd tentatively expect strong resistance from there to limit upside, at least on first attempt. Meanwhile, break of 1.5898 support will indicate that the rebound has completed and bring retest of 1.5250 low.
The Analytical Overview Of The Main Currency Pairs
The EUR/USD currency pair
Technical indicators of the currency pair:
Prev Open: 1.1713
Prev Close: 1.1676
% chg. over the last day: -0.32%
The European Central Bank does not intend to take any actions to suppress inflation now. Therefore, the situation with the euro will mainly depend on the dynamics of the dollar index.
Trading recommendations
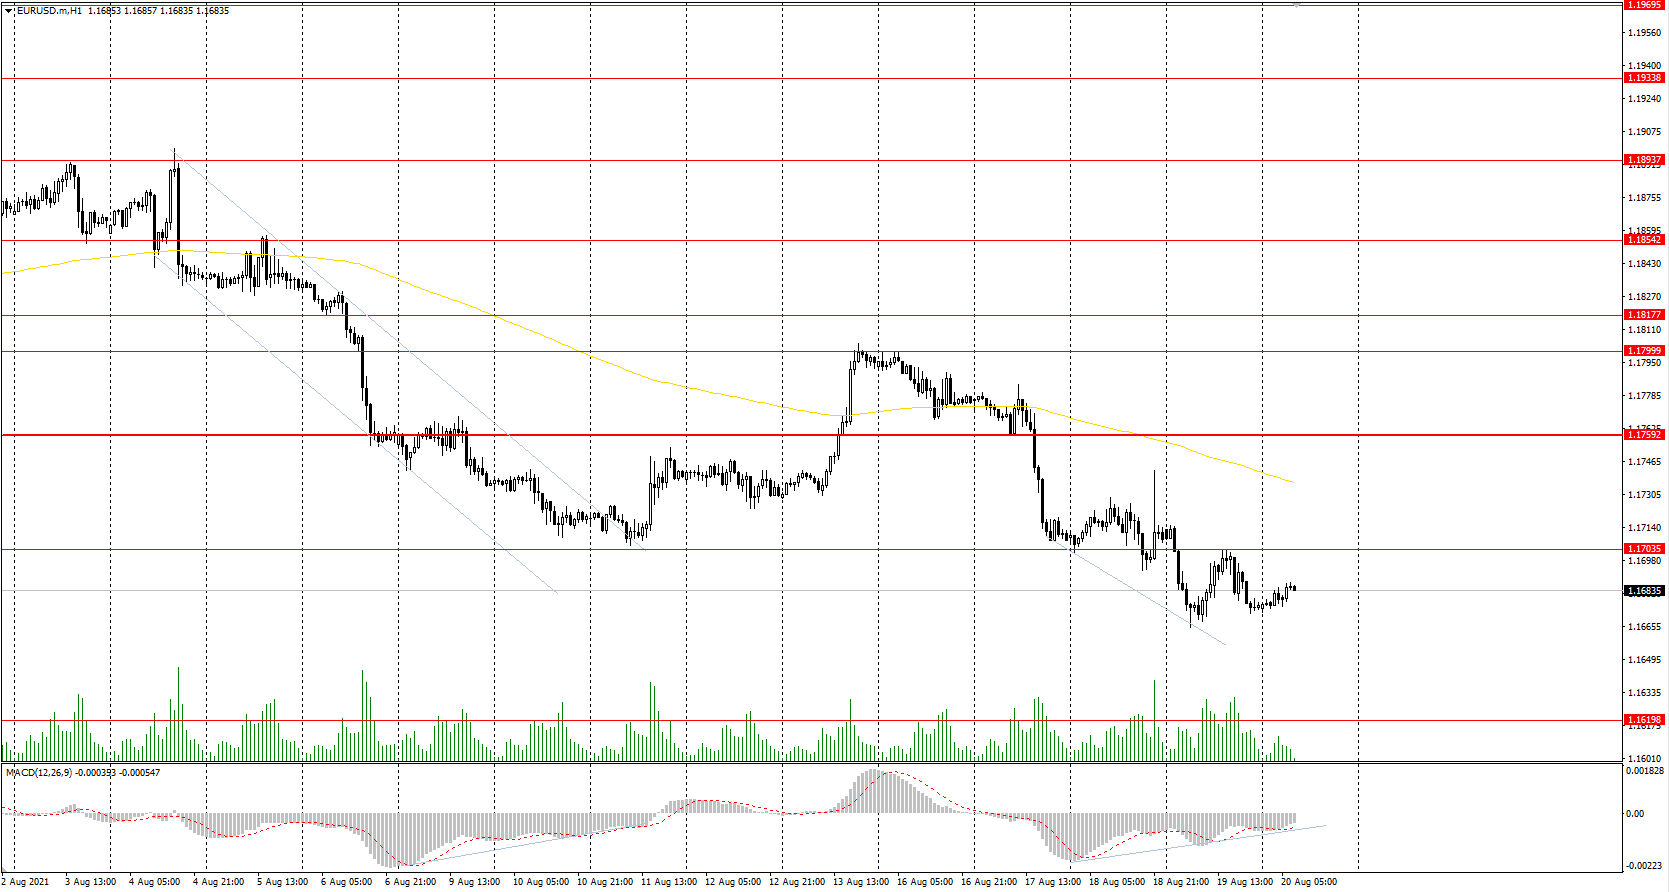
Support levels: 1.1620
Resistance levels: 1.1704, 1.1759, 1.1799, 1.1817, 1.1854, 1.1894, 1.1934, 1.1969
From a technical point of view, the general trend on the EUR/USD currency pair is bearish. The price is declining within a bearish trend. Under such market conditions, it is better to look for the sell deals from the resistance levels when sellers show the initiative. Buy trades can be considered only from the support levels and only after the buyers’ initiative. There is a divergence that occurred in the MACD indicator, so the price may correct a little bit higher.
Alternative scenario: if the price breaks through the 1.1817 resistance level and fixes above, the mid-term uptrend will likely resume.
The GBP/USD currency pair
Technical indicators of the currency pair:
Prev Open: 1.3748
Prev Close: 1.3634
% chg. over the last day: -0.84%
Taking into account the slowdown of inflation, the Bank of England has no plans to change its monetary policy. On the one hand, it is a positive factor for economic recovery. On the other hand, monetary policy is now playing against the British pound. Therefore, as a result of the strengthening of the dollar index, the British pound is declining.
Trading recommendations
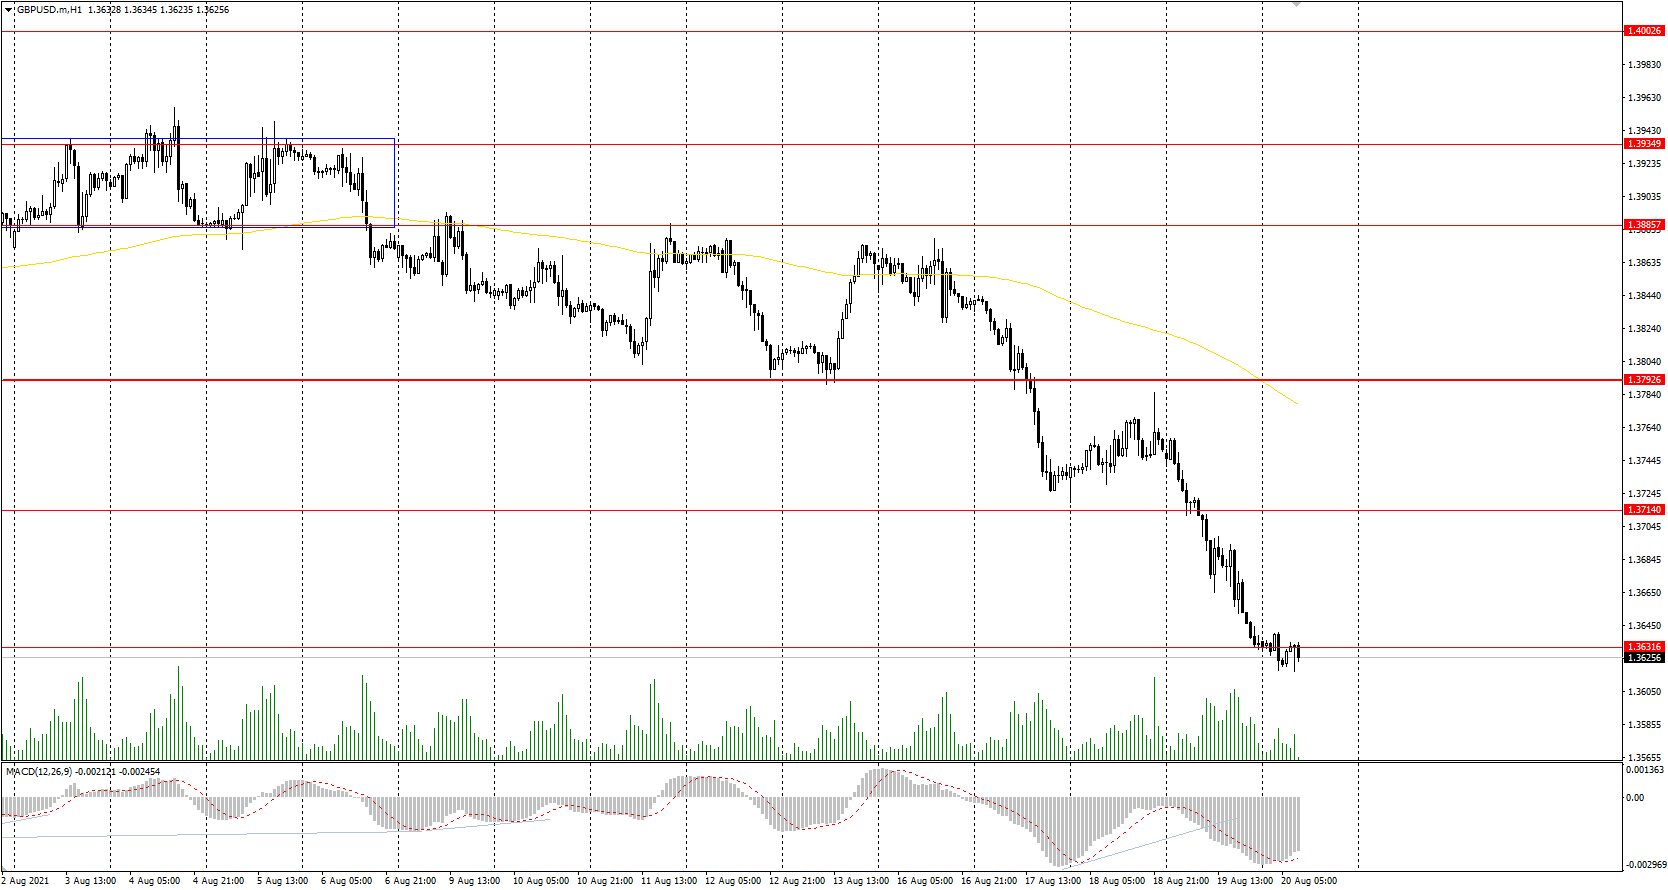
Support levels: 1.3632, 1.3614, 1.3525
Resistance levels: 1.3714, 1.3793, 1.3772, 1.3886, 1.3935, 1.4002
On the hourly time frame, the trend on the GBP/USD currency pair changed to bearish. The price broke through the priority change level and went down. The MACD indicator is in the negative zone, with no signs of reversal. Under such market conditions, traders are better to look for the sell trades from the resistance levels. But the price has now strongly deviated from the moving average and given the presence of support ahead, there is a high probability of a bounce upwards.
Alternative scenario: if the price breaks through the 1.3793 resistance level and consolidates above, the bullish scenario is likely to resume.
News feed for 2021.08.20:
- UK Retail Sales (m/m) at 09:00 (GMT+3).
The USD/JPY currency pair
Technical indicators of the currency pair:
Prev Open: 109.77
Prev Close: 109.76
% chg. over the last day: -0.01%
In July, Japan's consumer price index fell by 0.3% on a year-on-year basis. This didn’t meet the forecasts of economists, who had expected a 0.5% decline. The core consumer price index, which excludes changes in food and fuel prices, fell by 0.2% on a year-on-year basis, beating economists' expectations. The coronavirus continues to constrain economic activity in most cities across the country. Seven more prefectures are under a state of emergency.
Trading recommendations
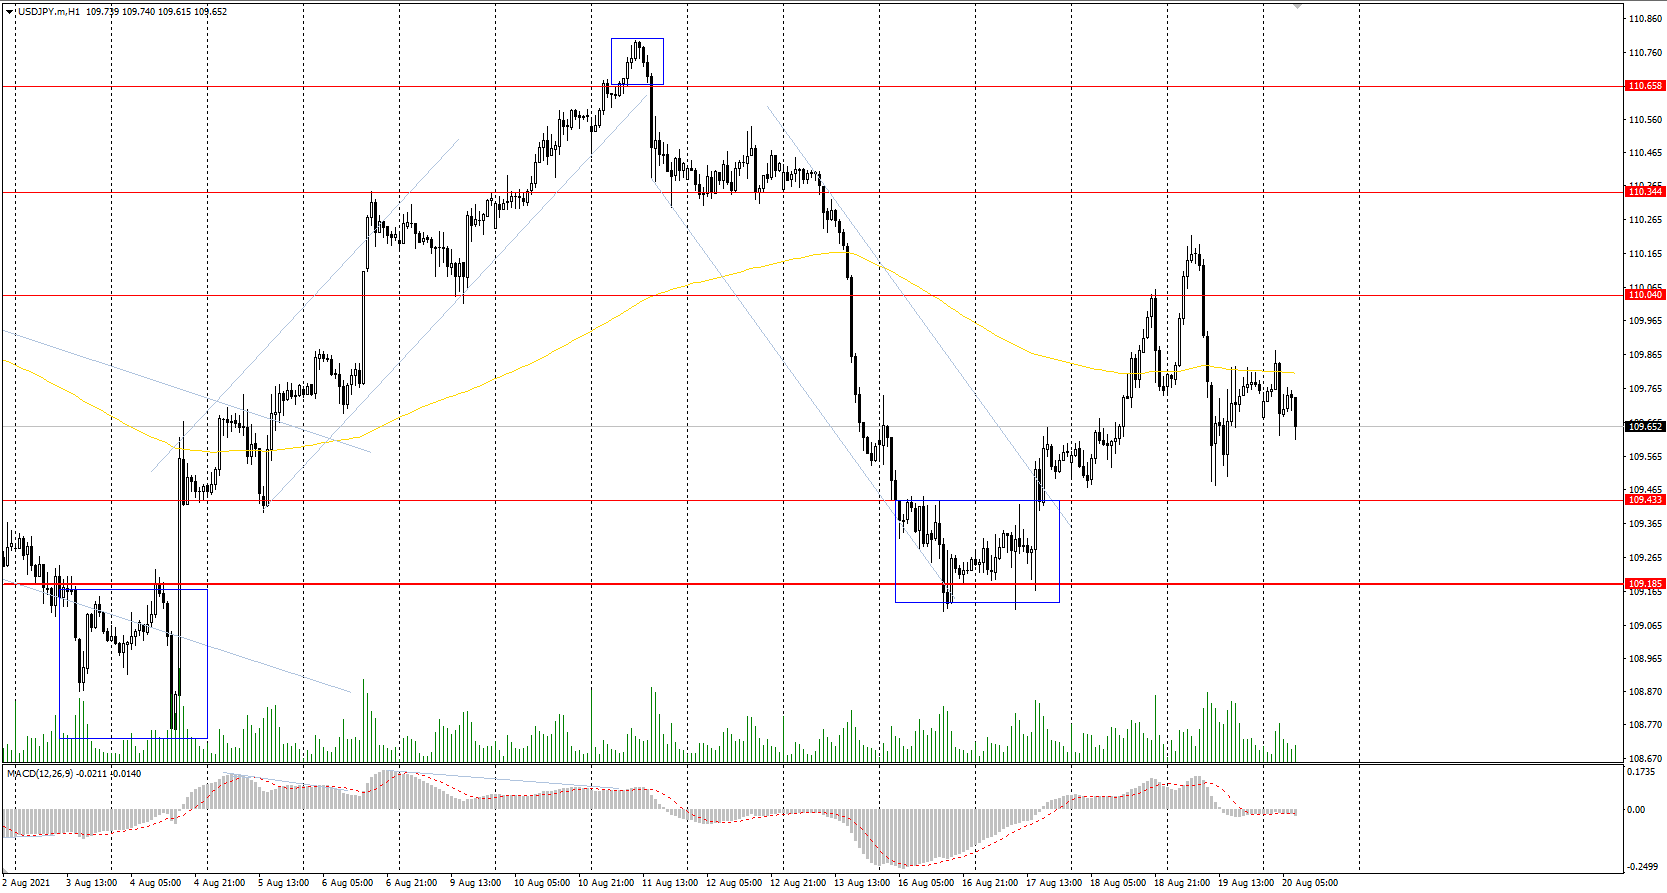
Support levels: 110.04, 109.43, 109.19, 108.65
Resistance levels: 110.34, 110.66, 110.95, 111.48
The main trend on the USD/JPY currency pair is bullish. But the price fell again under the moving average. The MACD indicator has become inactive. Under such market conditions, it is better to look for the buy positions from the support levels, where the buyers show initiative. Sell positions should be considered only on the lower timeframes from the resistance levels with short targets.
Alternative scenario: if the price falls below 109.18, the uptrend is likely to be broken.
News feed for 2021.08.20:
- Japan National Core Consumer Price Index (m/m) at 02:30 (GMT+3).
The USD/CAD currency pair
Technical indicators of the currency pair:
Prev Open: 1.2651
Prev Close: 1.2825
% chg. over the last day: +1.33%
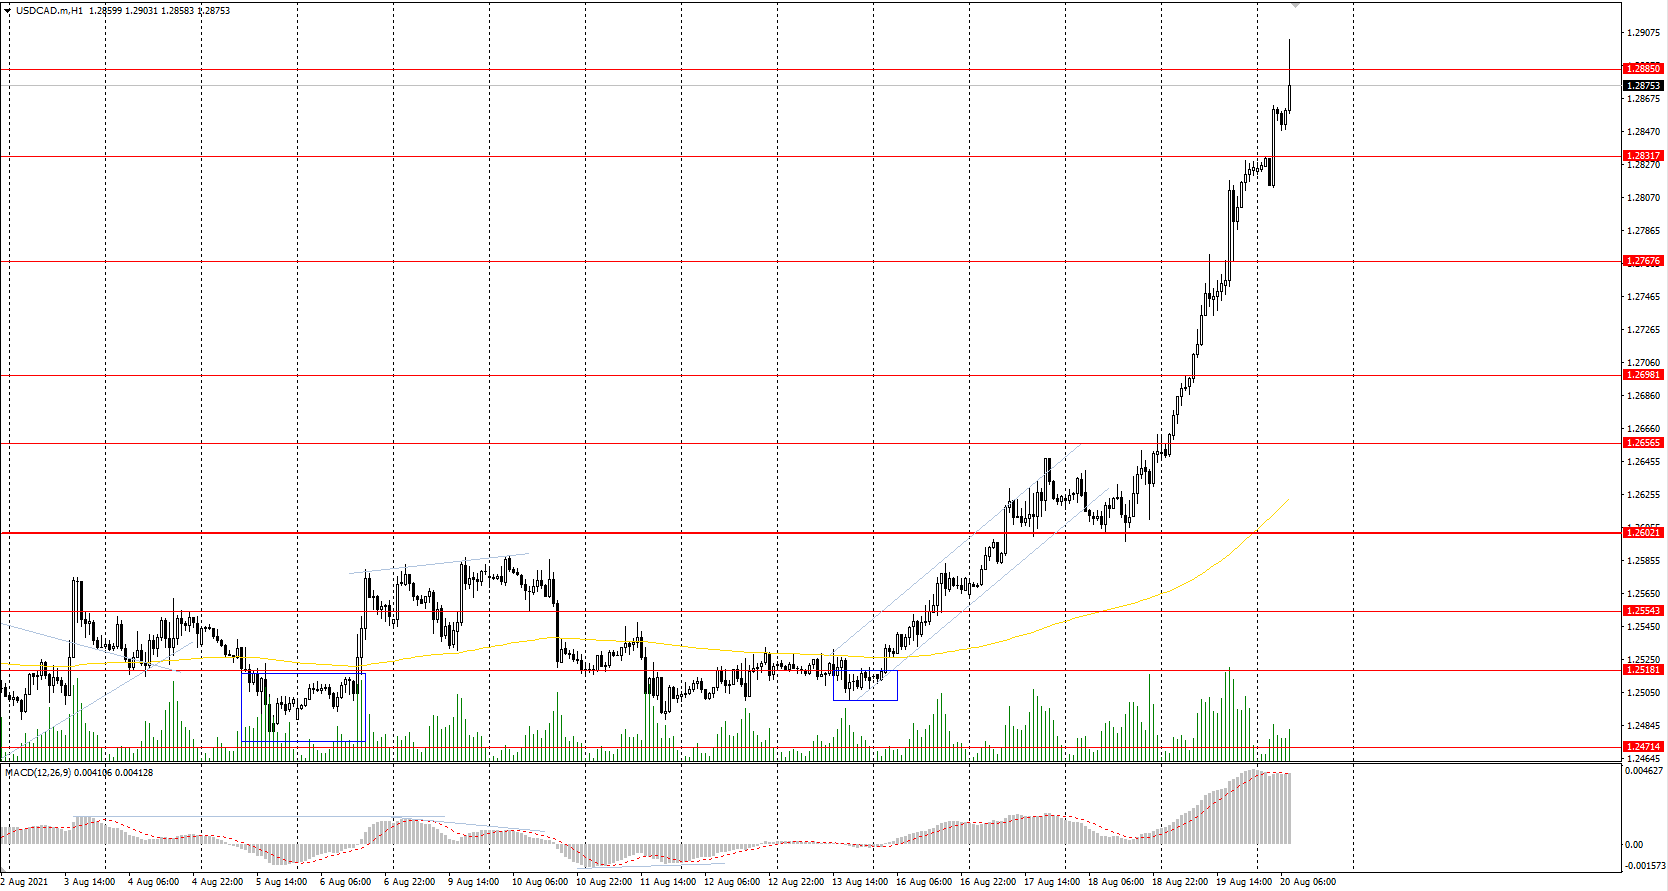
The USD/CAD currency pair is rising amid the strengthening of the dollar index and falling oil prices. The Canadian dollar is highly dependent on these two assets, especially on oil prices, since the CAD is a commodity currency.
Trading recommendations
Support levels: 1.2832, 1.2767, 1.2698, 1.2656
Resistance levels: 1.2885, 1.2951
In terms of technical analysis, the trend on the USD/CAD currency pair is bullish. The quotes have been growing for 5 trading sessions in a row. But now the price has deviated strongly from the moving average; the MACD indicator is in the overbought zone with signs of a hidden divergence. Under such market conditions, traders are better to look for sell positions from the resistance levels after sellers show the initiative. Buy positions should be considered from the support levels after a slight pullback below.
Alternative scenario: if the price breaks through the 1.2602 support level and fixes below, the uptrend is likely to be broken.
EUR/CHF Daily Outlook
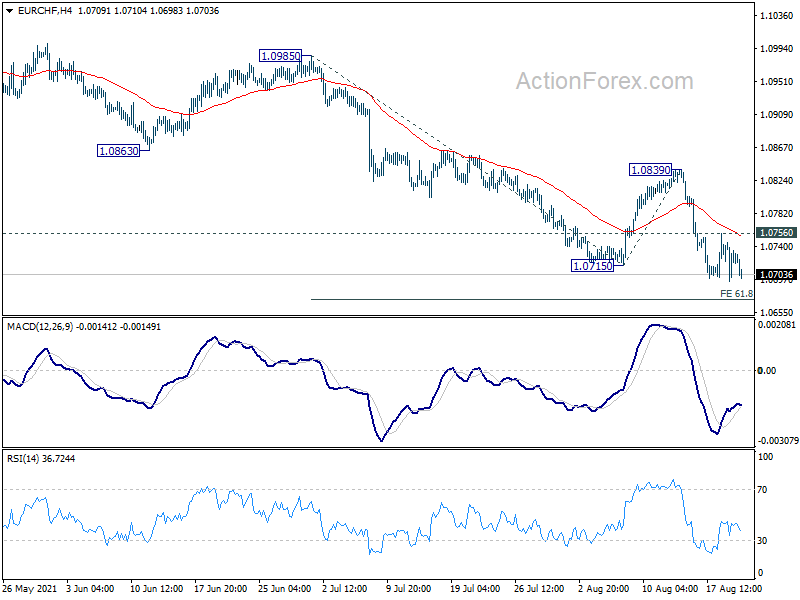
Daily Pivots: (S1) 1.0702; (P) 1.0724; (R1) 1.0751; More....
EUR/CHF's fall resumes after brief recovery and intraday bias is back on the upside. Current fall form 1.1149 should target 61.8% projection of 1.0985 to 1.0715 from 1.0839 at 1.0672 first. Break will target 100% projection at 1.0569 next. On the upside, above 1.0756 minor resistance will turn intraday bias neutral first. But outlook will remain bearish as long as 1.0839 resistance holds.
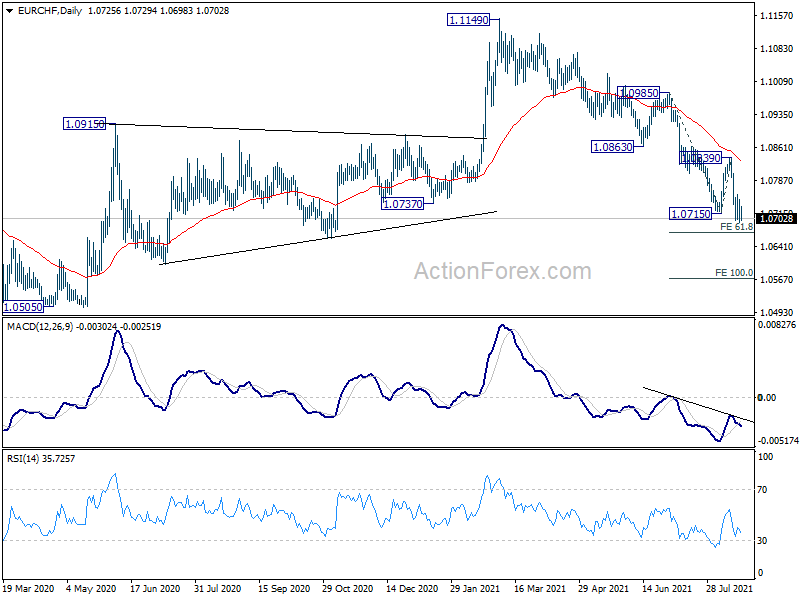
In the bigger picture, rebound from 1.0505 (2020 low) should have completed at 1.1149 already. The three-wave corrective structure argues that the downtrend from 1.2004 (2018 high) is not over yet. Medium term outlook will now stay bearish as long as 55 week EMA (now at 1.0865) holds. Break of 1.0505 low would be seen at a later stage.
AUD/USD Daily Report
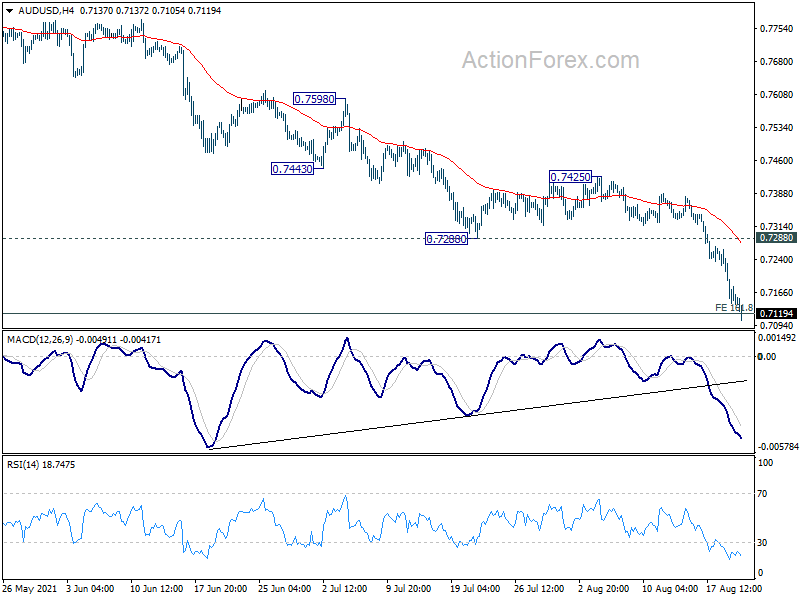
Daily Pivots: (S1) 0.7114; (P) 0.7178; (R1) 0.7214; More...
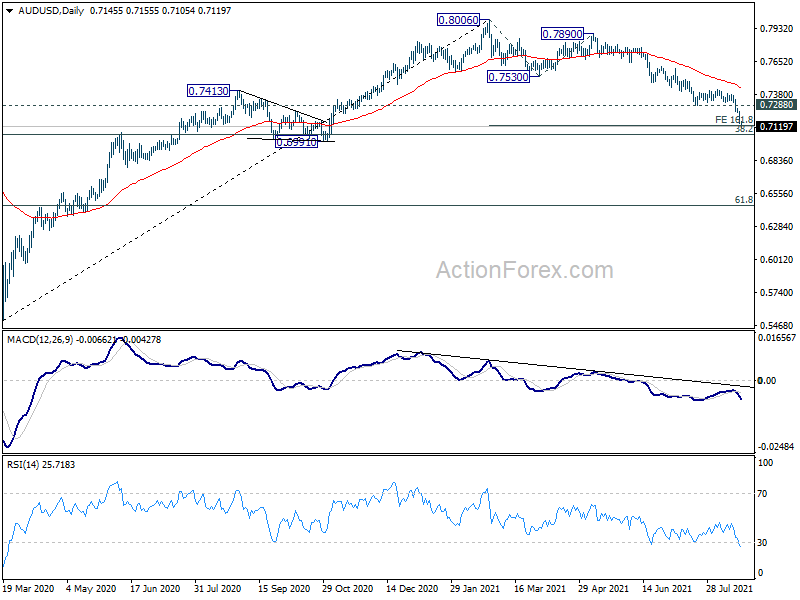
AUD/USD drops to as low as 0.7105 so far today and met 161.8% projection of 0.8006 to 0.7530 from 0.7890 at 0.7120 already. There is no sign of bottoming yet and further fall is expected. But we'd look for strong support from 0.6991/7051 cluster support to bring rebound. On the upside break of 0.7288 support turned resistance will indicate short term bottoming, and turn bias back to the upside for stronger rebound.
In the bigger picture, rise from 0.5506 medium term bottom could have completed at 0.8006, after failing 0.8135 key resistance. Correction from there could target 0.6991 cluster support (38.2% retracement of 0.5506 to 0.8006 at 0.7051). We'd look for strong support from there to bring rebound. However, sustained break of this level would argue that the whole medium term trend has indeed reversed.
USDCAD Prints Positive Move To New 8-Month High
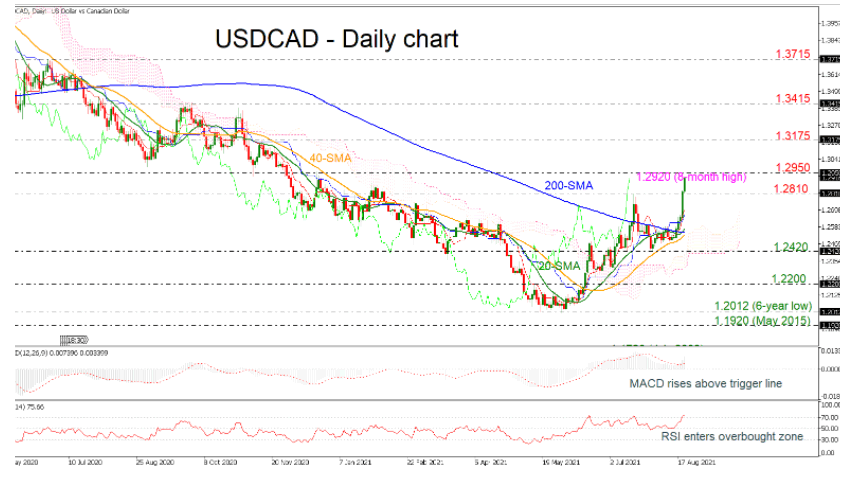
USDCAD posted an aggressive rally on Thursday, jumping above the 1.2810 barrier and printing a new eight-month high of 1.2920.
The MACD oscillator is going up above its trigger line, while the RSI is moving into overbought territory. The Ichimoku lines are rising higher, and so are the 20- and 40-day simple moving averages (SMAs), of which the former has crossed to the upside of the 200-day SMA.
Taking the previous high as a reference point, a subsequent push up might take the price as far as 1.2950. The 1.3175 mark, if overcome, might put a halt to bullish moves ahead of the 1.3415 barrier.
Alternatively, a decline below the SMAs might lead to a test of the 1.2420 support before falling to the 1.2200 area. There is a chance that more losses might push the bears down to 1.2012, which is the six-year low.
Overall, USDCAD is rising steadily, marking the sixth straight day of gains following the comeback from the 1.2012 support level. The short-term forecast is optimistic, while the medium-term outlook is neutral.
USD/CAD Daily Outlook
Daily Pivots: (S1) 1.2709; (P) 1.2770; (R1) 1.2890; More...
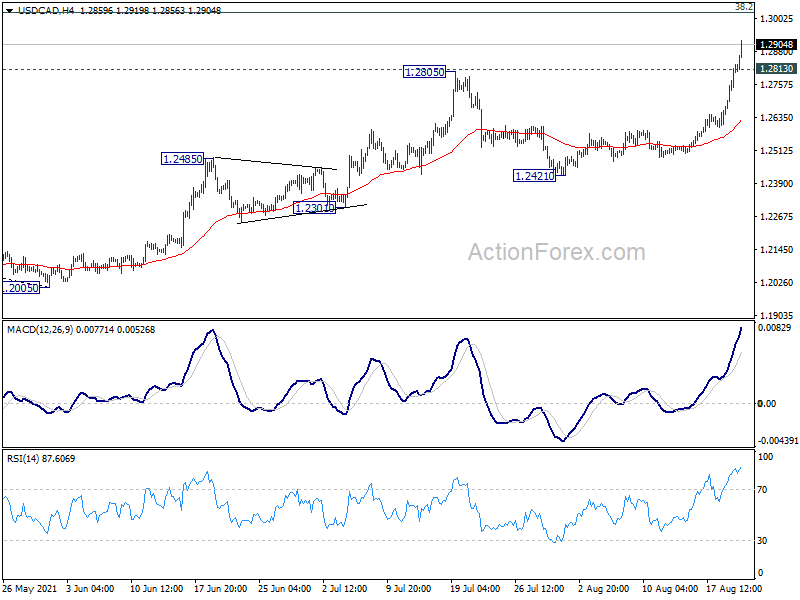
USD/CAD's rise from 1.2005 resumed by taking out 1.2805 resistance and hit as high as 1.2919 so far. Intraday bias stays on the upside for 1.3022 fibonacci level next. On the downside, below 1.2813 minor support will turn intraday bias neutral and bring consolidations first, before staging another rally.
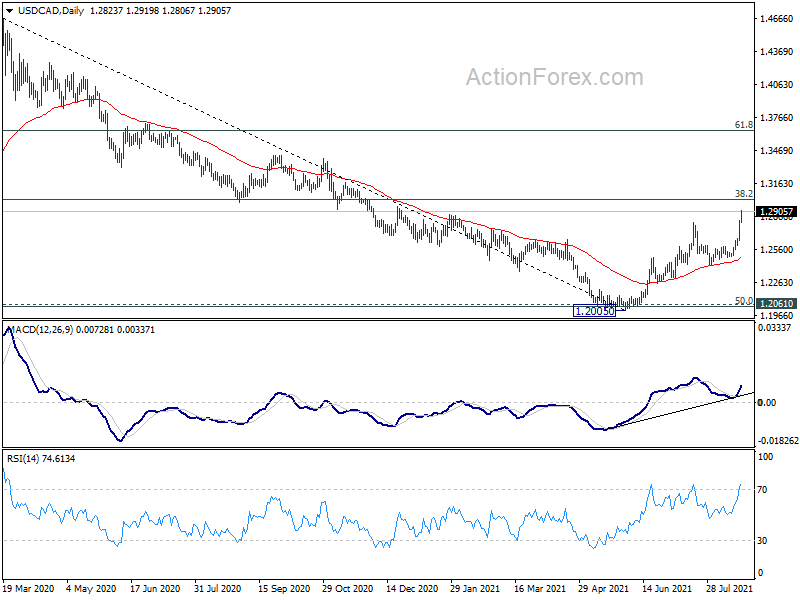
In the bigger picture, fall from 1.4667 is seen as the third leg of the corrective pattern from 1.4689 (2016 high). It should have completed after hitting 1.2061 (2017 low) and 50% retracement of 0.9406 to 1.4689 at 1.2048. Sustained break of 38.2% retracement of 1.4667 to 1.2005 at 1.3022 will pave the way to 61.8% retracement at 1.3650 and above. Overall, medium term outlook remains neutral at worst with 1.2048/61 support zone intact.
Daily Tecnical Analysis
EUR/USD
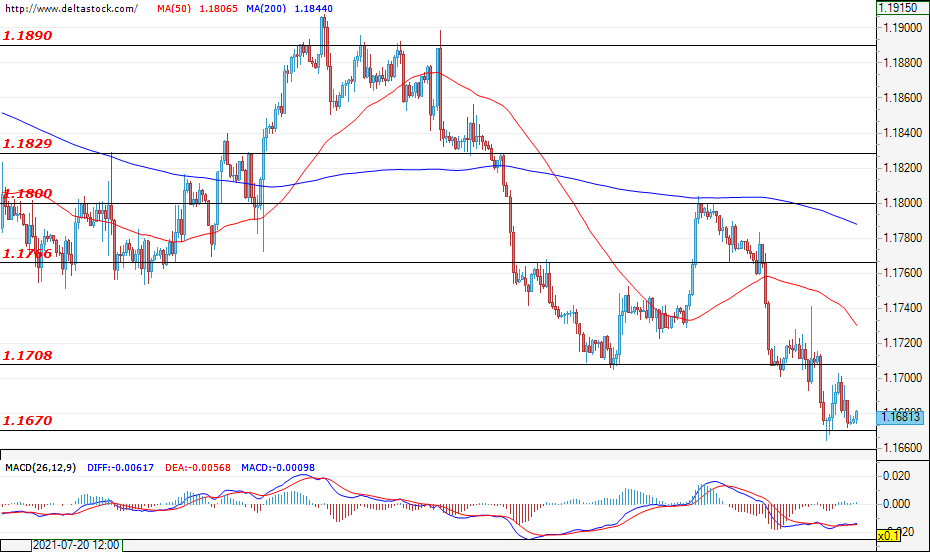
Current level - 1.1685
The downward movement of the currency pair was limited by the support zone at 1.1670 after two unsuccessful tests of this level. The forecasts are for the downtrend to continue and for the pair to head towards a test of the psychological level at 1.1600. However, only a breach of the support at 1.1670 would pave the way for the EUR/USD towards this zone. On the other hand, before a possible attack from the bears is to commence, it is possible for the pair to make a corrective move and test the resistance at 1.1708 and the trading activity in the range of 1.1670 - 1.1708. If the resistance level at 1.1708 is breached, the corrective movement may deepen, which could head the EUR/USD towards the next resistance at 1.1766. Today, no important economic news is going to be announced, thus a moderate volatility is expected, which may hold the pair in the aforementioned range.
| Resistance | Support | ||
| intraday | intraweek | intraday | intraweek |
| 1.1708 | 1.1800 | 1.1670 | 1.1600 |
| 1.1766 | 1.1830 | 1.1600 | 1.1400 |
USD/JPY
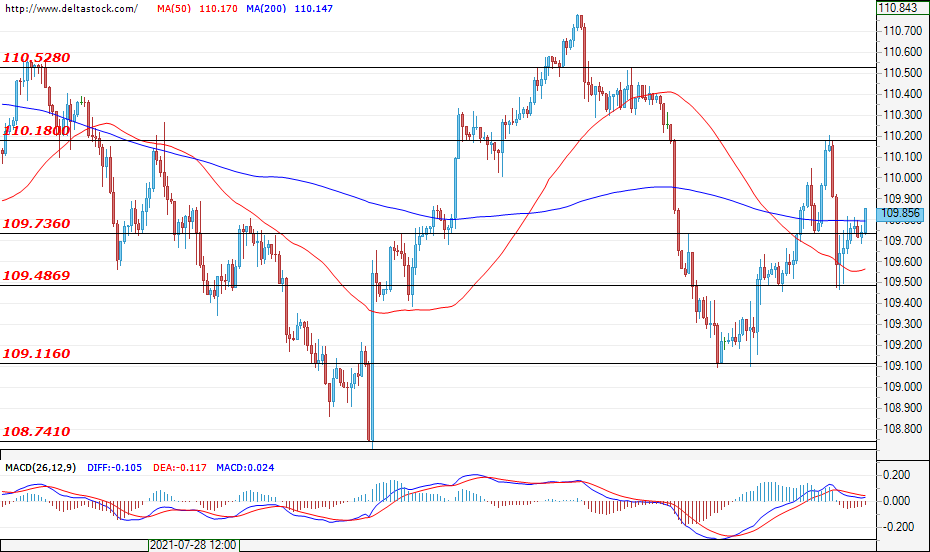
Current level - 109.85
The currency pair continued to rise yesterday, and the dollar gained more momentum after the final interest rate decision from the Fed minutes became clear. The bulls are likely to again attack the resistance zone between 110.30 and 110.52. This area turns out to be quite a difficult obstacle for the buyers, but if a breach here is successful, prices can rise to 111.65 and even 113.50. The first daily support for the bulls is 109.73, and the main one remains the area at around 109.22.
| Resistance | Support | ||
| intraday | intraweek | intraday | intraweek |
| 110.18 | 110.52 | 109.73 | 109.11 |
| 110.52 | 111.00 | 109.48 | 108.74 |
GBP/USD
Current level - 1.3631
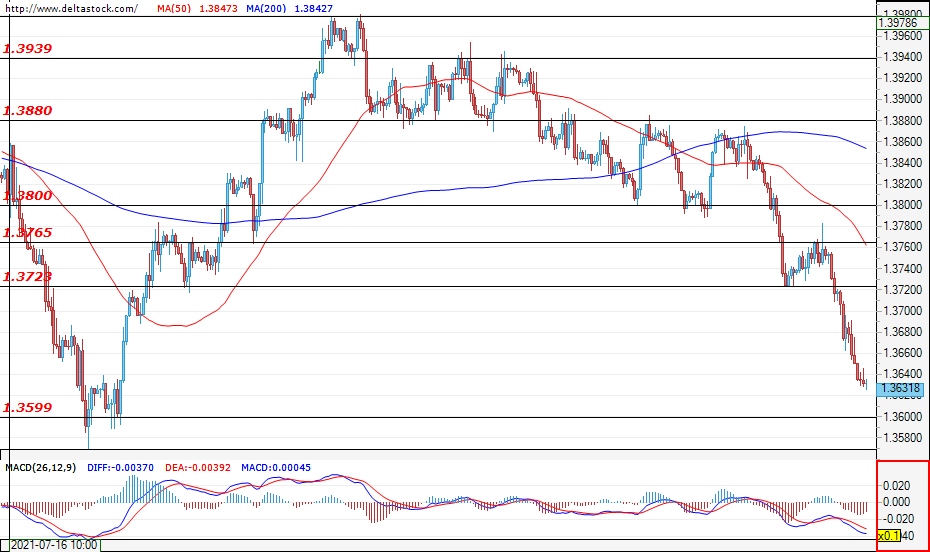
The sell-off from the past few days has gained momentum as the pound continues to lose ground against the U.S. dollar from the beginning of today's trading session. The breach of the 1.3723 support zone strengthened the bearish sentiment and the most probable scenario for today is for an attack on the support at 1.3600. A successful breach of the mentioned level could pave the way towards the first support zone from the higher time frames at around 1.3500.
| Resistance | Support | ||
| intraday | intraweek | intraday | intraweek |
| 1.3723 | 1.3800 | 1.3600 | 1.3508 |
| 1.3765 | 1.3880 | 1.3567 | 1.3508 |