

Sample Category Title
AUD/USD: Aussie Extends Steep Fall to the Lowest in Nine Months
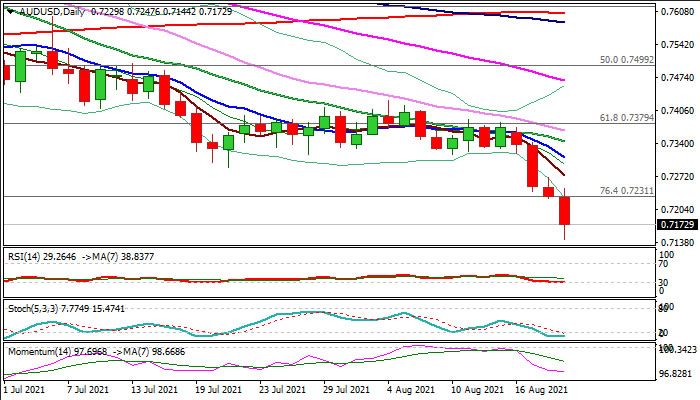
The Australian dollar extends weakness into fourth straight day and fell to the lowest levels since early November 2020 on Thursday.
Weaker equities on risk aversion and steep fall in iron ore prices weighed on risk-sensitive Aussie dollar, along with stronger US dollar and negative impact on Australian labor sector from the latest lockdown. Although unemployment rate in Australia dropped below expectations in July, overall data remain mixed and not able to counter strong negative sentiment, additionally soured by post-Fed stocks selloff.
Today’s break of pivotal support at 0.7231 (200WMA) generated bearish signal which looks for confirmation on daily close below this level to open way for test of key levels at 0.7000 zone (psychological / Sep/Nov 2020 higher base).
Oversold daily RSI and stochastic suggest that bears may take a breather before final push towards 0.7000 zone, with extended upticks expected to stay capped under falling 10 DMA (0.7310) to keep bears intact.
Res: 0.7231; 0.7289; 0.7310; 0.7342
Sup: 0.7136; 0.7100; 0.7056; 0.7000
US 100 Index Slides, But Uptrend Still in Play
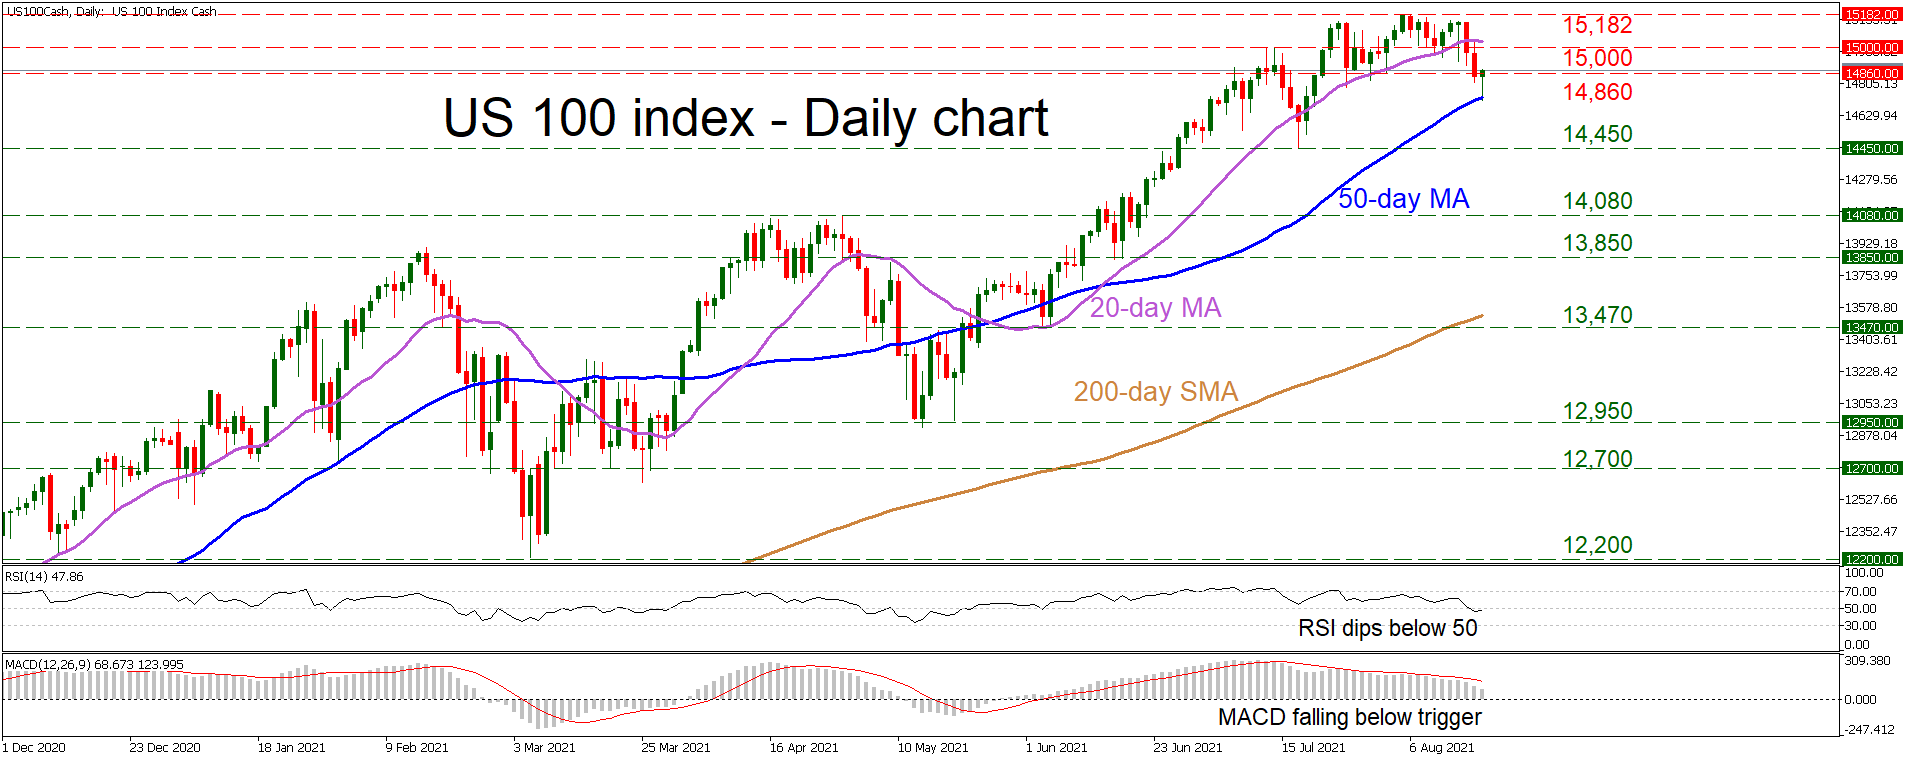
The US 100 index (Cash) took some fire in recent sessions, sliding from the record high of 15,182 before encountering some support near the 50-day moving average (MA) currently at 14,720 and subsequently rebounding a little. The decline in the market has been swift, but not enough to threaten the bigger uptrend.
Short-term oscillators detect negative momentum, reflecting the latest decline in the price. The RSI has dropped below 50 and is pointing lower, and while the MACD is still positive, it is falling below its red trigger line.
If the bears stay in control and manage to pierce below the 50-day MA, their next target will likely be the 14,450 zone, which halted the selloff last month. Deeper declines would raise questions about the longevity of the positive trend, turning the focus towards the 14,080 region next.
Now if buyers come back into play, the first battle would be getting back above the 14,860 level. If they succeed, they will then have to overcome the psychological number of 15,000 before gearing up for another test of the all-time peak of 15,182.
In short, the overall uptrend is intact despite the latest pullback. For that to change, the sellers would need to slice through 14,450 first.
Sunset Market Commentary
Markets
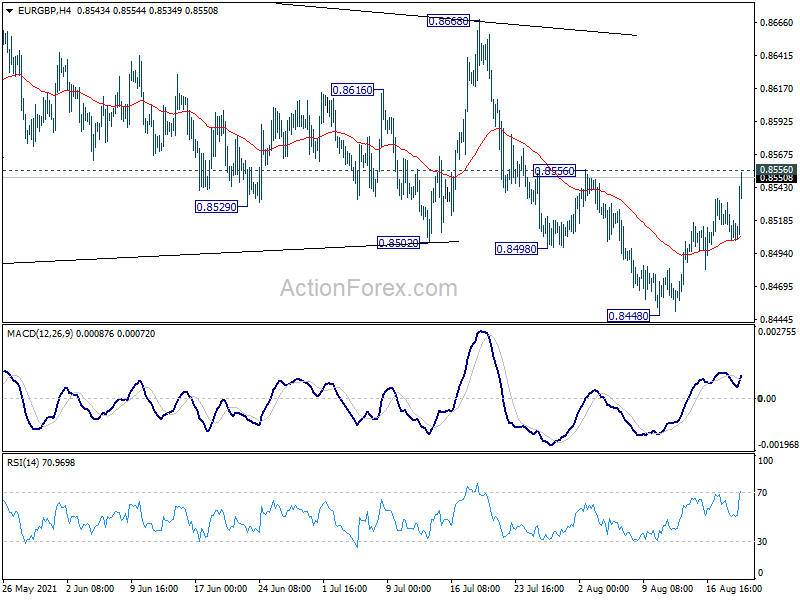
Today’s economic calendar was apart from slightly better-than-expected jobless claims basically empty, giving the opportunity for the post-minutes market reaction to unfold “in peace”. The prospect of a less generous monetary policy stance obviously dents equity sentiment in the first place. Concerns about the virus spreading and economies of China and the likes slowing only reinforces the selloff in stocks as well as in other risky assets. European equities slipped more than 2% at some point but are now off intraday lows. The EuroStoxx50 nevertheless tumbles below first support of 4164. Wall Street opens with losses of half a percent. Things on commodity markets look pretty ugly too. Brent oil tanks 2-3% to the mid $66 area while copper and iron crater 2.5% and 5% respectively. The latter is also haunted by China’s pursuit to curb carbon emissions where steel production takes centre stage. On core bond/UST markets, the risk-off context still outweighs the idea of the Fed tapering bond purchases probably from Q4 onwards. US yields decline 1bp (5y) to 1.7 bps (30y). The yield dynamics make sense though, with real yields (10y) advancing 1.7 bps and inflation expectations easing some 2.5 bps. German yields fell in a kneejerk move in early European trading but recovered as the session evolved. Losses are limited both in size and across the curve. The US dollar held an overall advantage during Asian dealings, even against other safe haven currencies including the Japanese yen and Swiss Franc. That changed a bit later. USD/JPY for example retreated from an intraday high at 110.20 to 109.76 currently (virtually unchanged vs yesterday’s close). Even EUR/USD won’t go down without a fight. The currency pair slipped below the 1.17 support to a daily low of 1.1666 before recouping most of the losses. The jury is still out on whether to call the break lower “sustained”. Commodity currencies for obvious reasons are under heavy selling pressure today. CAD, AUD, NZD and NOK all lose a little less than 1% against the USD. CE currencies with the exception of the zloty are remarkably resilient. EUR/CZK and EUR/HUF trade marginally higher at 25.5 and 351 respectively. EUR/PLN jumps from 4.55 to 4.58 as local political turmoil weighs on the Polish currency. Finishing with sterling, EUR/GBP extends gains to 0.855 currently. A minor technical acceleration kicked in after clearing intermediate resistance around 0.853.
News Headlines
The Norwegian central bank kept its policy rate unchanged at 0%. Governor Olsen confirmed that given the current assessment of the outlook and the balance of risks, the policy rate will most likely be raised in September. It would be the start of a tightening cycle followed by quarterly hikes in 2021 (based on June monetary policy report). Today’s intermediate meeting served to check whether projections towards the start of the normalization cycle were still on point and they are. Keeping this week’s RBNZ experience in mind, the Norges Bank (NB) did add a Covid(-variant) disclaimer. However, contrary to New Zealand, Norway has a high vaccination rate which reduces the need for restrictions. The Norwegian krone didn’t respond to the expected outcome of the policy meeting though did weaken significantly today because of sliding oil prices and risk aversion. EUR/NOK trades north of 10.50 at the highest level since mid-July.
In further evidence of US labour market strength, weekly jobless claims last week unexpectedly fell from 377k to 348k, the lowest level since March last year. Continuing claims declined from an upwardly revised 2899k to 2820k, also a cycle low. August Philly Fed Business Outlook disappointed by sliding from 21.9 to 19.4. The setback is smaller than for example the Empire Manufacturing survey, but the Philly Fed gauge didn’t stand at multiyear highs. Details showed especially difficulties in shipments. New orders, employment and the workweek all increased. Prices paid and received are back on the rise after a July deceleration. The forward looking assessment was bleaker with worries over Covid and price pressure weighing down sentiment.
USD/JPY Mid-Day Outlook
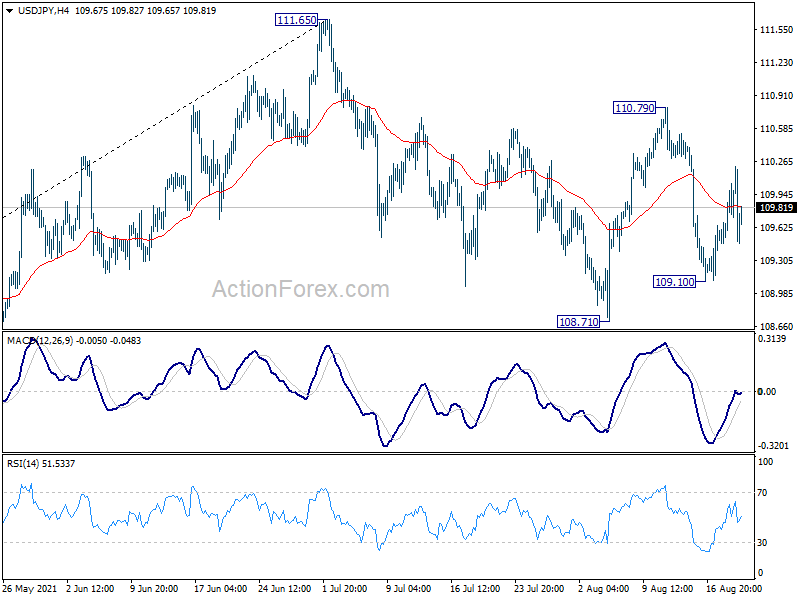
Daily Pivots: (S1) 109.48; (P) 109.77; (R1) 110.07; More...
Outlook in USD/JPY remains unchanged and intraday bias stays neutral at this point. On the upside, break of 110.79 will resume the rebound form 108.71 to retest 111.65 high. On the downside, break of 109.10 will target 108.71 support first. Firm break there will resume the decline from 111.65 and target 38.2% retracement of 102.58 to 111.65 at 108.18 next.
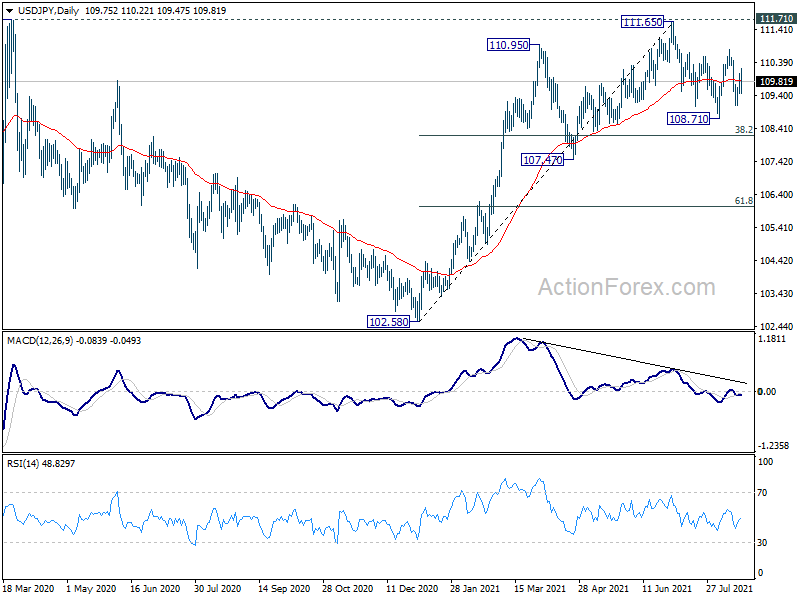
In the bigger picture, medium term outlook is staying neutral with 111.71 resistance intact. The pattern from 101.18 could still extend with another falling leg. Sustained trading below 55 day EMA will bring deeper fall to 107.47 support and below. Nevertheless, strong break of 111.71 resistance will confirm completion of the corrective decline from 118.65 (2016 high). Further rise should then be seen to 114.54 and then 118.65 resistance.
USD/CHF Mid-Day Outlook
Daily Pivots: (S1) 0.9131; (P) 0.9164; (R1) 0.9201; More....
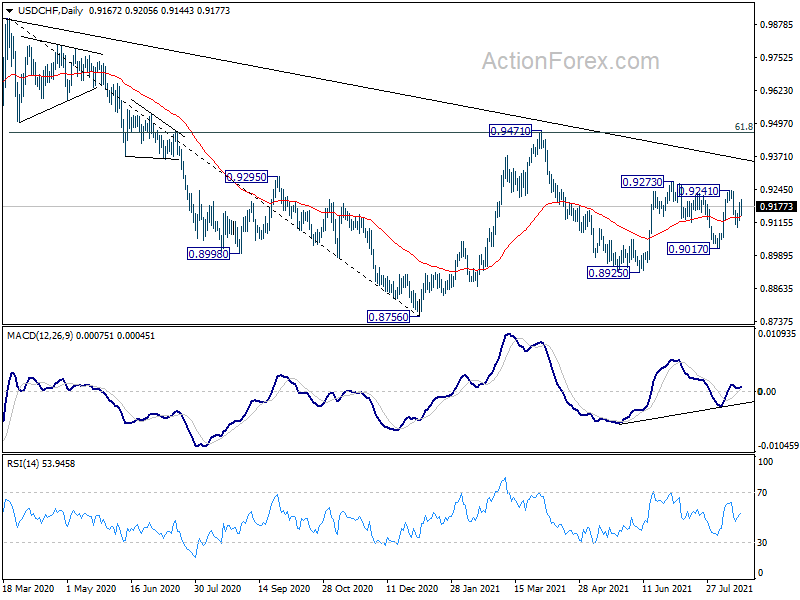
Outlook in USD/CHF is unchanged and intraday bias remains neutral first. On the upside, break of 0.9241 resistance should resume the rise from 0.8925 through 0.9273. On the downside, break of 0.9098 will target 0.9017 support first. Further break there will likely resume the decline from 0.9471 through 0.8925 low.
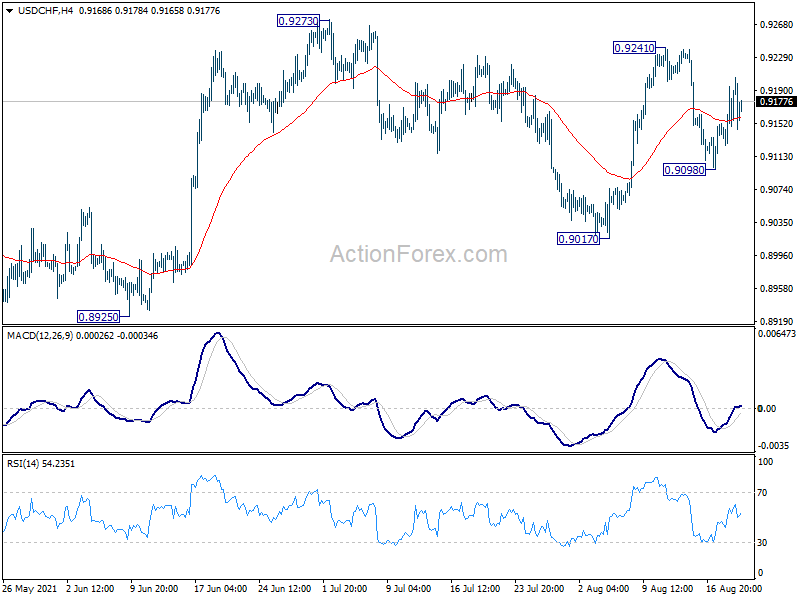
In the bigger picture, the failure to sustain above 55 week EMA (now at 0.9184) retains medium term bearish in USD/CHF. Break of 0.8925 support should resume the whole decline form 1.0342 (2016 high) through 0.8756 low. However, break of 0.9273 resistance and sustained trading above 55 week EMA will be an early sign of bullish trend reversal. Focus will then turn to 0.9471 resistance for confirmation.
EUR/USD Mid-Day Outlook
Daily Pivots: (S1) 1.1689; (P) 1.1716; (R1) 1.1737; More...
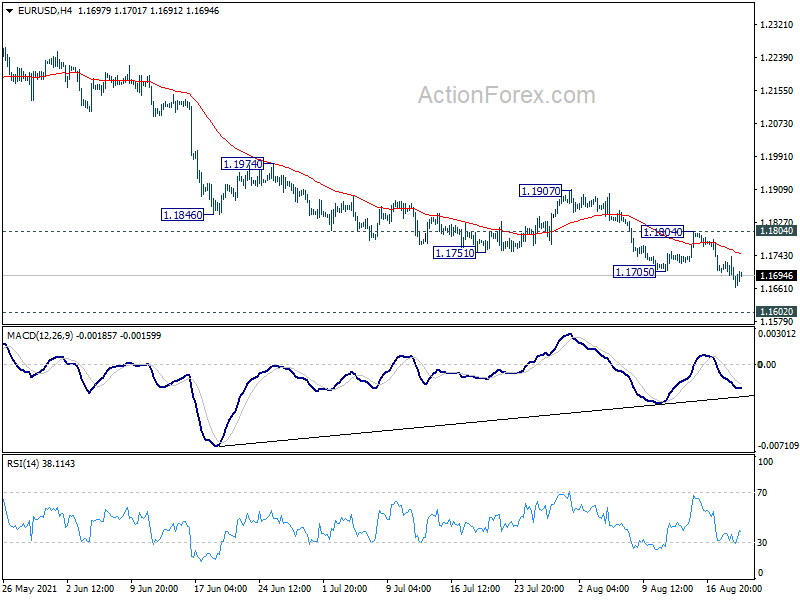
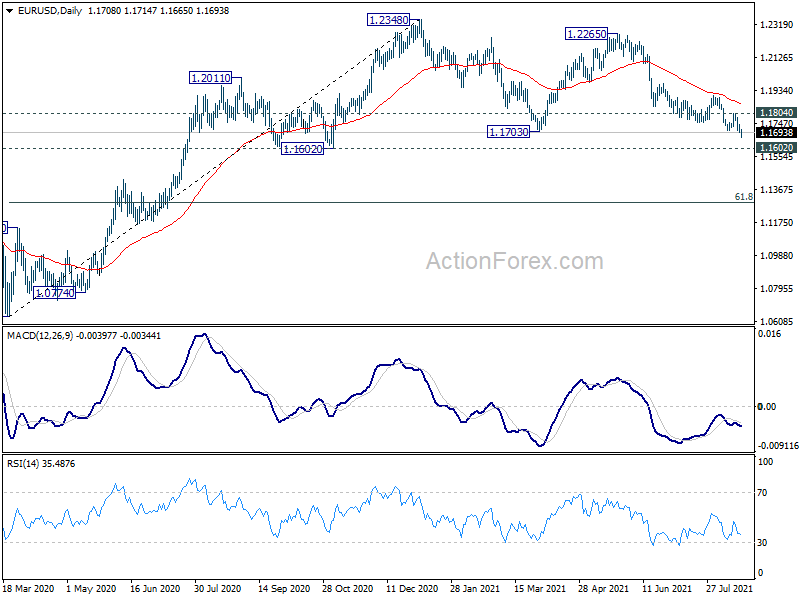
Intraday bias in EUR/USD remains on the downside for further decline. We'd continue to look for strong support from 1.1602/1703 support zone to bring rebound. On the upside, above 1.1804 resistance will turn bias back to the upside for 1.1907 resistance first. However, sustained break of 1.1602/1703 will carry larger bearish implication and pave the way to 1.1289 fibonacci support.
In the bigger picture, rise from 1.0635 is seen as the third leg of the pattern from 1.0339 (2017 low). Further rally remains in favors long as 1.1602 support holds, to cluster resistance at 1.2555 next, (38.2% retracement of 1.6039 to 1.0339 at 1.2516). Reaction from 1.2555 should reveal underlying long term momentum in the pair. However sustained break of 1.1602 will argue that the rise from 1.0635 is over, and turn medium term outlook bearish again. Deeper fall would be seen to 61.8% retracement of 1.0635 to 1.2348 at 1.1289 and below.
Jittery Markets Post-Fed
It's been a very strange start to trading on Thursday, with stock markets suffering heavy losses as the rotation into safety gathers significant pace following the release of the Fed minutes.
It's easy to point to the Fed minutes as the cause of the sell-off but what did we actually learn from the minutes that we didn't already know? In fact, we've heard from a lot of policy makers from across the spectrum since and they've arguably become more hawkish on the timing of tapering, thanks in large part to July's knockout jobs report.
So is this really a mini-taper tantrum, of sorts, or a combination of factors at a time when stocks have been trading around record highs and we're in wait-and-see mode ahead of next weeks Jackson Hole event? This isn't the busiest period of the year and maybe investors are seizing the opportunity to lock in some profits and wait for another dip.
It does seem that the case for caution is growing, whether that be the uncertainty around the timing and pace of the taper or the rising number of delta cases around the world. The findings from the Oxford study overnight showing a drop in the effectiveness of the vaccine 90 days after the second dose won't alleviate delta concerns as it spreads rapidly across numerous countries.
Various surveys recently have shown that, despite high vaccine rollouts in many countries, consumers and businesses are concerned about the impact that delta - or any other new variants - will have in the coming months. As we move into Autumn and Winter, people will spend more time indoors and with restrictions having been removed or reduced in many countries, the effectiveness of the vaccines will be put to the test.
US futures are currently experiencing far more modest losses compared to their European counterparts although that may change as we get closer to the open on Wall Street. Jobless claims and the Philly Fed manufacturing index releases had minimal impact, with claims slightly beating expectations and the survey coming off a little worse. Although this is in line with what we're seeing from the surveys at the moment, given the delta uncertainty.
Oil plunges to three month lows in risk averse trade
Oil prices are among those risk assets suffering heavy losses today, with Brent and WTI off more than 3% and at their lowest levels in three months. The sell-off in oil was already well underway, with the spread of Covid in China - and elsewhere - and restrictions that have come with it largely behind the reversal in fortune.
WTI is now 17% off its highs and with $65 having fallen in the process, worse days may lie ahead. Further support may now lie around $60 in WTI and $64 in Brent but it could get worse if the Covid situation continues to deteriorate.
Of course, that may depend on OPEC+ and whether recent developments encourage the producers to pare back their taper ambitions in anticipation of lower demand. That seems unlikely in the near-term given that oil prices remain at decent levels, despite the drop.
Gold assumes safe haven role
Gold's role as a safe haven is looking fairly secure this morning, following the sell-off in risk assets across the board. While flat now on the day, it's almost 1% off its lows on the back of the stock market dip today. Gold initially came under pressure in the aftermath of the Fed minutes when we saw the dollar rally, following an initial dip.
This perceived hawkishness weighed on gold and saw it pull further back from $1,800 where it had previously run into resistance. While an assault on this level hasn't since been forthcoming, the yellow metal isn't trading far off these levels once more and further risk aversion once the US joins could see a charge unfold.
A move above here would be quite the psychological victory, with further resistance then coming around $1,830. A move above here and things could start to look very promising for gold.
Bitcoin poised for larger correction?
Bitcoin has been described as everything from a risk asset to gold 2.0, an inflation hedge, a deflation hedge and who knows what else. So trying to link its moves to what's happening elsewhere today is basically pointless.
Being someone that simply views it as a highly speculative asset at this stage, I'd probably align myself more with the risk asset crowd but even then, it so often moves independently to the rest of the market, even this should be considered a loose link.
Bitcoin has been pulling back a little in recent sessions after taking another run towards $50,000 before falling a little short. It appears to have entered into a bit of a corrective phase which could see it pull back towards its late May/early June highs if it breaks below last Wednesday's low where it is currently seeing some support.
Aussie Slides on Covid, Risk Aversion
It has been another rough day for the Australian dollar. AUD/USD is currently trading at 0.7164, down 0.87% on the day. The pair has plunged 2.7% this week, with the US dollar thoroughly routing its Australian counterpart. Unless the Australian dollar makes a sharp rebound, this will be one of the currency’s worst weekly performances in 2021. With the Aussie falling out of favor, the currency could fall to 0.7000 as early as next week.
The Covid outbreak is worsening in Australia, even with lockdowns in place. The state of New South Wales set a new daily record of 681 cases, and with no approved vaccine for children, health experts are worried that the delta variant could continue to spread. Add to the Covid woes the general backdrop of risk aversion across the globe, and you have a recipe for the US dollar making broad gains against most of the major currencies.
Australian employment numbers were stronger than expected, but that still wasn’t enough to stem the Aussie’s slide. Australia added 2,200 jobs in July, compared to the forecast of a loss of 42.5 thousand. The unemployment rate fell sharply to 4.6% versus 5.0% expected, down from 4.9%. The data was all the more impressive, given the scale of lockdowns across the country.
The FOMC minutes signalled that the Fed plans to scale back its monthly bond purchases, likely before the end of the year. However, the minutes indicated that any taper was not linked to a rate hike increase. Members noted that the inflation goal had been reached, making tapering possible, but that employment had not met the Fed’s benchmark of “substantial further progress”, and there would be no rate hike until this goal was achieved. The Fed has repeatedly stated that rate hikes are unlikely before tapering is completely wound up, but felt the need to emphasize this point in the minutes. Investors viewed the minutes as hawkish, allowing the US dollar to extend its gains.
AUD/USD Technical
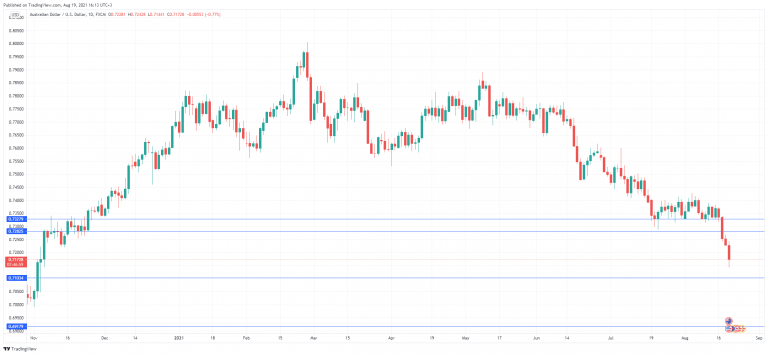
- AUD continues to break through support levels. The next support line is at 0.7103, followed by 0.6916
- There is resistance at 0.7285, followed by resistance at 0.7385
Dollar, Yen and Franc in Three-Horse Race as Risk Aversion Intensifies
Selloff in commodity currencies intensifies today as risk sentiment turn sour again. Major European indexes are all in deep red while US futures point to lower open. Yen, Swiss Franc and Dollar are taking turns to be the strongest one in a three-horse race. Aussie is so far the worst performing, followed by Loonie and Kiwi. But there is not much difference between the three. Euro and Sterling are mixed for now, stuck in the middle. WTI crude oil also dives below 64k handle, but Gold is resilient at around 1780.
Technically, we'll pay attention to development in EUR/GBP for the rest of the session. Firm break of 0.8556 support will suggest that fall form 0.8668 is over, and bring retest of this resistance. That could also be a prelude to larger bullish reversal. If that happens we'd also likely see GBP/USD drops further to 1.3570 support GBP/JPY would also follow and drop to 148.43 support. There are where the key support level for the Pound to defend.
In Europe, at the time of writing, FTSE is down -1.94%. DAX is down -1.96%. CAC is down -2.65%. Germany 10-year yield is down -0.002 at -0.481. Earlier in Asia, Nikkei dropped -1.10%. Hong Kong HSI dropped -2.13%. China Shanghai SSE dropped -0.57%. Singapore Strait Times dropped -1.42%. Japan 10-year JGB yield dropped -0.0003 to 0.017.
US initial jobless claims dropped to 348k, continuing claims at 2.82m
US initial jobless claims dropped -29k to 348k in the week ending August 14, better than expectation of 362k. That's also the lowest level since March 14, 2020. Four-week moving average of initial claims dropped -19k to 378k, lowest since March 14, 2020 too.
Continuing claims dropped -79k to 2820 in the week ending August 7, lowest since march 14, 2020. Four-week moving average of continuing claims dropped -111k to 2999k, lowest since March 21, 2020.
Philly Fed manufacturing dropped to 19.4, but remained elevated
In the August Philadelphia Fed Manufacturing Business Outlook Survey diffusion index for currency activity dropped to 19.4 in August, down from 21.9, below expectation of 24.3. It's also the fourth consecutive decline. 28% of the firms reported increases in current activity while 9% reported decreases.
Philadelphia Fed said: "Responses to the August Manufacturing Business Outlook Survey suggest continued expansion for the region's manufacturing sector. The indicators for current activity and shipments decreased from last month but remained elevated. Additionally, the firms reported increases in new orders and employment. The survey's future indexes moderated this month but continue to suggest expected growth over the next six months."
ECB Lane explains three conditions for rate hike
ECB Chief Economist Philip Lane explained a a blog post the three key conditions for lifting interest rates, as reflected in the latest forward guidance.
The first condition "until we see inflation reaching two per cent well ahead of the end of our projection horizon" provides reassurance that the convergence of inflation towards the new target should be sufficiently advanced and mature at the time of policy rate lift off. It helps to "hedge monetary policy against the risk of reacting to forecast errors".
The second condition expects inflation to stay at 2% "durably for the rest of the projection horizon". It "telegraphs that reaching the inflation target should be lasting."
The third condition "progress in underlying inflation is sufficiently advanced to be consistent with inflation stabilising at two per cent over the medium term" signals that policy rates should not be lifted unless underlying inflation is also judged to have made satisfactory progress towards the target.
Lane further explained that "underlying inflation" is a broad concept and refers to the persistent component of inflation that filters out short-lived, reversible movements in the inflation rate and provides the best guide to the medium-term inflation developments
Also, the sentence that the forward guidance "may also imply a transitory period in which inflation is moderately above target" makes explicit that rate forward guidance that is committed to avoiding premature tightening.
Released in European session, Swiss trade surplus narrowed slightly to CHF 5.25B in July, above expectation of EUR 4.78B. Eurozone current account surplus rose to EUR 21.8B in Jun, above expectation of 12.3B.
Australia unemployment rate dropped to 4.6%, people falling out of the labour force
Australia employment grew 2.2k in July, better than expectation of -45.0k contraction. Full-time jobs dropped -4.2k while part-time jobs rose 6.4k. Unemployment rate dropped -0.3% to 4.6%, which was already -0.6% lower than than 5.1% level at the start of the pandemic in March 2020. However, participation rate dropped by -0.2% to 66.0% at the same time.
Bjorn Jarvis, head of labour statistics at the ABS, said: "Early in the pandemic we saw large falls in participation, which we have again seen in recent lockdowns. Beyond people losing their jobs, we have also seen unemployed people drop out of the labour force,"
"In Victoria, we saw unemployment fall by 19,000 people in July 2020, during the second wave lockdown, and by 13,000 in the June 2021 lockdown. The fall in unemployment in New South Wales in July 2021 was more pronounced than either of these, falling by 27,000 people."
"In each of these instances, the unemployment rate also fell. Falls in unemployment and the unemployment rate may be counter-intuitive, given they have coincided with falls in employment and hours, but reflect the limited ability for people to actively look for work and be available for work during lockdowns. This means that people are falling out of the labour force."
GBP/USD Mid-Day Outlook
Daily Pivots: (S1) 1.3727; (P) 1.3757; (R1) 1.3786; More...
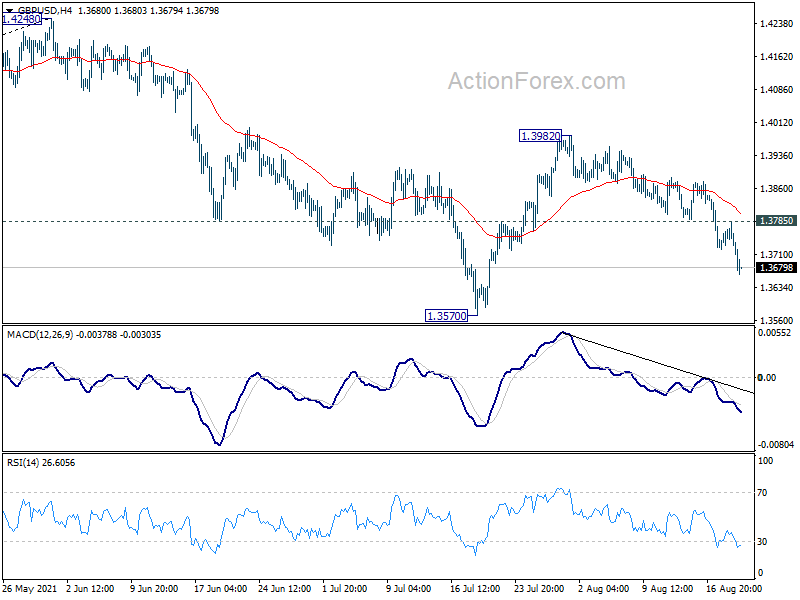
GBP/USD's fall continues to as low as 1.3673 so far and intraday bias stays on the downside for 1.3570 support. Break there will resume the fall form 1.4248 to 1.3482 resistance turned support. Firm break there will carry larger bearish implication and target 38.2% retracement of 1.1409 to 1.4248 at 1.3164. On the upside, above 1.3785 minor resistance will mix up the near term outlook and turn intraday bias neutral first.
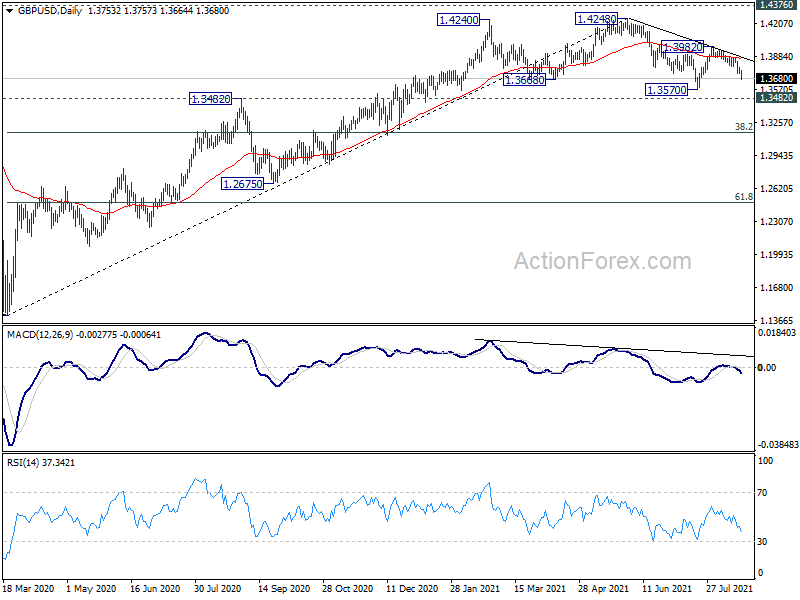
In the bigger picture, as long as 1.3482 resistance turned support holds, up trend from 1.1409 should still continue. Decisive break of 1.4376 resistance will carry larger bullish implications. However, firm break of 1.3482 will argue that the rise from 1.1409 has completed. GBP/USD would then be seen as in another leg of long term range pattern between 1.1409 and 1.4376. Deeper fall could then be seen to 61.8% retracement of 1.1409 to 1.4248 at 1.2493, and even below.
Economic Indicators Update
| GMT | Ccy | Events | Actual | Forecast | Previous | Revised |
|---|---|---|---|---|---|---|
| 01:30 | AUD | Employment Change Jul | 2.2K | -45.0K | 29.1K | |
| 01:30 | AUD | Unemployment Rate Jul | 4.60% | 5.00% | 4.90% | |
| 06:00 | CHF | Trade Balance (CHF) Jul | 5.25B | 4.78B | 5.53B | 5.47B |
| 08:00 | EUR | Eurozone Current Account (EUR) Jun | 21.8B | 12.3B | 11.7B | 13.9B |
| 12:30 | CAD | ADP Employment Change Jul | 221.3K | -294.2K | ||
| 12:30 | USD | Initial Jobless Claims (Aug 13) | 348K | 362K | 375K | 377K |
| 12:30 | USD | Philadelphia Fed Manufacturing Aug | 19.4 | 24.3 | 21.9 | |
| 14:30 | USD | Natural Gas Storage | 28B | 49B |
GBP/USD Mid-Day Outlook
Daily Pivots: (S1) 1.3727; (P) 1.3757; (R1) 1.3786; More...
GBP/USD's fall continues to as low as 1.3673 so far and intraday bias stays on the downside for 1.3570 support. Break there will resume the fall form 1.4248 to 1.3482 resistance turned support. Firm break there will carry larger bearish implication and target 38.2% retracement of 1.1409 to 1.4248 at 1.3164. On the upside, above 1.3785 minor resistance will mix up the near term outlook and turn intraday bias neutral first.
In the bigger picture, as long as 1.3482 resistance turned support holds, up trend from 1.1409 should still continue. Decisive break of 1.4376 resistance will carry larger bullish implications. However, firm break of 1.3482 will argue that the rise from 1.1409 has completed. GBP/USD would then be seen as in another leg of long term range pattern between 1.1409 and 1.4376. Deeper fall could then be seen to 61.8% retracement of 1.1409 to 1.4248 at 1.2493, and even below.