Sample Category Title
GBP/USD Sees Limited Rebound
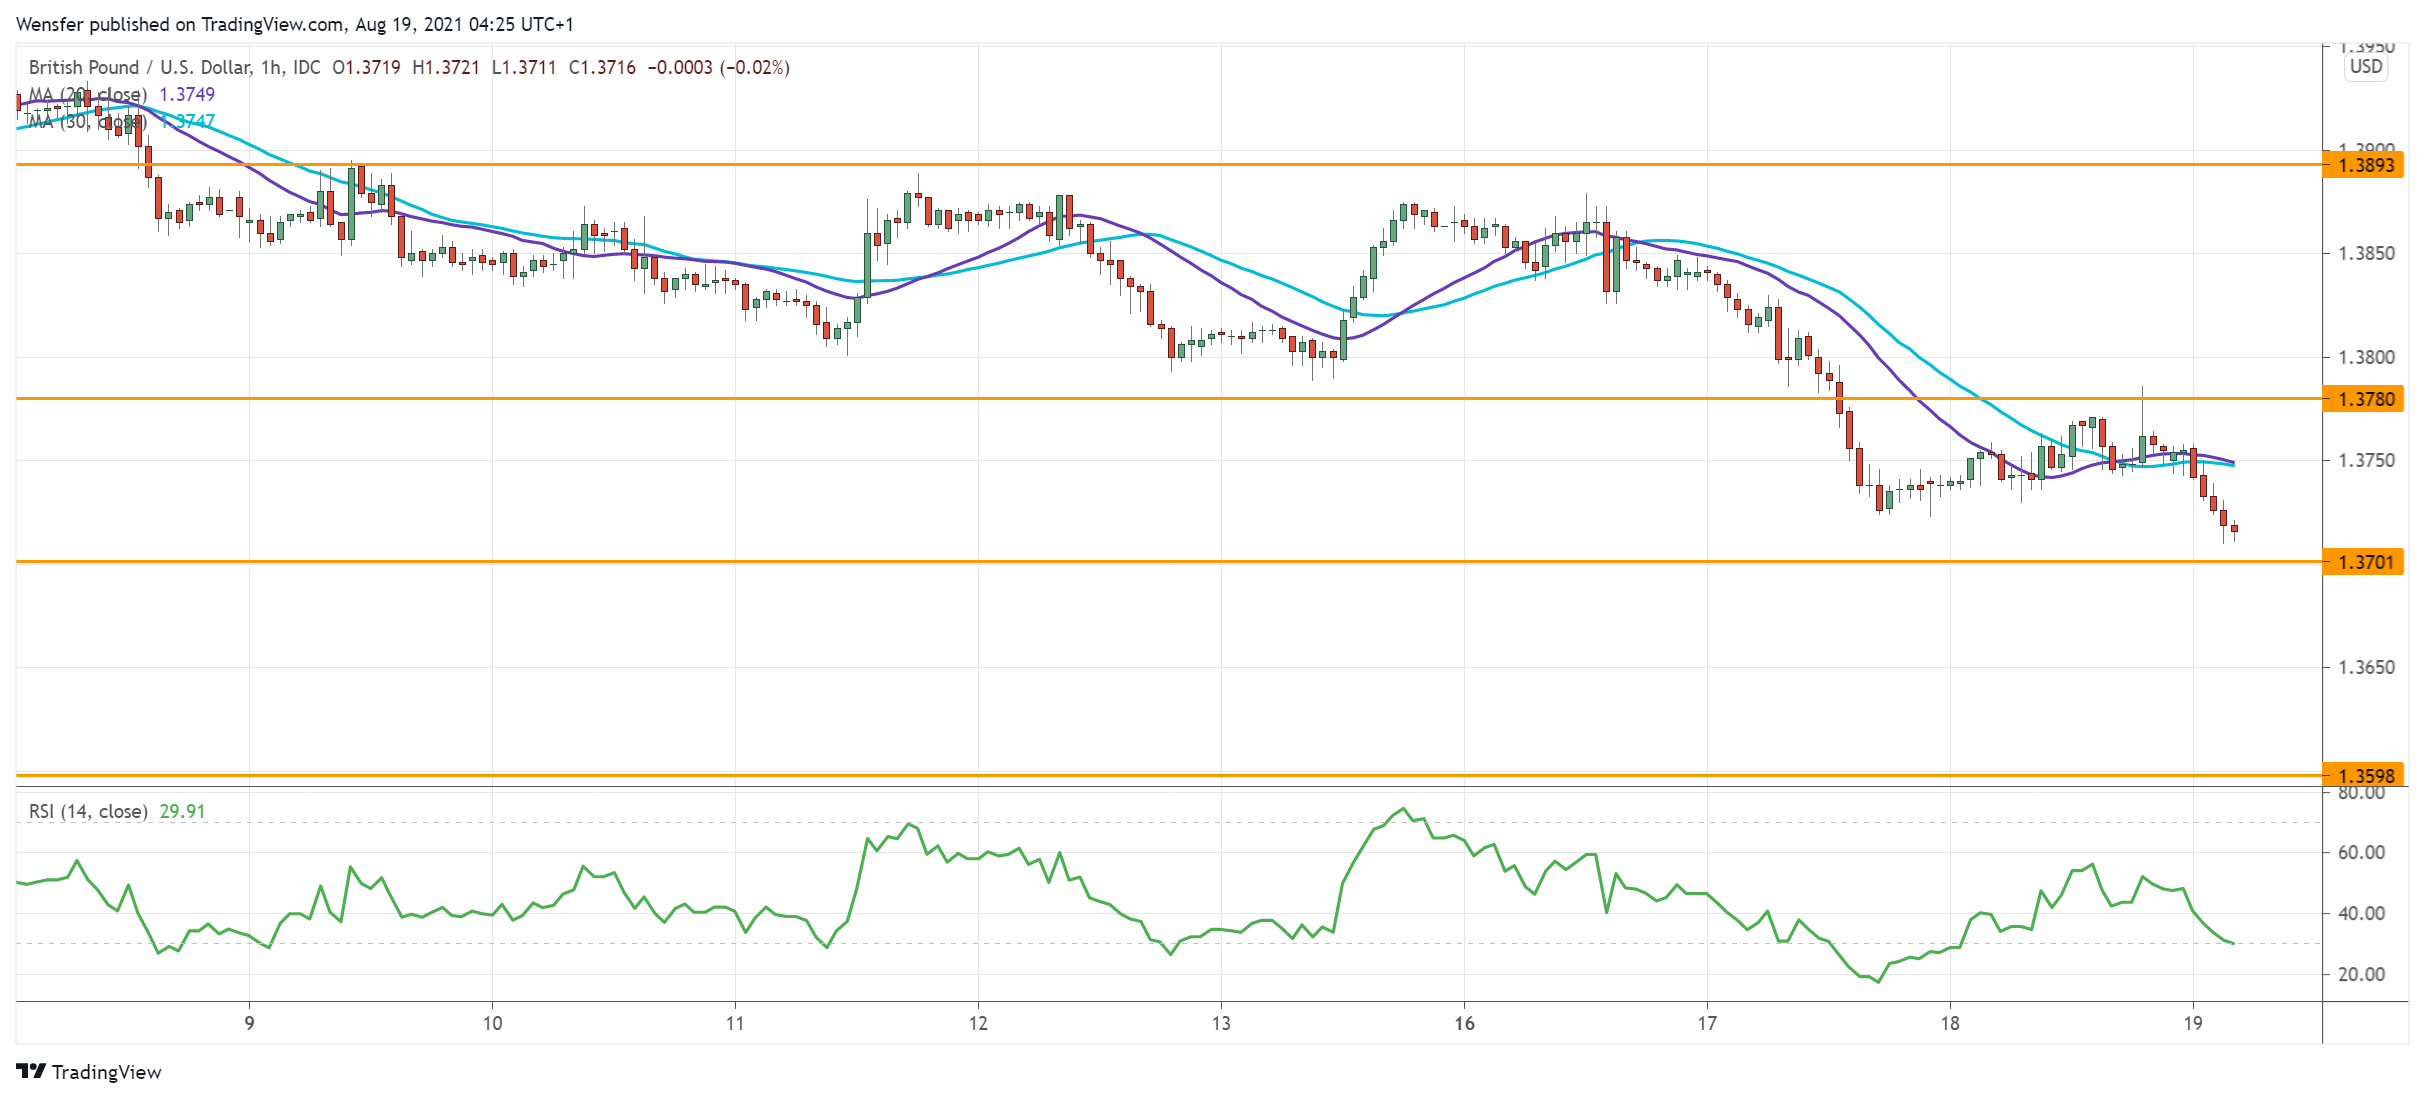
The sterling remains under pressure after the UK’s lower-than-expected core CPI in July. The break below the intermediate support at 1.3800 has accelerated the downward impetus.
An oversold RSI has helped lift the price but this could be a dead cat bounce with sellers eager to double down at a better fill.
1.3780 is a fresh resistance and likely to check the pound’s advance. 1.3700 is the closest support which coincides with the 61.8% Fibonacci retracement of the July rally.
Further down, 1.3600 is a demand zone on the daily chart.
EUR/USD Breaks Critical Support
The US dollar rose after the Fed minutes suggested tapering later this year.
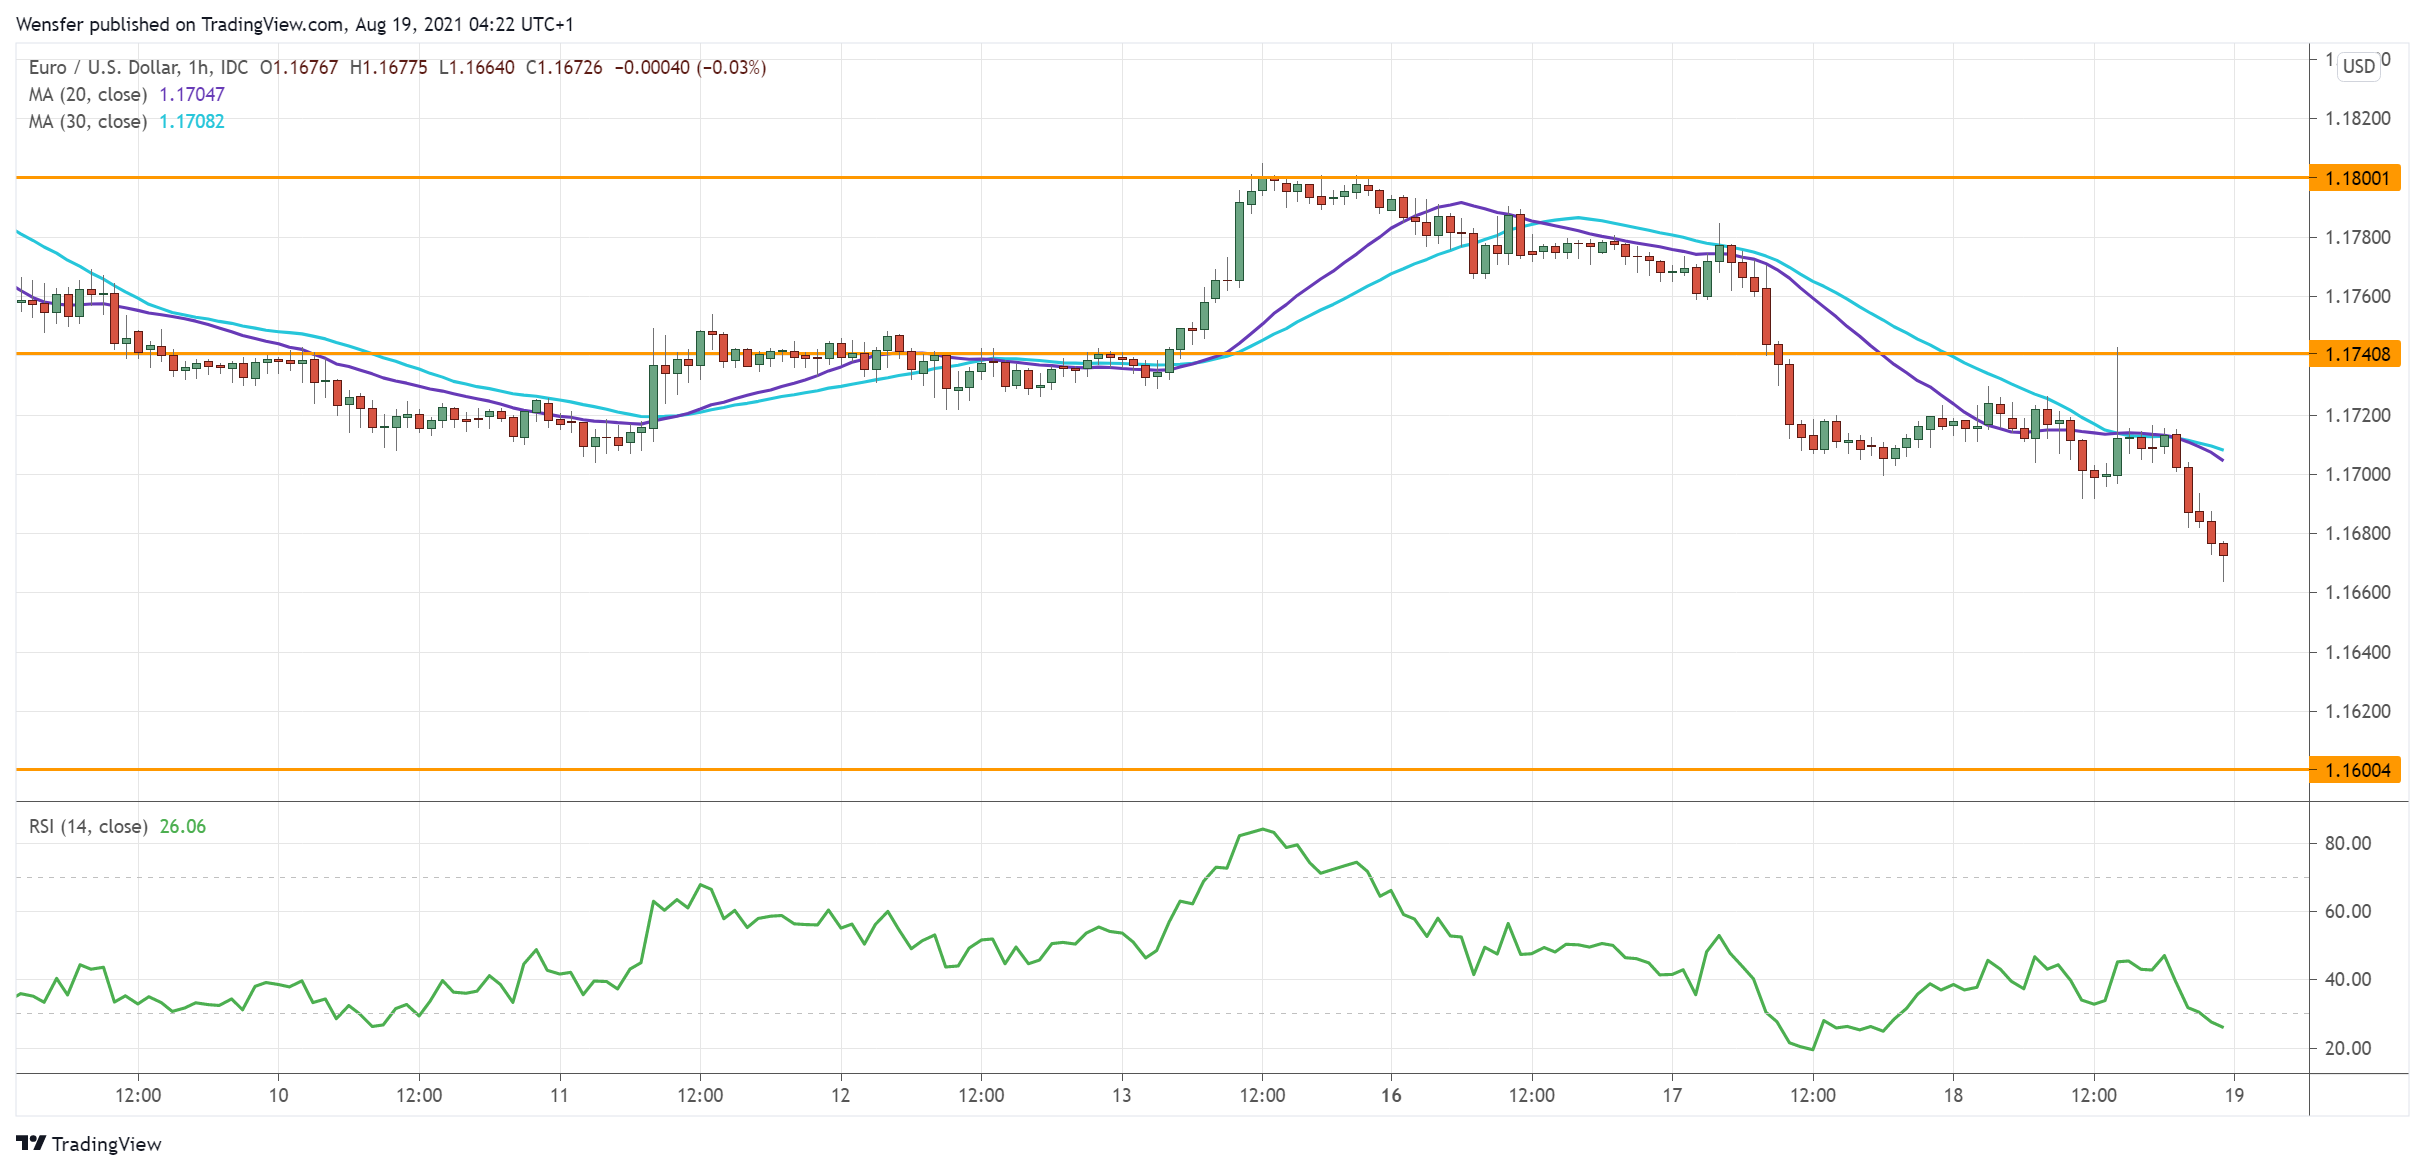
The euro’s previous rebound had met stiff selling pressure at 1.1800. The slide below 1.1710 (a critical support from last March) is an indication that sellers still have control of the direction.
A temporary bounce while the RSI recovers to the neutrality area can be an opportunity to sell into strength.
The former support at 1.1740 has turned into a supply zone. Below 1.1700 renewed momentum may drive the pair to October’s low at 1.1600.
The Dollar Has Fought Its Way Up, The Rally Is Just Beginning
Global equity markets strengthened their decline, and the dollar gained momentum after Fed minutes indicating a readiness to start QE tapering as early as this year.
The dollar index rose to its highest level since November 2020, surpassing the reversal levels of July and April, indicating an upward exit from a prolonged consolidation.
Historically, the dollar starts to add to its competitors shortly before a rate hike and for some time afterwards. On average, this rally lasts for two to three quarters. However, the starting point should be June, when the DXY retreated from its local bottom below 90, adding 3.5% since.
A breakout of the USDCAD above its 200-day average gives confidence that American investors have definitively chosen the dollar trend. The Canadian dollar has remained under pressure for a while despite rising oil, which shows the strength of forex undercurrents.
We should not be surprised if the impulse of the USD continues and gathers strength even in the first quarter of next year. In 2014, the last time it was in a similar situation, the DXY added 25% before rising sideways. It isn’t easy to expect such movements this time, but a return to the peak values of recent years around 104 should be considered a workable scenario.
For EURUSD, the bullish for the USD scenario opens a direct route to 1.0800-1.0500, where the pair has repeatedly gained support even during periods of high market turbulence in the last seven years. In other words, the downside potential here is 7-10%.
GBPUSD has crossed its line in the sand, confirming its cross below 200-day MA this week, while the 50-day MA has turned into a resistance.
Interestingly, there are almost no technical obstacles for the GBPUSD to decline to the 1.2000 area, 12% below the current levels. Often the Pound moves with more amplitude than the Euro, proving to be more sensitive to the fluctuations in market sentiment.
The situation in AUDUSD looks potentially interesting. Since June, the pair has been on a soft landing, but the decline is picking up sharply this week. Rising contagion cases and a tightening lockdown in the country adds to players’ nervousness. Should the pair fall from the current 0.7190 to 0.7000, the sell-off in the Aussie could become particularly fierce, heading the pair towards the 0.6300-0.6600 area.
The Dollar Is Flexing Its Muscle, Forcing Technical Breaks
Markets
FOMC Minutes of the July meeting might have convinced the final doubters that the US central bank soon will give the all clear to start tapering asset purchases “in coming months”. The majority of Fed members is convinced that sufficient progress has been made towards reaching the symmetric 2% inflation target, but wanted slightly more proof on the health of the labour market. July payrolls (nearly +1 million) already worked their magic with a solid August report probably being sufficient to announce a tapering framework at the September FOMC meeting. The effective dialing back of purchases can than commence in Q4 as a quid pro quo for the doves inside the Fed. While the effective start date and the exact pace of reducing the current $80bn/month US Treasury and $40bn/month MBS purchases remains topic of debate, Fed members did reach a consensus on dialing back both programmes proportionally in order for them to end simultaneously. We could be looking at a mid-2022 end date on the back of comments by individual Fed governors hinting at a faster tapering than the 10 months during the previous cycle because of a stronger economy/labour market and hotter inflation compared to back then. Additionally, the Fed currently has to deal with supply rather than with demand problems. Such tapering scenario paves the way for a rate lift-off by the end of 2022.
The release of the Minutes triggered some volatility in the US Treasury and FX market, but no directional move. The one market that did show a significant reaction was the US stock market. Different positioning is a likely reason. Main indices fainted in the final trading hour to lose around 1% in the close. Risk aversion spills into Asian dealings overnight Korea and Taiwan underperforming (> -2%). The dollar is flexing its muscle, forcing technical breaks. EUR/USD drops below 1.1704/1.1695 support to change hands near 1.1680, the lowest level since November last year. Intermediate support stands at 1.1612/03 (Sep/Nov 2020 low) ahead of the next key technical level of 1.1495/93 (March 2020 high/50% retracement 2020 EUR/USD rally). The trade-weighted greenback (DXY) forced its way above the 93.19 July top to currently test the YTD high at 93.44. Moving north of this level will accelerate EUR/USD selling. Even the Japanese yen can’t keep up with the dollar this morning despite the risk-off climate. USD/JPY paves its way back above 110. Core bonds for now can’t choose sides between the upcoming tapering and risk aversion. We think the risk climate will play first fiddle, suggesting a positive short term bias for bonds. Today’s eco calendar contains US weekly jobless claims and Philly Fed Business Outlook. We don’t expect them to impact trading with risk sentiment the key driver.
News headlines
Australian employment unexpectedly grew a marginal 2.2k in July. Markets expected a decline of more than 43k. The rise came on the account of part time jobs (+6.4k). The unemployment rate declined further below pre-pandemic levels to 4.6% while consensus saw a minor rise possible. The good news ends here though, since the fall was largely the result of an easing participation rate from 66.2% to 66%. Hours works also fell 0.2%. Additionally, future job reports are likely to feel the impact from more (regional) lockdowns that have been introduced in the course of July and August. The Aussie dollar slips and is currently testing and risks losing the AUD/USD 0.72 big figure. A generally stronger USD in the wake of the Fed policy meeting minutes and Asian risk-off is also playing.
Iron ore slips another 6%+ this morning, bringing the total decline from its 2021 high to more than 35% already. The accelerating selloff comes as China is pushing forward with its pledge to reduce steel production in order to cut carbon emissions. At the same time, demand for iron/steel in the country is waning and expected to soften further amid efforts by authorities to reduce leverage, tightening property policy and a general slowdown of economic momentum.
US Dollar Gains Momentum After Hawkish FOMC Minutes
US stocks declined on Wednesday as the market reacted to the latest Federal Reserve minutes. The minutes showed that most members of the bank’s monetary policy committee believe that the economic recovery could help tapering by the end of this year. These minutes supported statements by some of the bank’s officials. On Wednesday, Fed’s Eric Rosengreen said that the bank should start tapering its asset purchases and that some Federal stimulus should be removed to supercharge the economy. He argued that some of the measures like the enhanced unemployment benefits were encouraging some people not to work. The Dow Jones index declined by 382 points while the S&P 500 fell by 47 points.
US futures tilted higher overnight, with the Dow Jones and Nasdaq 100 adding 30 and 10 points each. This price action was mostly because of strong earnings by Nvidia. The company reported that its revenue surged by more than 60% in the second quarter. It also boosted its third-quarter revenue estimate to between $6.6 billion and $6.94 billion. As a result, its stock price jumped by more than 2% in the futures market. The futures also rose after reports that CME Group was holding talks to acquire CBOE Global Markets in an all-stock deal worth $16 billion. CME rejected the claim.
The Australian dollar slumped in the overnight session after the country published strong employment numbers. The country’s unemployment rate declined from 4.9% in June to 4.6% in July. This number was better than the median estimate of 5.0%. The participation rate declined from 66.2% to 66.0%. This happened as the country added just 2.2k jobs after it added more than 29k jobs in the previous month. The currency declined as investors priced in the country’s controversial stance on lockdowns in New South Wales and Victoria.
AUDUSD
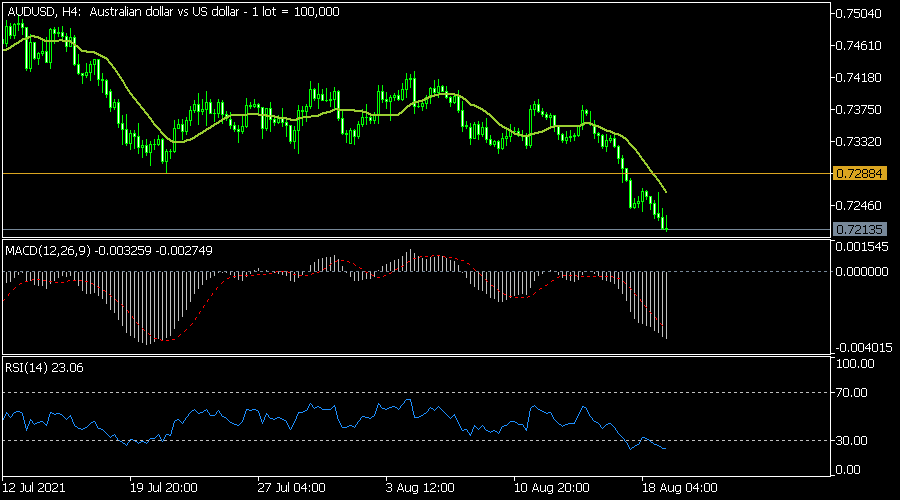
The AUDUSD pair declined sharply during the overnight session. It fell to 0.7210, which was the lowest level since November last year. On the four-hour chart, the pair moved below the 25-day and 15-day moving averages. It also fell below the key support at 0.7288, which was the lowest level on July 31st. The MACD has moved below the neutral level while the Relative Strength Index (RSI) has moved to the oversold level. Therefore, the pair may keep falling as bears target the next psychological level at 0.7100.
EURUSD
The EURUSD pair declined to 1.1685, which was the lowest level since November after hawkish Fed minutes. On the four-hour chart, the price moved below the key support level at 1.1700. It also fell below the 25-day and 15-day moving averages. The Relative Strength Index (RSI) and MACD have also been in a deep dive in the past few days. Therefore, for now, the path of least resistance is lower.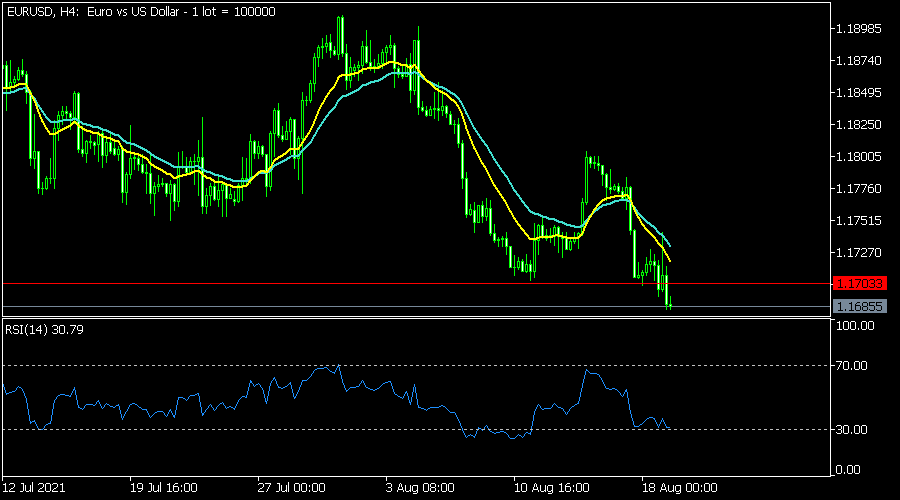
USDJPY
The USDJPY has been in an upward trend mostly because of the stronger US dollar. It rose from this week’s low of 109.10 to a high of 110.08. On the four-hour chart, the pair has moved to the upper side of the Bollinger Bands indicator. The MACD has made a bullish crossover while the DeMarker indicator has moved to the overbought level. Therefore, the pair may keep rising as bulls target the next key resistance at 110.50.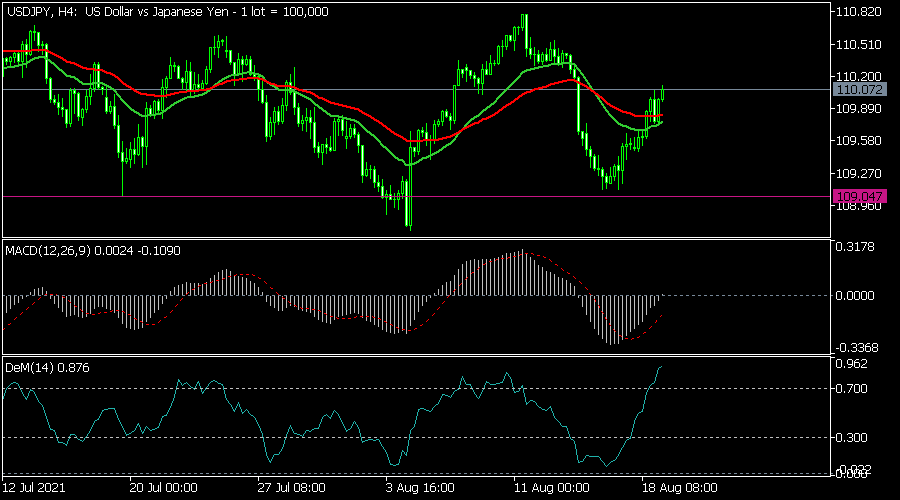
GBP/JPY Daily Outlook
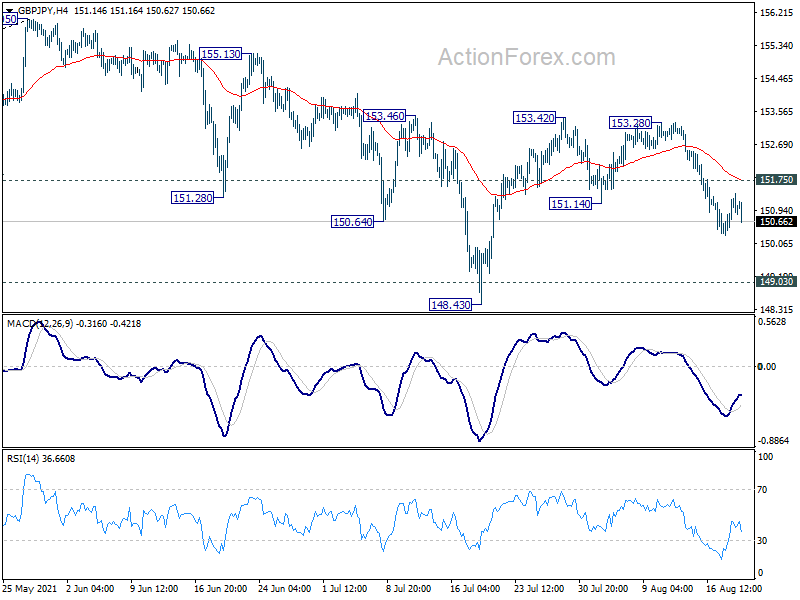
Daily Pivots: (S1) 150.48; (P) 150.94; (R1) 151.47; More...
Intraday bias in GBP/JPY stays on the downside with 151.75 minor resistance intact. Deeper fall in favor to retest 148.43 support. On the upside, above 151.75 minor resistance will bring stronger recovery. But break of 153.28 resistance is now needed to indicate resumption of rebound from 148.43. Otherwise, risk will stay mildly on the downside in case of recovery.
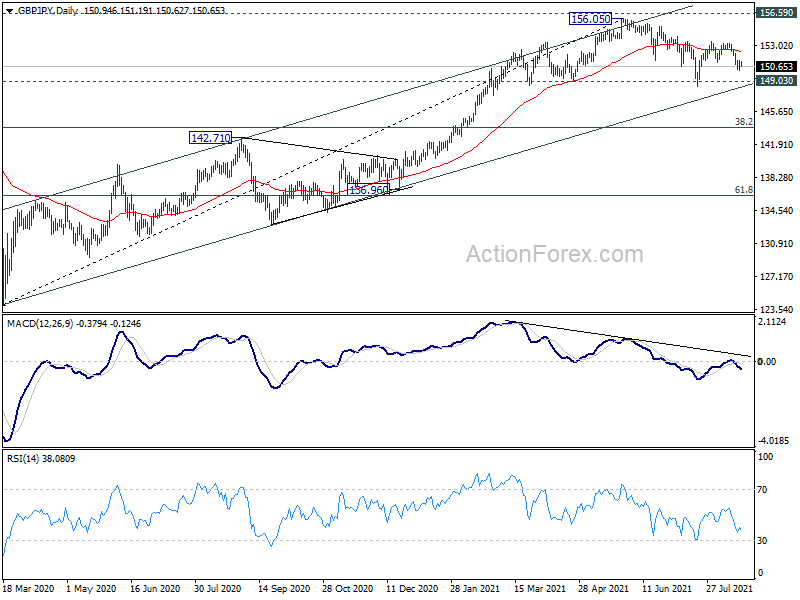
In the bigger picture, rise from 123.94 is seen as the third leg of the pattern from 122.75 (2016 low). Focus remains on 156.59 resistance (2018 high). Sustained break there should confirm long term bullish trend reversal. Next target is 61.8% retracement of 195.86 (2015 high) to 122.75 at 167.93. On the downside, sustained break of 149.03 support, however, will indicate rejection by 156.59. Fall from 156.05 would be at least correcting the whole rise from 123.94. Deeper fall would be seen back to 142.71 resistance turned support first.
EUR/JPY Daily Outlook
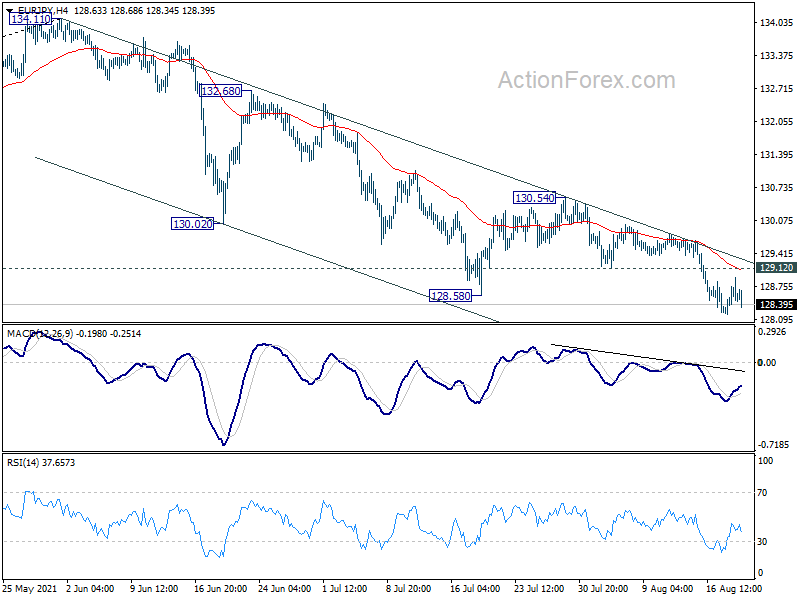
Daily Pivots: (S1) 128.20; (P) 128.57; (R1) 128.92; More....
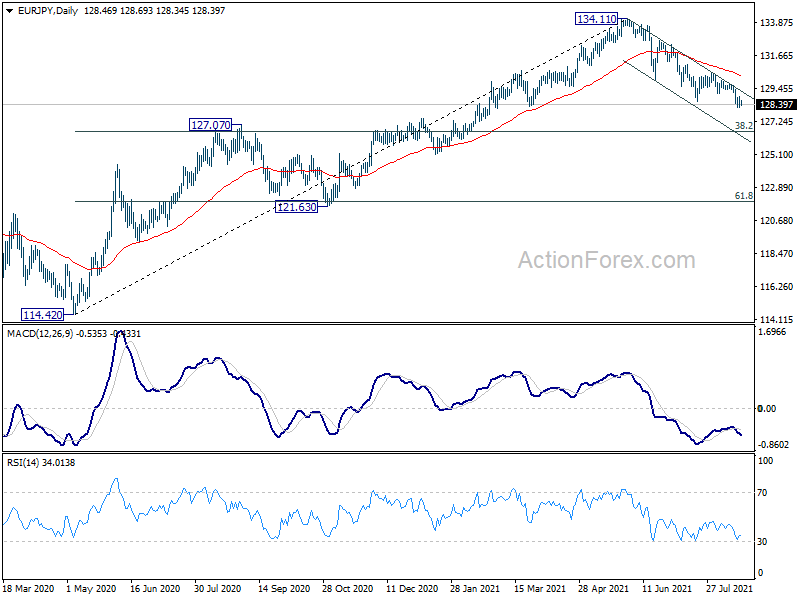
With 129.12 minor resistance intact, further fall is expected in EUR/JPY, to 127.07 resistance turned support. That is close to 38.2% retracement of 114.42 to 134.11 at 126.58. On the upside, above 129.12 minor resistance will bring stronger recovery. But overall outlook will stay bearish as long as 130.54 resistance holds.
In the bigger picture, rise from 114.42 is seen as a medium term rising leg inside a long term sideway pattern. As long as 127.07 resistance turned support holds, further rise is still expected to retest 137.49 (2018 high). However, firm break of 127.07 will argue that the medium term trend has reversed, and open up the case for retesting 114.42.
EUR/GBP Daily Outlook
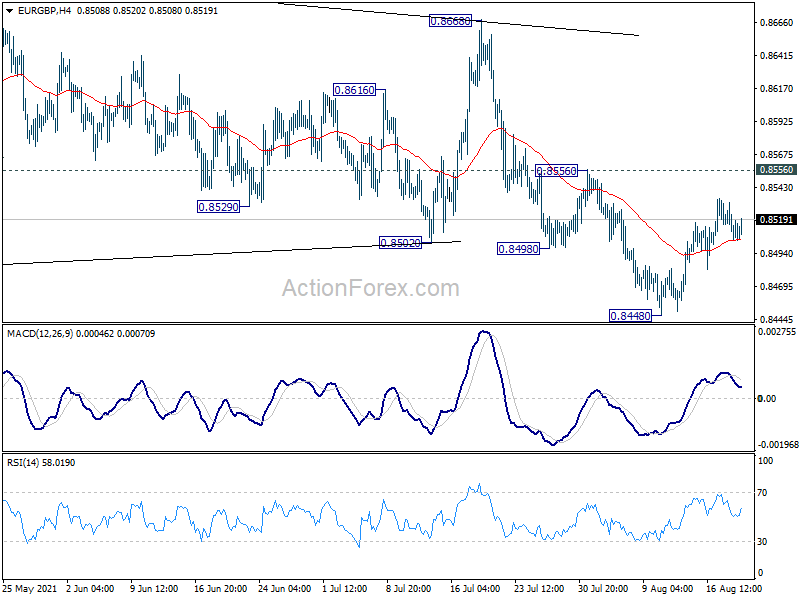
Daily Pivots: (S1) 0.8502; (P) 0.8517; (R1) 0.8529; More...
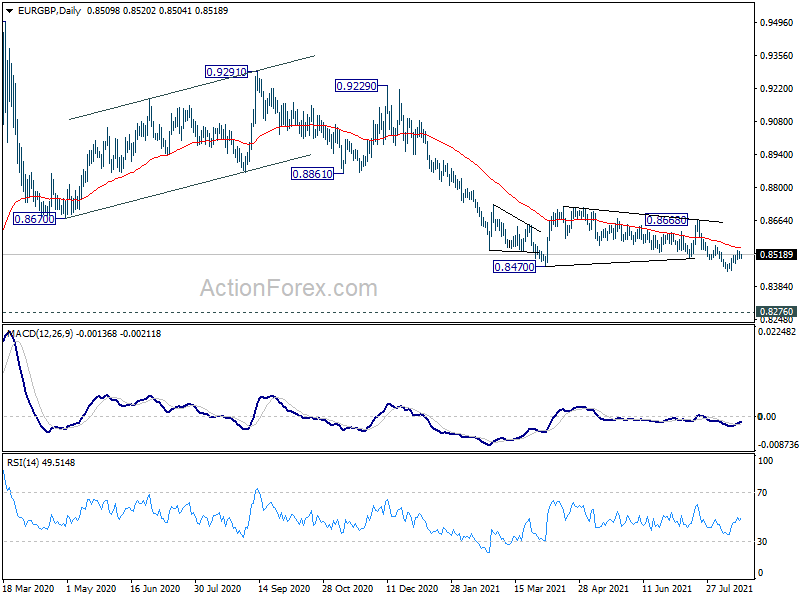
Outlook in EUR/GBP remains unchanged for now and intraday bias remains neutral. Further fall is expected with 0.8556 resistance intact. On the downside, break of 0.8448 will resume the whole decline from 0.9799, to retest 0.8276 key long term support level. However, break of 0.8556 will bring stronger rebound back to 0.8668 resistance.
In the bigger picture, price actions from 0.9499 (2020 high) are still seen as developing into a corrective pattern. Deeper fall could be seen as long as 0.8718 resistance holds, towards long term support at 0.8276. However, firm break of 0.8668 resistance would argue that a medium term bottom was already formed. Stronger rise would be seen to 0.8861 support turned resistance to confirm completion of the corrective pattern.
EUR/AUD Daily Outlook
Daily Pivots: (S1) 1.6138; (P) 1.6165; (R1) 1.6210; More...
EUR/AUD's rally accelerates to as high as 1.6254 so far today. The strong break of 1.6182 resistance confirms resumption of the choppy rise from 1.5250. Intraday bias stays on the upside for 1.6827 resistance next. On the downside, below 1.6150 minor support will turn intraday bias neutral and bring retreat first. but outlook will stay bullish as long as 1.5898 support holds, in case of retreat.
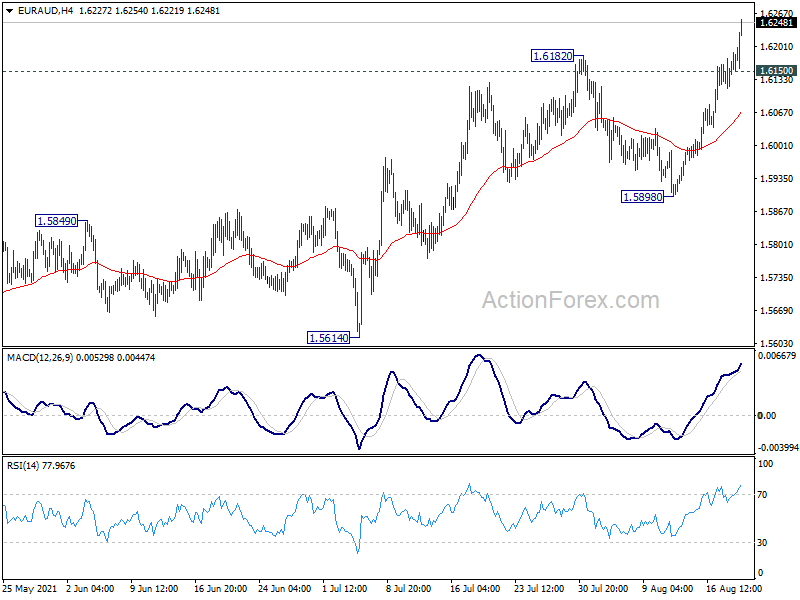
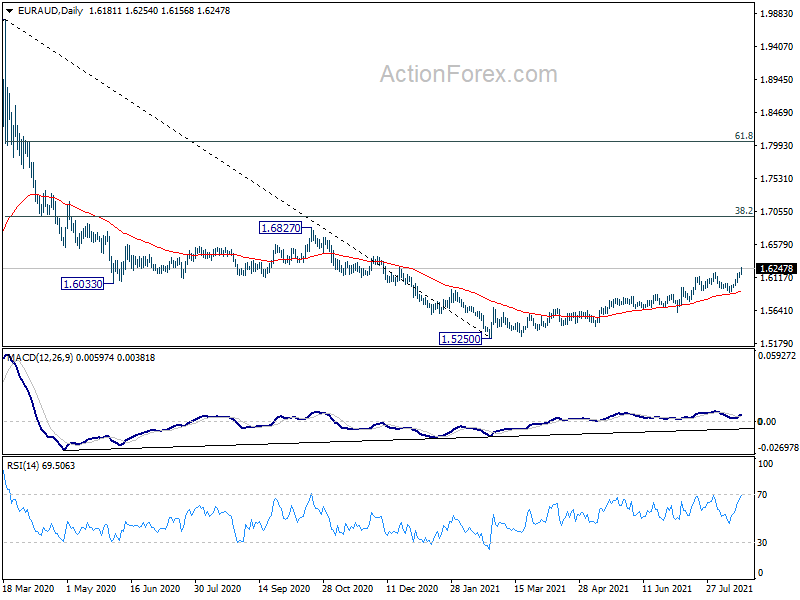
In the bigger picture, rise from 1.5250 medium term bottom is currently seen as a correction to the down trend from 1.9799 first. Stronger rise would be seen to 38.2% retracement of 1.9799 to 1.5250 at 1.6988 next. We'd tentatively expect strong resistance from there to limit upside, at least on first attempt. Meanwhile, break of 1.5898 support will indicate that the rebound has completed and bring retest of 1.5250 low.
EUR/CHF Daily Outlook
Daily Pivots: (S1) 1.0706; (P) 1.0732; (R1) 1.0762; More....
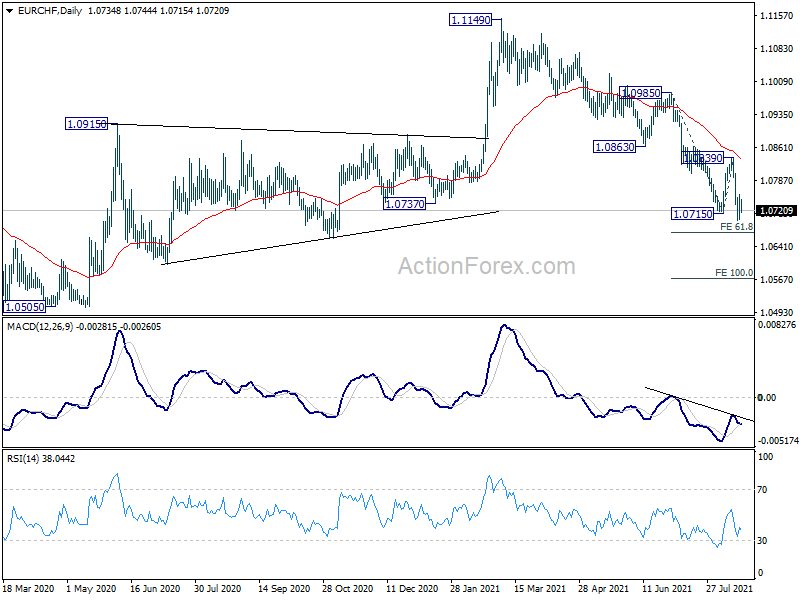
Intraday bias in EUR/CHF is turned neutral first, as a temporary low was formed at 1.0698 with current recovery. But outlook will stay bearish as long as 1.0839 resistance holds. Below 1.0698 will resume larger decline from 1.1149. Next target is 61.8% projection of 1.0985 to 1.0715 from 1.0839 at 1.0672 first. Break will target 100% projection at 1.0569 next.
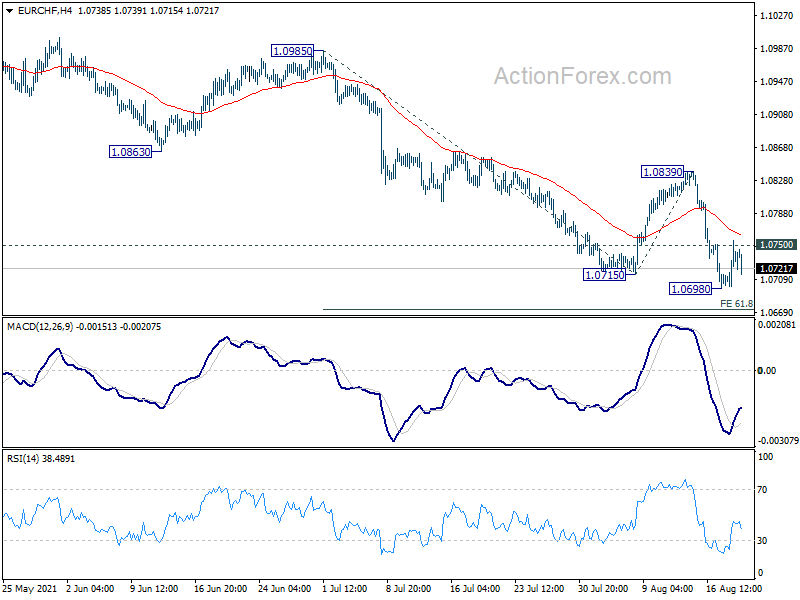
In the bigger picture, rebound from 1.0505 (2020 low) should have completed at 1.1149 already. The three-wave corrective structure argues that the downtrend from 1.2004 (2018 high) is not over yet. Medium term outlook will now stay bearish as long as 55 week EMA (now at 1.0865) holds. Break of 1.0505 low would be seen at a later stage.