Sample Category Title
WTI Futures Plunge For The Sixth Straight Day
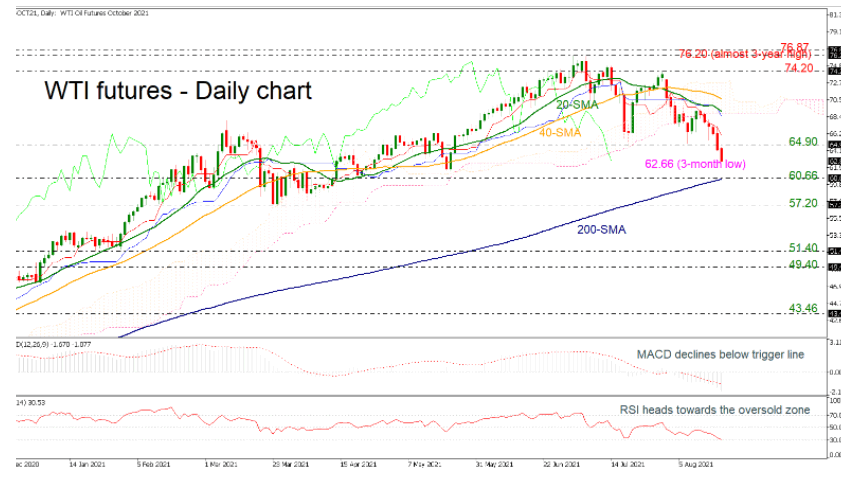
WTI crude oil futures plunged to a new three-month trough of 62.66 earlier today, creating the sixth straight bearish day. The MACD oscillator is falling further below its trigger and zero lines, while the RSI is touching the oversold territory. In trend indicators, the 20- and 40-day simple moving averages (SMAs) as well as the Ichimoku lines are sloping downwards.
Immediate support could come from the 60.66 barrier, which overlaps with the 200-day SMA. More decreases could open the way for a longer-term bearish tendency, hitting the 57.20 and the 51.40 supports.
On the other hand, a jump above 64.90 could open the way for the lower surface of the Ichimoku cloud around 68.89 and the 40-day SMA at 70.70. More upside pressure could meet the 74.20 resistance and the almost three-year high of 76.20 before adding to optimism for a broader bullish outlook, challenging 76.87.
To sum up, WTI futures have been under selling interest over the last month and any moves below the 200-day SMA could open the way for a longer-term negative move.
EUR/USD Outlook: Euro Falls To New 2021 Low, Risks Deeper Correction
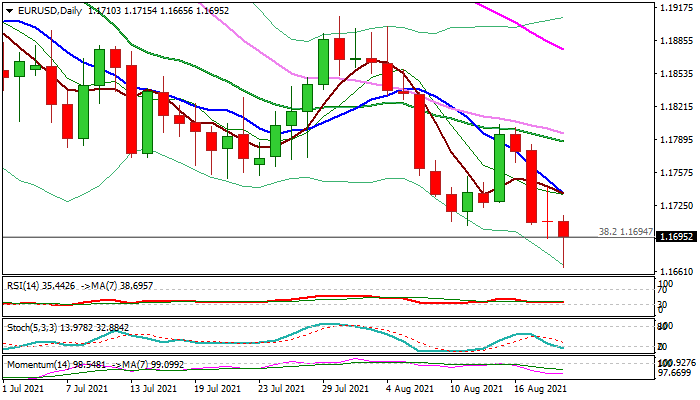
The Euro holds firmly in red for the fourth straight day and hit new 2021 low (1.1665) on probe through key supports at 1.1704/1.1694 (former annual low of Aug 11/Fibo 38.2% of 1.0635/1.2349 rally).
Fresh risk aversion on fears that rising number of new Covid cases could slow global economic recovery and threats of escalation of crisis in Afghanistan, keep the single currency under increased pressure.
Stronger dollar on risk aversion and Fed’s signals of potential start of tapering, although the central bankers are still lacking agreement over key points – labor and inflation – adds to Euro’s negative sentiment.
Clear break of pivotal 1.1700 support zone would further weaken the structure and risk fresh acceleration towards the higher base at 1.1630/00 and more significant 1.1500 zone (weekly cloud base/50% of 1.0635/1.2349 ascend.
Bearish daily techs support the notion with corrective upticks on oversold conditions, expected to fade under pivotal barriers at 1.1800 zone (Aug 13 lower top / falling 10DMA) and offer better selling opportunities..
Res: 1.1715, 1.1737, 1.1787, 1.1804.
Sup: 1.1665, 1.1630, 1.1600, 1.1500.
Stock Selloff Deepens, Dollar Capitalizes
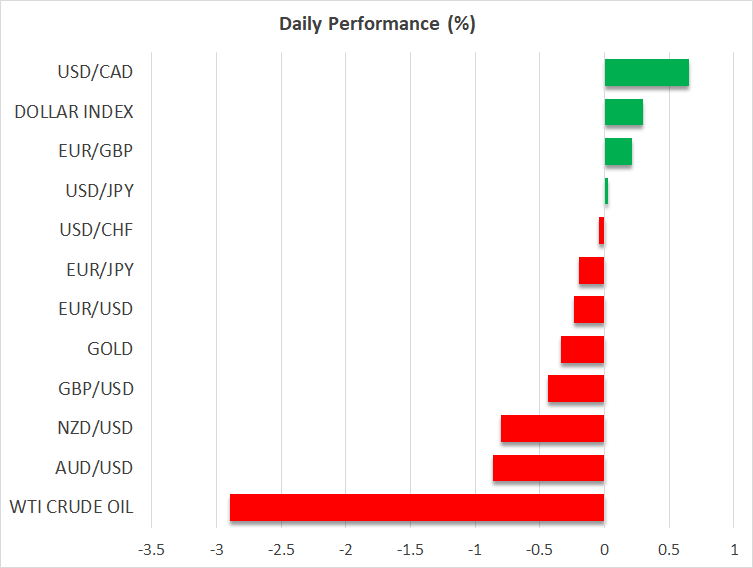
- Risk aversion pummels stocks, oil, and commodity FX
- US dollar shines bright as traders seek protection
- Fed minutes don't reveal much, gold unable to shine
Growth fears deepen
A sense of nervousness has returned to haunt financial markets. Investors are increasingly slashing their exposure to riskier assets amid concerns that the Delta outbreak will kneecap global growth, at a time when central banks are trying to take their foot off the accelerator.
One by one, different charts are telling the same story. First it was the bond market that raised the alarm, next it was the commodity currencies and crude oil that started rolling over, and then the hammer fell on Chinese and small-cap stocks. Now the pain is spilling over into quality large-cap equities, which were the last bastion of optimism.
The S&P 500 lost around 1% yesterday and futures point to a similarly negative open today, without any major news. The FOMC minutes overnight didn't reveal anything new, so it is difficult to pin the blame on that. Instead, it looks like the markets simply reached a breaking point, after weeks of souring economic data and distressing virus news.
Whether this selloff persists will likely depend on what the Fed says at next week's Jackson Hole symposium. Concrete signals that a tapering move is on the table for September could provide the bears with more fuel. That said, the bigger picture remains promising. Investors will ultimately remember that equities are still the only play that provides any real returns, especially with Congress stepping up its fiscal game.
Dollar slices higher
It wasn't just stock markets that suffered, though. Crude oil also cracked below crucial levels, alongside the entire commodity FX space. Even some solid jobs numbers out of Australia overnight were unable to stop the onslaught.
The only sanctuary was the US dollar. Beyond its role as the world's reserve asset, the dollar could also be gaining traction on hopes the American economy will weather the Delta storm better than its rivals, thanks to relentless fiscal support.
Meanwhile, the Fed remains committed to normalization. Minutes from the July FOMC meeting showed ‘most' officials think tapering can begin this year, and this was before another stellar jobs report was released. Inflation is hot, the economy is now bigger than it was before the crisis, and the labor market could be near full employment by year-end.
The main risk is the nation's relatively low vaccination rate. That makes America more susceptible to another outbreak than Europe, especially if a more infectious or lethal variant comes along. Even so, this doesn't always translate into a direct economic hit as US authorities are typically much more hesitant to enact social restrictions.
Gold can't capitalize, sterling struggles too
Gold may be a shiny metal but its ability to glitter during periods of turmoil has all but evaporated since the pandemic hit, with the dollar replacing it as the market's favorite defensive instrument. And since the dollar and bullion usually move in opposite directions, gold has started behaving like a risky asset.
This dynamic is on full display today, with gold unable to capitalize on all the risk aversion or falling Treasury yields. Instead, it is being hammered lower by a resurgent dollar.
Finally, another casualty of the souring mood has been sterling. There hasn't been any massive news out of the UK, so it seems like the pound has been caught in the broader storm of risk aversion.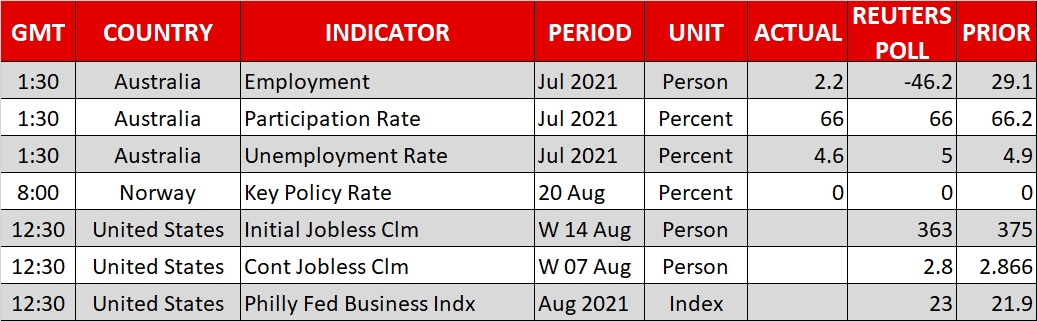
Gold Buying The Dips Continues
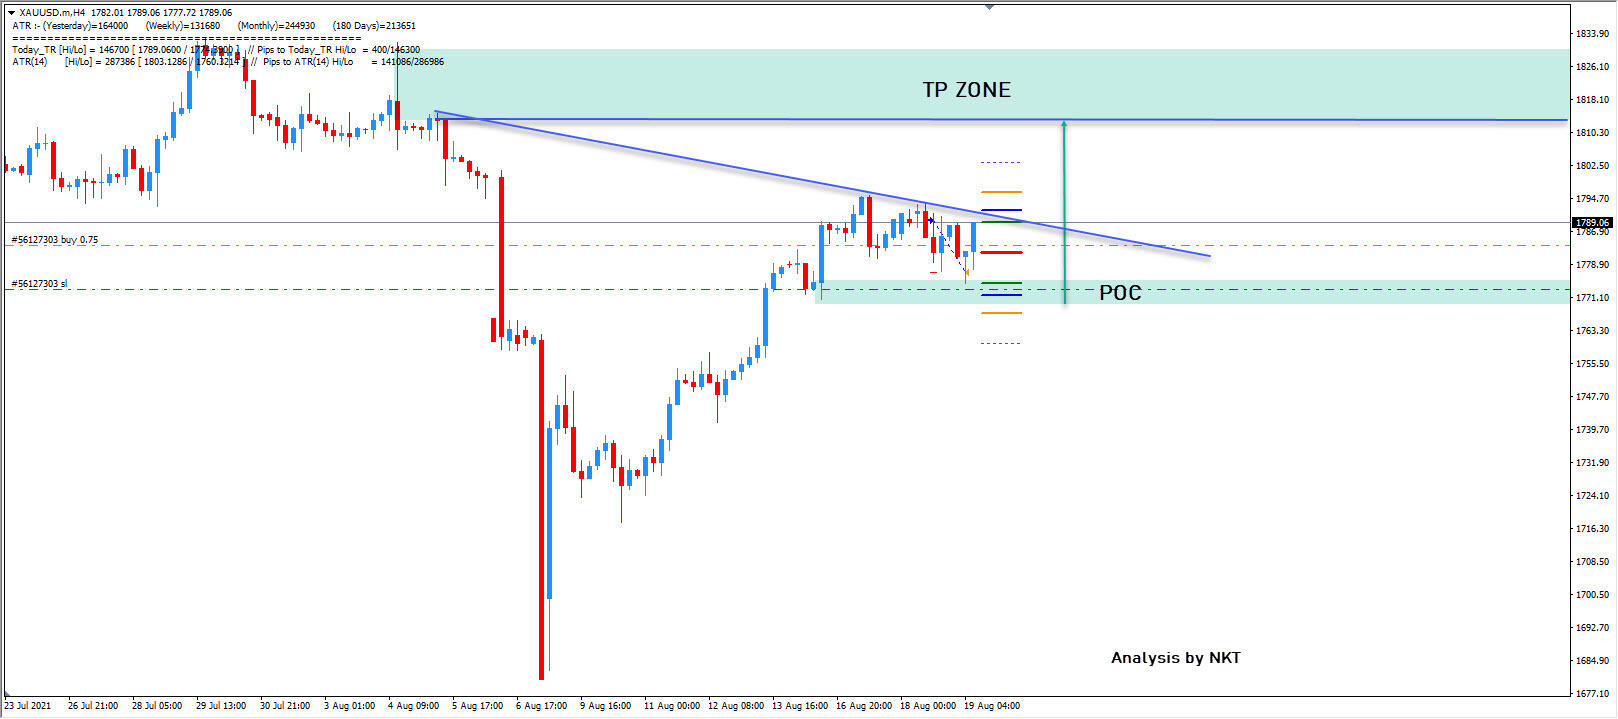
Gold has made a support and it is going up. Price is bullish.
I am buying the dips in GOLD. We have established 1780 as a support and we should see 1790 soon. If the price breaks 1795 it will have a strong momentum up. Watch for the break of 1800 for further up towards the green TP zone as shown in the chart. Buying the dips continues as I am bullish today.
The Analytical Overview Of The Main Currency Pairs
The EUR/USD currency pair
Technical indicators of the currency pair:
Prev Open: 1.1709
Prev Close: 1.1709
% chg. over the last day: 0.00%
The EU consumer price index showed that the inflation rate in Europe increased from 1.9% to 2.2%, which is above the ECB target level of 2%. It is not clear now how the ECB will react to this, especially considering the fact that the ECB's balance sheet is already over 8 trillion euros and now equals 78.1% of Eurozone GDP versus the Fed's 36.3% and the Bank of England's 38.5%.
Trading recommendations
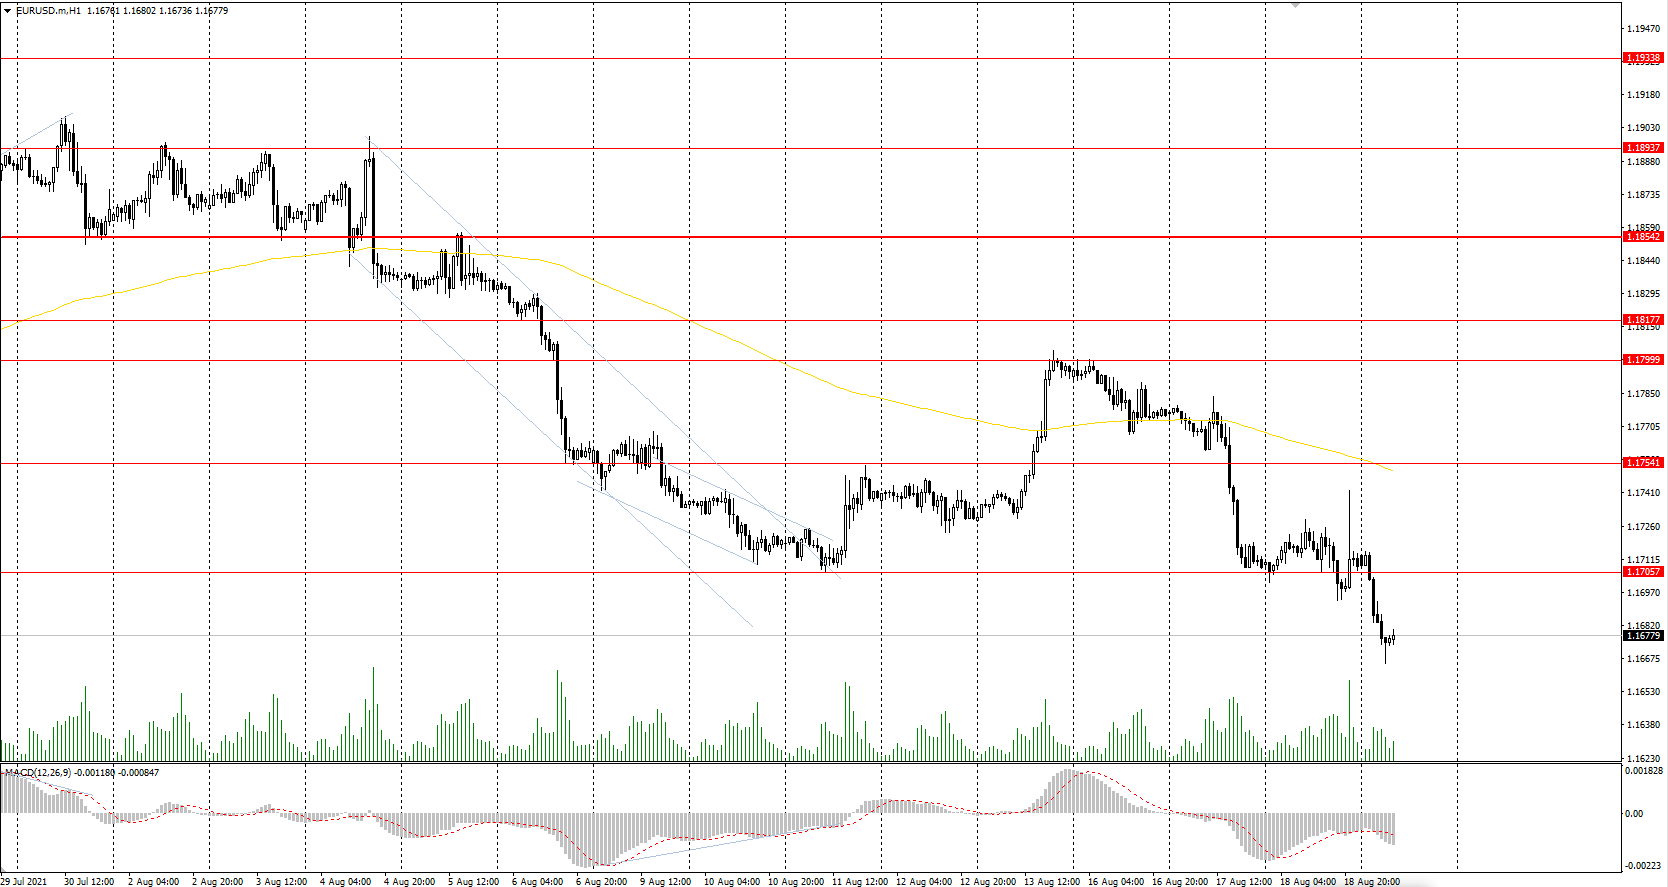
Support levels: 1.1609
Resistance levels: 1.1706, 1.1754, 1.1799, 1.1817, 1.1854, 1.1894, 1.1934, 1.1969
From a technical point of view, the general trend on the EUR/USD currency pair is bearish. The price is declining within a bearish trend. Under such market conditions, it is better to look for the sell deals from the resistance levels, when there is an initiative from the sellers. Buy trades can be considered only from the support levels and only after the buyers’ initiative. There is divergence that occured in the MACD indicator, so the price may correct a little bit higher.
Alternative scenario: if the price breaks through the 1.1854 resistance level and fixes above, the mid-term uptrend will likely resume.
News feed for 2021.08.19:
- US Philadelphia Fed Manufacturing Index (m/m) at 15:30 (GMT+3);
- US Initial Jobless Claims (w/w) at 15:30 (GMT+3).
The GBP/USD currency pair
Technical indicators of the currency pair:
Prev Open: 1.3734
Prev Close: 1.3751
% chg. over the last day: +0.12%
UK inflation decreased from 2.5% to 2%, which is in line with the Bank of England's target rate. But analysts tend to believe that the UK inflation rate will increase to 4% this year as the National Statistics does not account for the initial spike in prices in the early stages of last year's quarantine restrictions in its calculations.
Trading recommendations
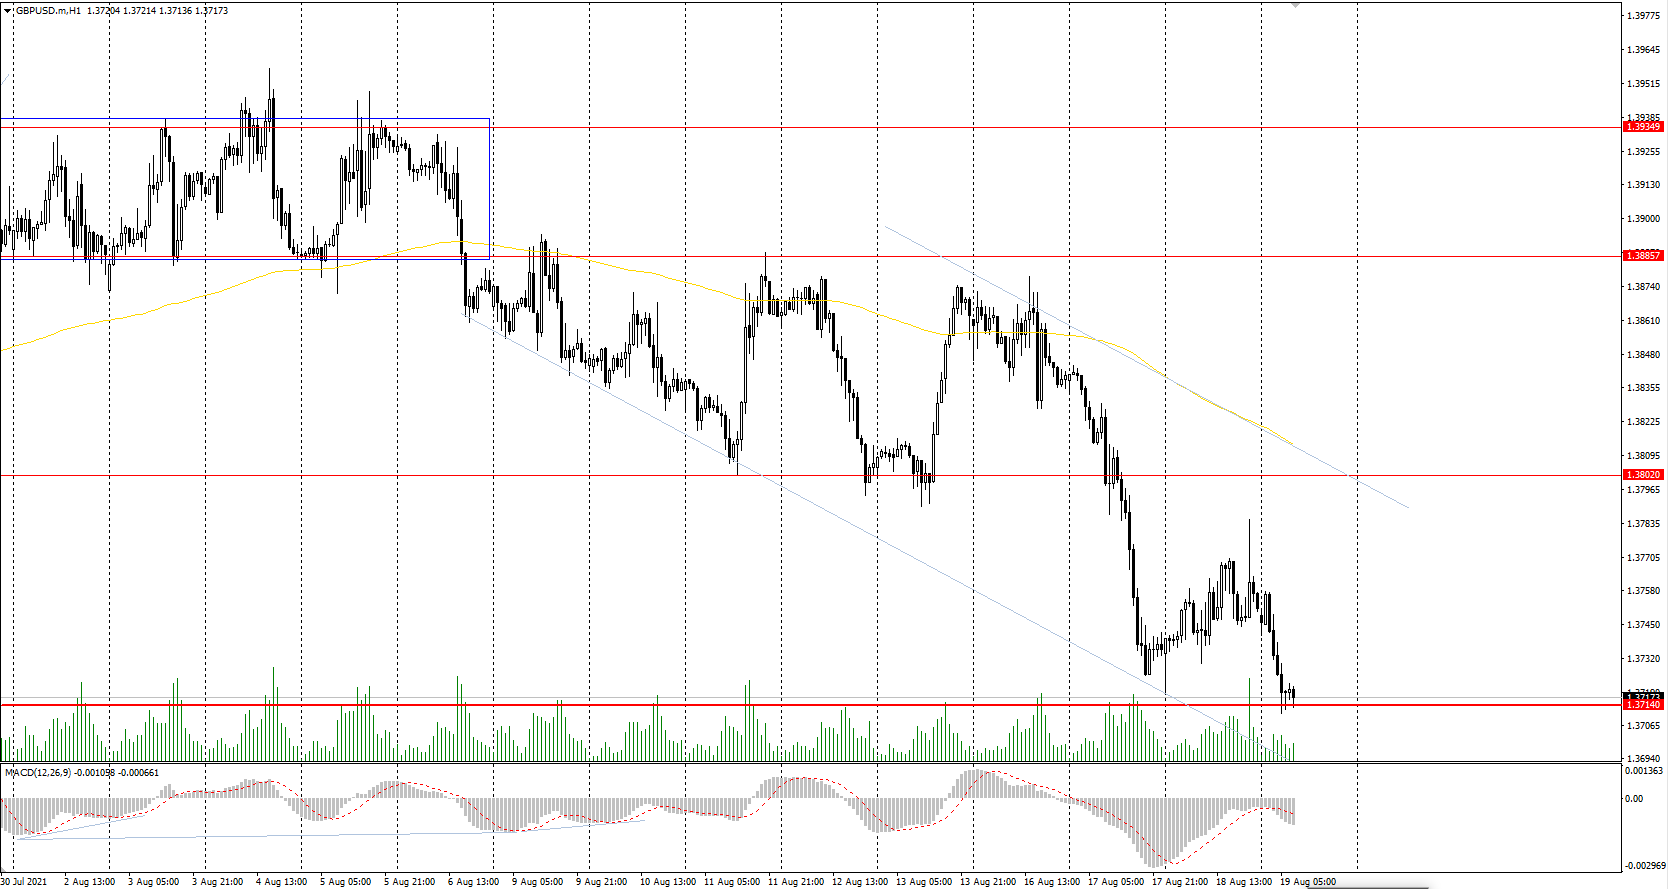
Support levels: 1.3714, 1.3676 ,1.3641, 1.3614, 1.3525
Resistance levels: 1.3802, 1.3772, 1.3886, 1.3935, 1.4002, 1.4075, 1.4101
The trend of the GBP/USD currency pair is bullish on the hourly timeframe. But the price is close to the priority change level. The MACD indicator is in the negative zone, there are signs of a reversal in the form of divergence. Under such market conditions, traders are better to look for the buy trades from the priority change level. But it is better to enter with confirmation because the sellers' pressure is very strong.
Alternative scenario: if the price breaks through the 1.3714 support level and consolidates below, the bearish scenario is likely to resume.
The USD/JPY currency pair
Technical indicators of the currency pair:
Prev Open: 109.55
Prev Close: 109.76
% chg. over the last day: +0.19%
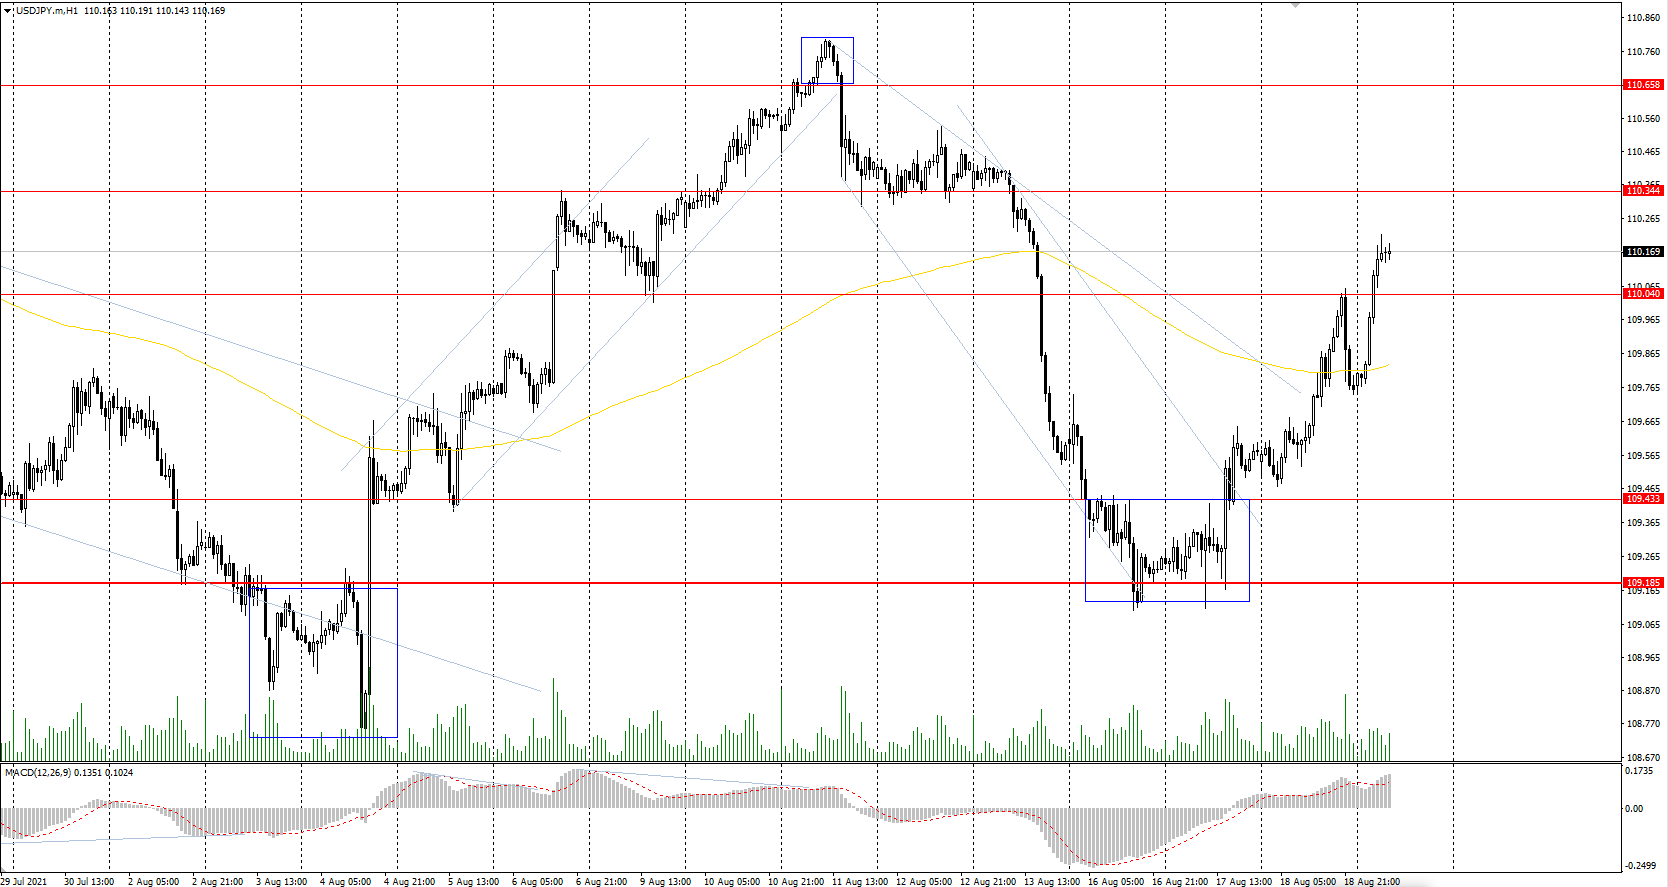
The USD/JPY currency pair is rising amid a strengthening of the dollar index. There is a medium-term trend on the currency pair is expected to be observed, as no significant changes in the monetary policy of Japan are expected in the near future.
Trading recommendations
Support levels: 110.04, 109.43, 109.19, 108.65
Resistance levels: 110.34, 110.66, 110.95, 111.48
The main trend on the USD/JPY currency pair is bullish. The price managed to consolidate above the moving average line. The MACD indicator began to show growth without any signs of a reversal. Under such market conditions, it is better to look for the buy positions from the support level, where the buyers show initiative. Sell positions should be considered only on the lower timeframes from the resistance levels with short targets.
Alternative scenario: if the price falls below 109.19, the uptrend is likely to be broken.
The USD/CAD currency pair
Technical indicators of the currency pair:
Prev Open: 1.2523
Prev Close: 1.2652
% chg. over the last day: +0.23%
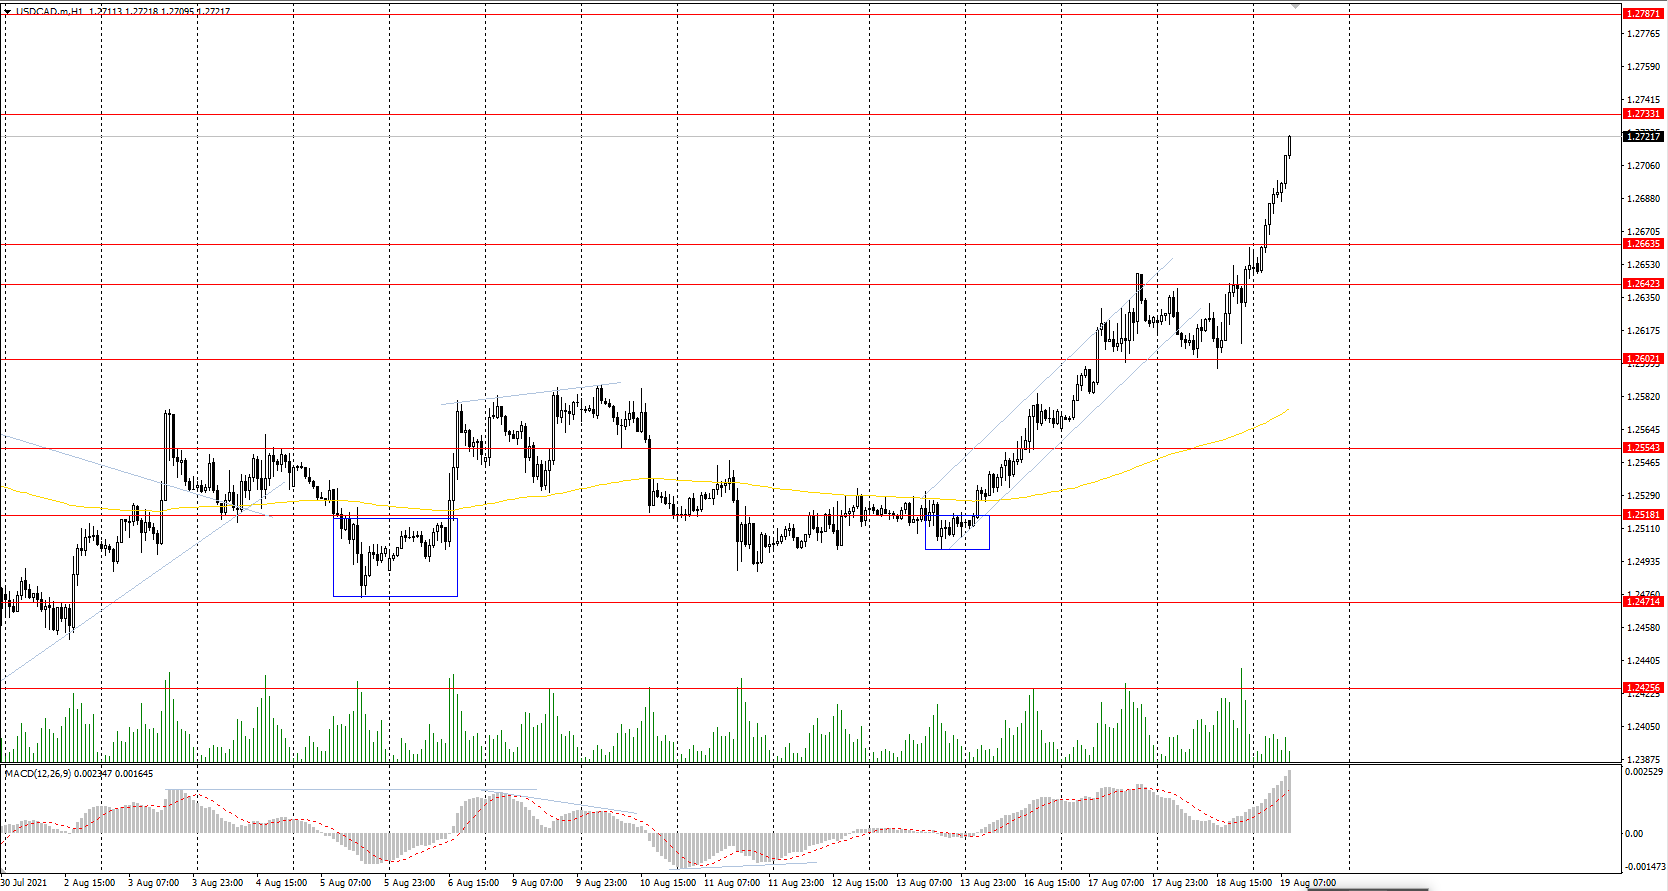
Canada's annual inflation rate increased to 3.7%, the biggest jump in a decade. Yesterday, oil prices declined slightly and the dollar index rose, as a result, USD/CAD quotations increased by 0.23% and broke through the priority change level.
Trading recommendations
Support levels: 1.2663, 1.2642, 1.2602, 1.2561, 1.2518
Resistance levels: 1.2733, 1.2787, 1.2951
In terms of technical analysis, the trend on the currency pair USD/CAD has changed to bullish. But now the price has deviated strongly from the moving average, the MACD indicator is in the overbought zone with signs of a hidden divergence. Under such market conditions, traders are better to look for sell positions from the resistance levels, after the sellers' initiative appears. Buy positions should be considered from the support levels after a slight pullback below.
Alternative scenario: if the price breaks through the 1.2562 support level and fixes below, the uptrend is likely to be broken.
The Fed May Reduce The QE Program This Year
The FOMC minutes of the July meeting suggest that the reduction of the QE program may take place as soon as this year. September is just around the corner, so the labor market still needs better data before the central bank begins cutting stimulus measures. Investors' attention is now focused on the annual economic symposium that will take place next week, where Jerome Powell will disclose the details about the future plans of the Fed. Considering this news, investors began to close their positions partially. As a result, major stock indices began to decline. The S&P 500 index decreased by 1.07%, the Dow Jones lost 1.08%, and the Nasdaq decreased by 0.89%. Major indices are very likely to trade in a wide price range in the next month or two. After the announcement of the beginning of the QE program reduction, a large correction will take place in the market, so investors should rebalance their portfolios.
European stock indices were trading without a single dynamic yesterday. By the time the market closed, the composite index of Stoxx Europe 600 increased by 0.14%, British FTSE 100 decreased by 0.16%, French CAC 40 lost 0.73%. At the same time, German DAX increased by 0.28%, Italian FTSE MIB added 0.5%, Spanish IBEX 35 jumped by 1.18%. The EU consumer price index showed that the inflation rate in Europe increased from 1.9% to 2.2%, above the ECB target level of 2%. It is not clear now how the ECB will react to this, especially considering the fact that the ECB's balance sheet is already over 8 trillion euros and now equals 78.1% of Eurozone GDP versus the Fed's 36.3% and the Bank of England's 38.5%. The UK inflation decreased from 2.5% to 2%, in line with the Bank of England's target rate. But analysts believe that the UK inflation rate will rise to 4% this year.
Oil prices continue to decline. Quotes are near 3-month lows amid a stronger dollar and continuing concerns about demand forecasts due to the active spread of a new strain of coronavirus. But the supply level is still far behind the demand level, so analysts expect the growth of quotes to $80 per barrel in the mid-term.
The gold remains unchanged. As long as monetary policy remains soft, precious metal prices tend to rise. But as soon as the Federal Reserve announces it will begin cutting the QE program, gold and silver could fall heavily.
The Central Bank of Sri Lanka (CBSL) was the first in Asia to raise interest rates to curb inflationary pressures. The US Department of Transportation said it would limit passenger traffic on some Chinese carriers to 40% for four weeks after the Chinese government imposed similar restrictions on four United Airlines flights. Australia's unemployment rate fell to 4.6% (previously 4.9%), as reducing the number of working hours and a decrease in the number of people looking for work softened the consequences of quarantine in Sydney.
Main market quotes:
- S&P 500 (F) 4,400.27 -47.81 (-1.07%)
- Dow Jones 34,960.69 -382.59 (-1.08%)
- DAX 15,965.97 +44.02 (+0.28%)
- FTSE 100 7,169.32 -11.79 (-0.16%)
- USD Index 93.16 +0.03 (+0.03%)
Important events for today:
- Australia Employment Change (m/m) at 04:30 (GMT+3);
- Australia Unemployment Rate (m/m) at 04:30 (GMT+3);
- US Philadelphia Fed Manufacturing Index (m/m) at 15:30 (GMT+3);
- US Initial Jobless Claims (w/w) at 15:30 (GMT+3);
- Natural Gas Storage (w/w) at 17:30 (GMT+3).
ECB Lane explains three conditions for rate hike
ECB Chief Economist Philip Lane explained a a blog post the three key conditions for lifting interest rates, as reflected in the latest forward guidance.
The first condition "until we see inflation reaching two per cent well ahead of the end of our projection horizon" provides reassurance that the convergence of inflation towards the new target should be sufficiently advanced and mature at the time of policy rate lift off. It helps to "hedge monetary policy against the risk of reacting to forecast errors".
The second condition expects inflation to stay at 2% "durably for the rest of the projection horizon". It "telegraphs that reaching the inflation target should be lasting."
The third condition "progress in underlying inflation is sufficiently advanced to be consistent with inflation stabilising at two per cent over the medium term" signals that policy rates should not be lifted unless underlying inflation is also judged to have made satisfactory progress towards the target.
Lane further explained that "underlying inflation" is a broad concept and refers to the persistent component of inflation that filters out short-lived, reversible movements in the inflation rate and provides the best guide to the medium-term inflation developments
Also, the sentence that the forward guidance "may also imply a transitory period in which inflation is moderately above target" makes explicit that rate forward guidance that is committed to avoiding premature tightening.
AUDUSD Tumbles To New 9-Month Low
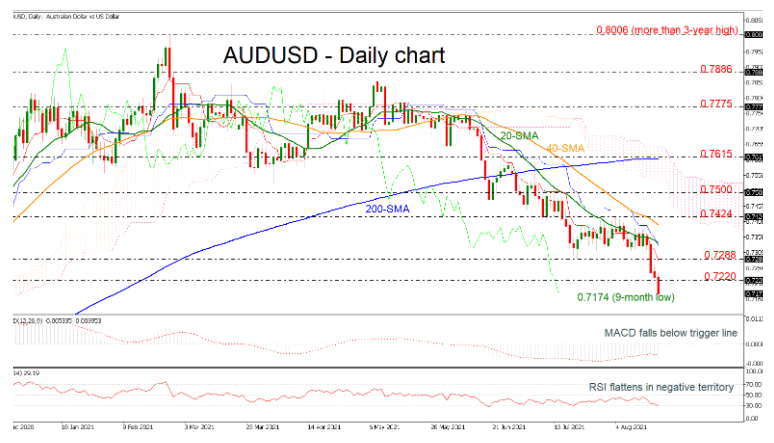
AUDUSD has reached a new nine-month low of 0.7174, which holds beneath the significant 200-week simple moving average (SMA). The negative structure in the price is confirmed by the technical indicators. The MACD oscillator decreased beneath its trigger line in the negative region, while the RSI is moving slightly lower near the oversold area.
If the price dips further, this could take the market towards the next strong support at 0.6990, registered in November 2020 ahead of the 0.6775 barrier, taken from the bottom in June 2020.
On the flip side, a bullish correction could drive the market towards the 0.7288 resistance ahead of the 20-day SMA at 0.7350. Above these hurdles the bulls could retest the 40-day SMA at 0.7407 and the 0.7424 resistance. The 0.7500 psychological level could halt upside movements before taking the pair until the 200-day SMA at 0.7610.
All in all, AUDUSD has been in a strong falling mode since May 10 and only a significant daily close beyond the 200-day SMA may switch this view to positive.
Daily Tecnical Analysis
EUR/USD
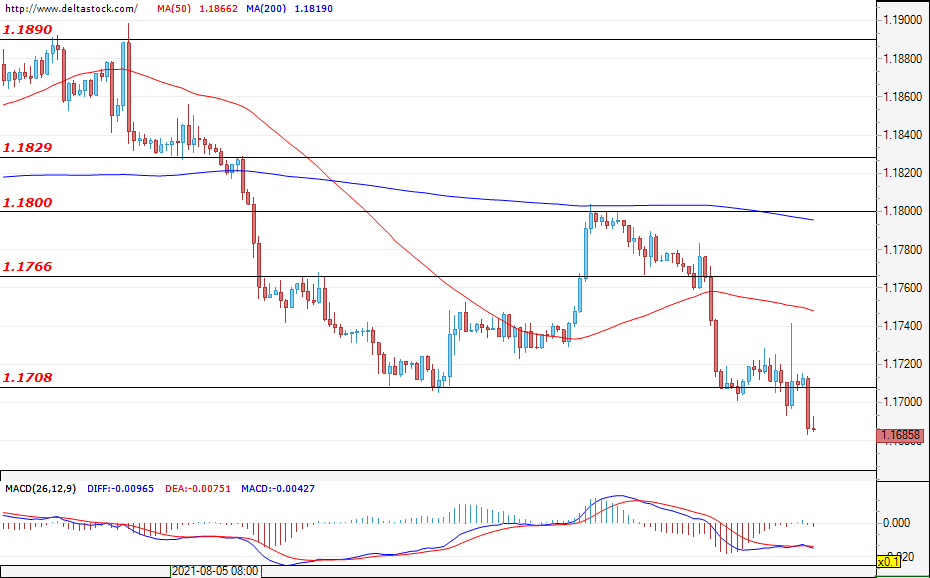
Current level - 1.1685
The euro continued to lose ground against the Greenback and the support around 1.1708 was breached. The zone was the annual low recorded back in March. The breach of this level could exacerbate the sell-offs towards the support at around 1.1600. The first intraday resistance is found just over 1.1708, followed by 1.1766. Sentiment remains sour and a lasting rally can be expected only above the resistance of 1.1800. Today, increased activity can be expected around the announcement of the data on the initial jobless claims for the United States at 12:30 GMT.
| Resistance | Support | ||
| intraday | intraweek | intraday | intraweek |
| 1.1708 | 1.1800 | 1.1650 | 1.1600 |
| 1.1766 | 1.1830 | 1.1600 | 1.1400 |
USD/JPY
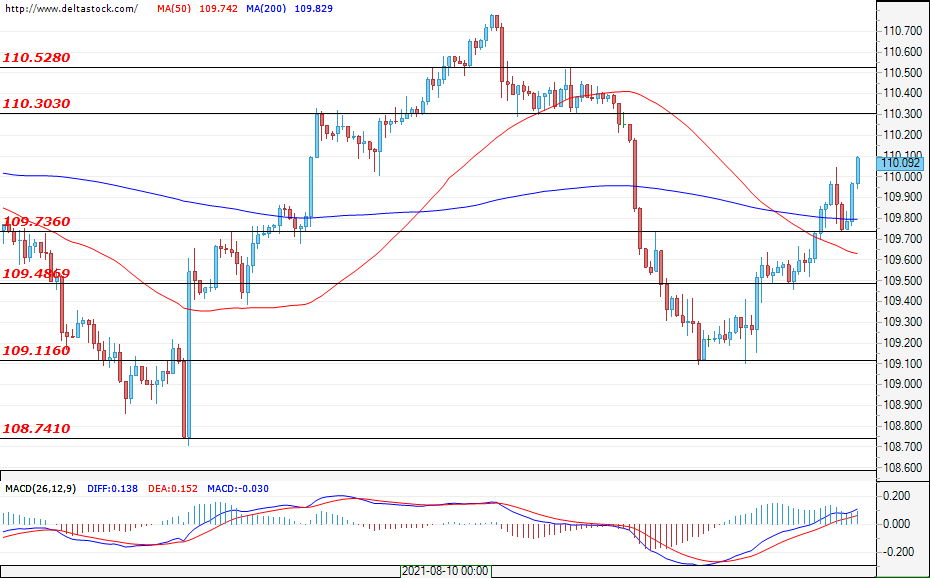
Current level - 110.09
The currency pair continued to rise yesterday, and the dollar gained more momentum after the final interest rate decision from the Fed minutes became clear. The bulls are likely to again attack the resistance zone between 110.30 and 110.52. This area turns out to be quite a difficult obstacle for the buyers, but if a breach here is successful, prices can rise to 111.65 and even 113.50. The first daily support for the bulls is 109.73, and the main one remains the area at around 109.22.
| Resistance | Support | ||
| intraday | intraweek | intraday | intraweek |
| 110.30 | 111.00 | 109.73 | 109.11 |
| 110.52 | 110.50 | 109.48 | 108.74 |
GBP/USD
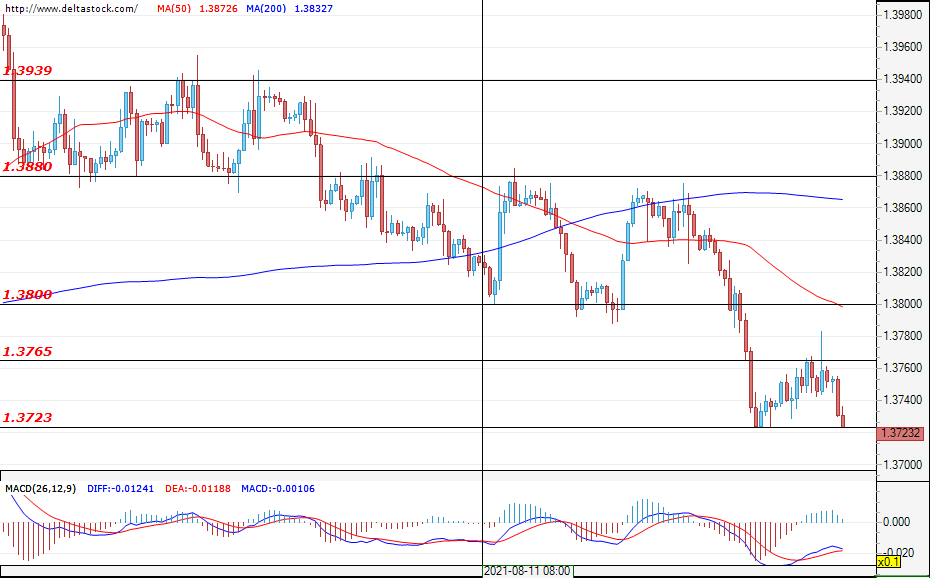
Current level - 1.3723
Like most currencies, the pound also suffered losses against the U.S. dollar. The downward move gained momentum and the declines are expected to continue. A potential target for the bears could be the support at 1.3600. First daily resistances are 1.3765 and 1.3800. At the moment, a change in the downtrend seems unlikely.
| Resistance | Support | ||
| intraday | intraweek | intraday | intraweek |
| 1.3765 | 1.3880 | 1.3723 | 1.3600 |
| 1.3800 | 1.3939 | 1.3600 | 1.3550 |
USD/CAD Resumes Rally
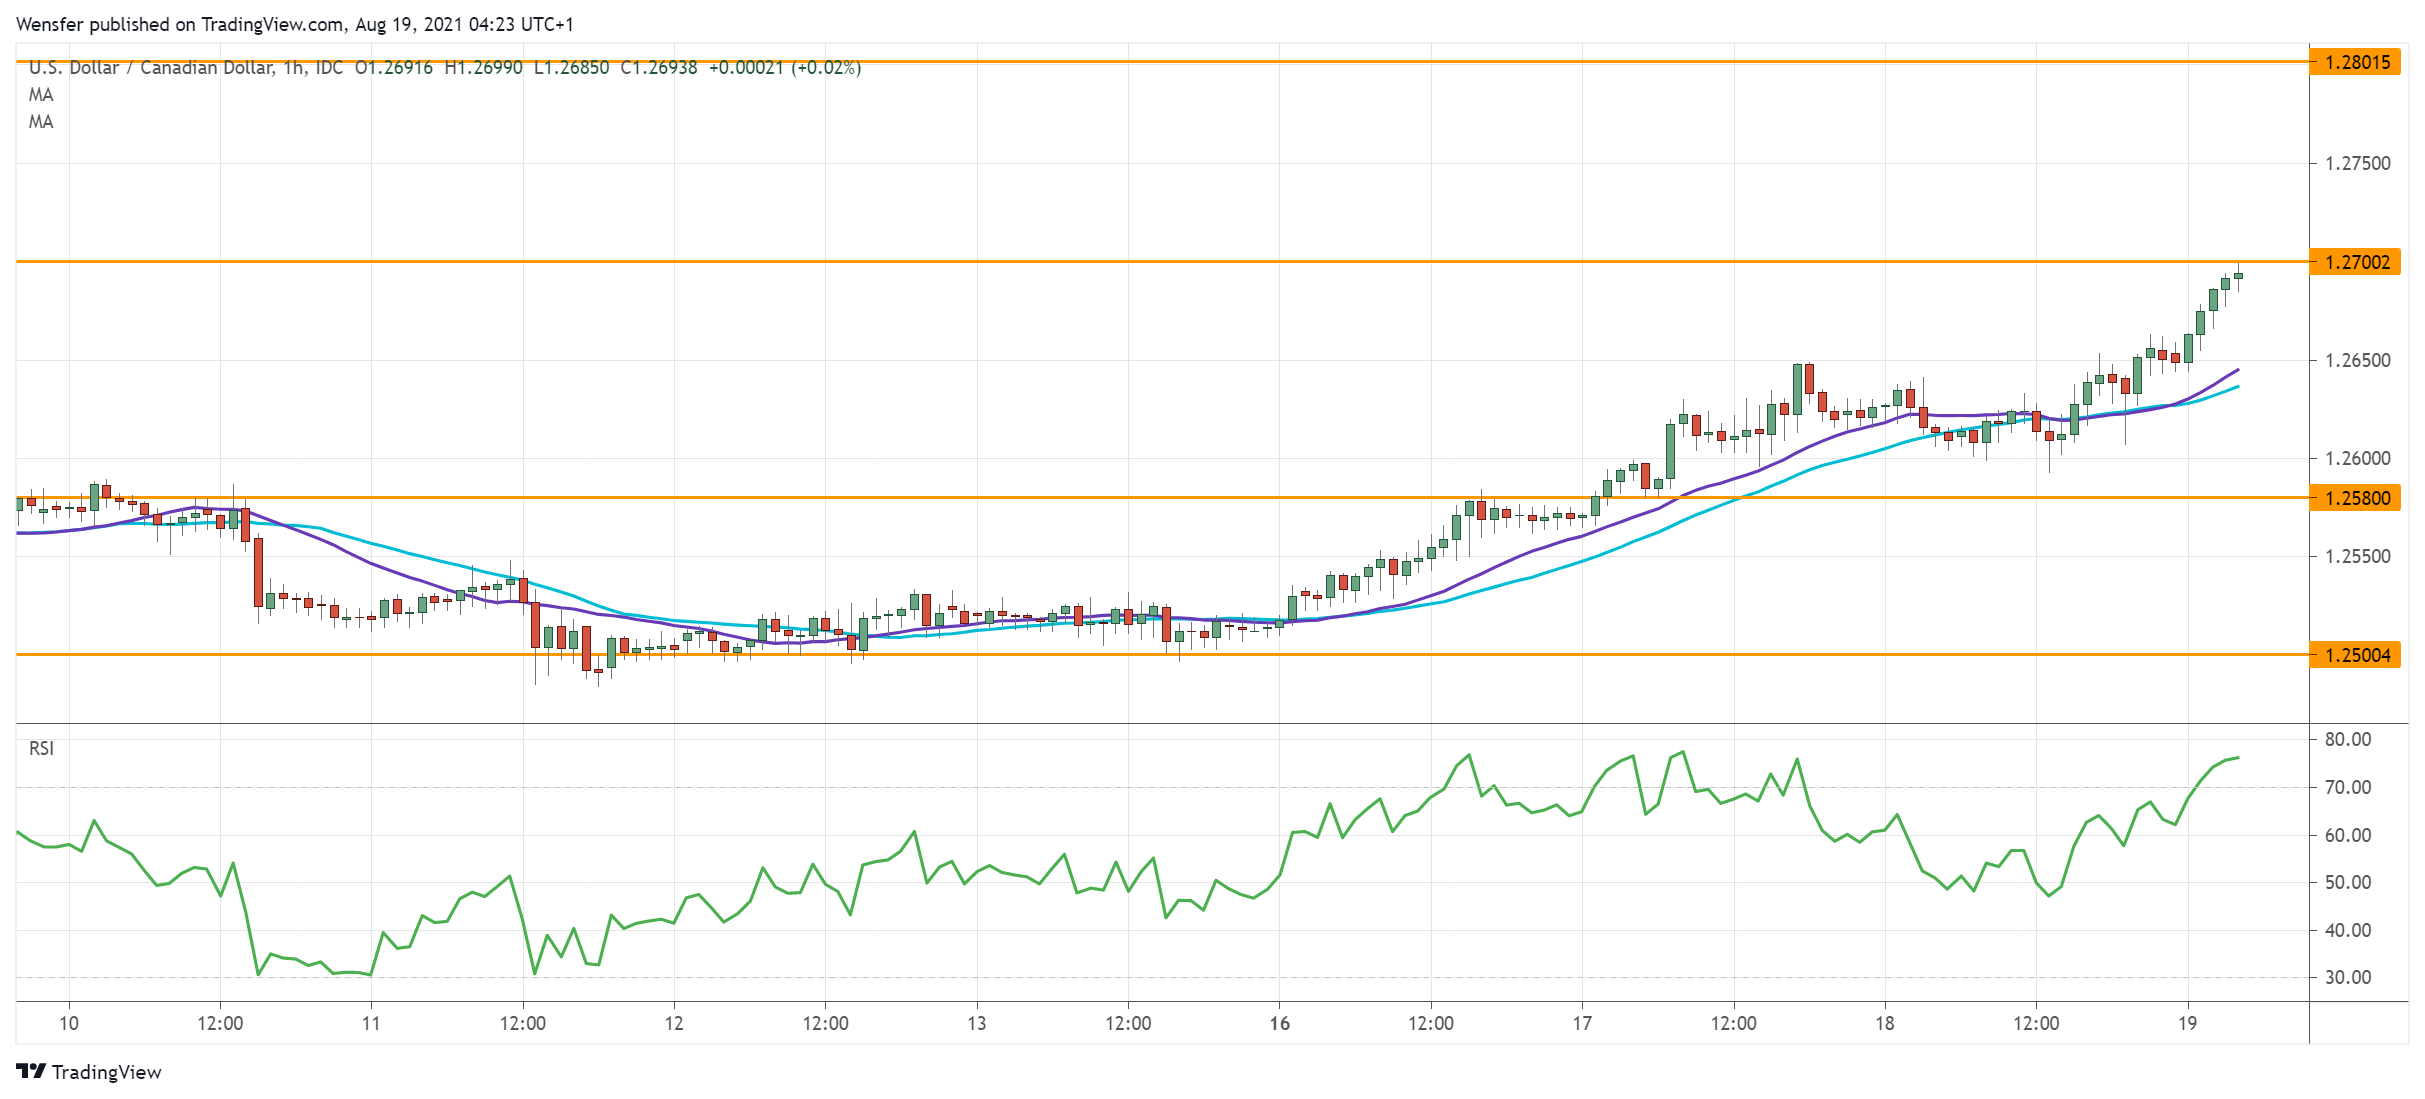
Upbeat BOC CPI failed to outweigh the US Fed’s hawkish July minutes. The US dollar’s rally has gained traction after it cleared the supply area at 1.2600.
A combination of short-covering and fresh buying suggests that the uptrend may have resumed after a month-long consolidation. An overbought RSI may cause a limited pullback.
The resistance-turned-support at 1.2580 would see buying interest in that case. On the upside, a break above 1.2700 could open the door to the peak at 1.2800.